3796
A 3D-Printed Multi-level Perfusion Phantom for Quantitative Analysis of Perfusion Models vs. Experimental Data1Cornell University, New York, NY, United States
Synopsis
Current methods for perfusion characterization are difficult to quantify absolutely and provide only relative and qualitative information. Perfusion-phantoms that enable quantitative analysis of transport phenomena are needed to test theoretical models against experimental data. The initial design and deployment of a 3D-printed phantom with pump-driven perfusion of multi-level microvascular structure encapsulated in hydrogel is presented. It simulates vascularized tissue and enables experimental validation. A new quantitative analytical method , using voxelized constitutive convection-diffusion equations, is applied to DCE data and compared to traditional Kety’s methods. The largely qualitative and unmeasurable Kety global AIF assumption is replaced with measurable and reproducible data.
Introduction and Synopsis
Current methods used to characterize perfusion are difficult to quantify absolutely and at best provide only relative and qualitative information. MRI perfusion-phantoms that enable quantitative analysis of transport phenomena are needed to validate new theoretical models against experimental data. Presented here is the initial design and deployment of a first-generation, 3D-printed phantom with pump-driven perfusion of multi-level microvascular structure encapsulated in hydrogel. The phantom simulates 3D-vascularized tissue and enables experimental validation of flow. A new method for quantitative analysis of perfusion, using voxelized constitutive equations for convective-diffusive transport, is applied to experimental DCE data and compared to the traditional Kety’s method. High-resolution (vessel geometry visible), down-sampled and low-resolution data (geometry undistinguishable) are analyzed. The largely qualitative and unmeasurable global arterial input function (AIF) assumption in Kety’s method is replaced with measurable and reproducible MRI experimental data, formulated as quantitative transport mapping (QTM). Preliminary data demonstrate that the QTM phantom is promising for characterizing actual blood transport in healthy and pathological contexts.Methods and Theory
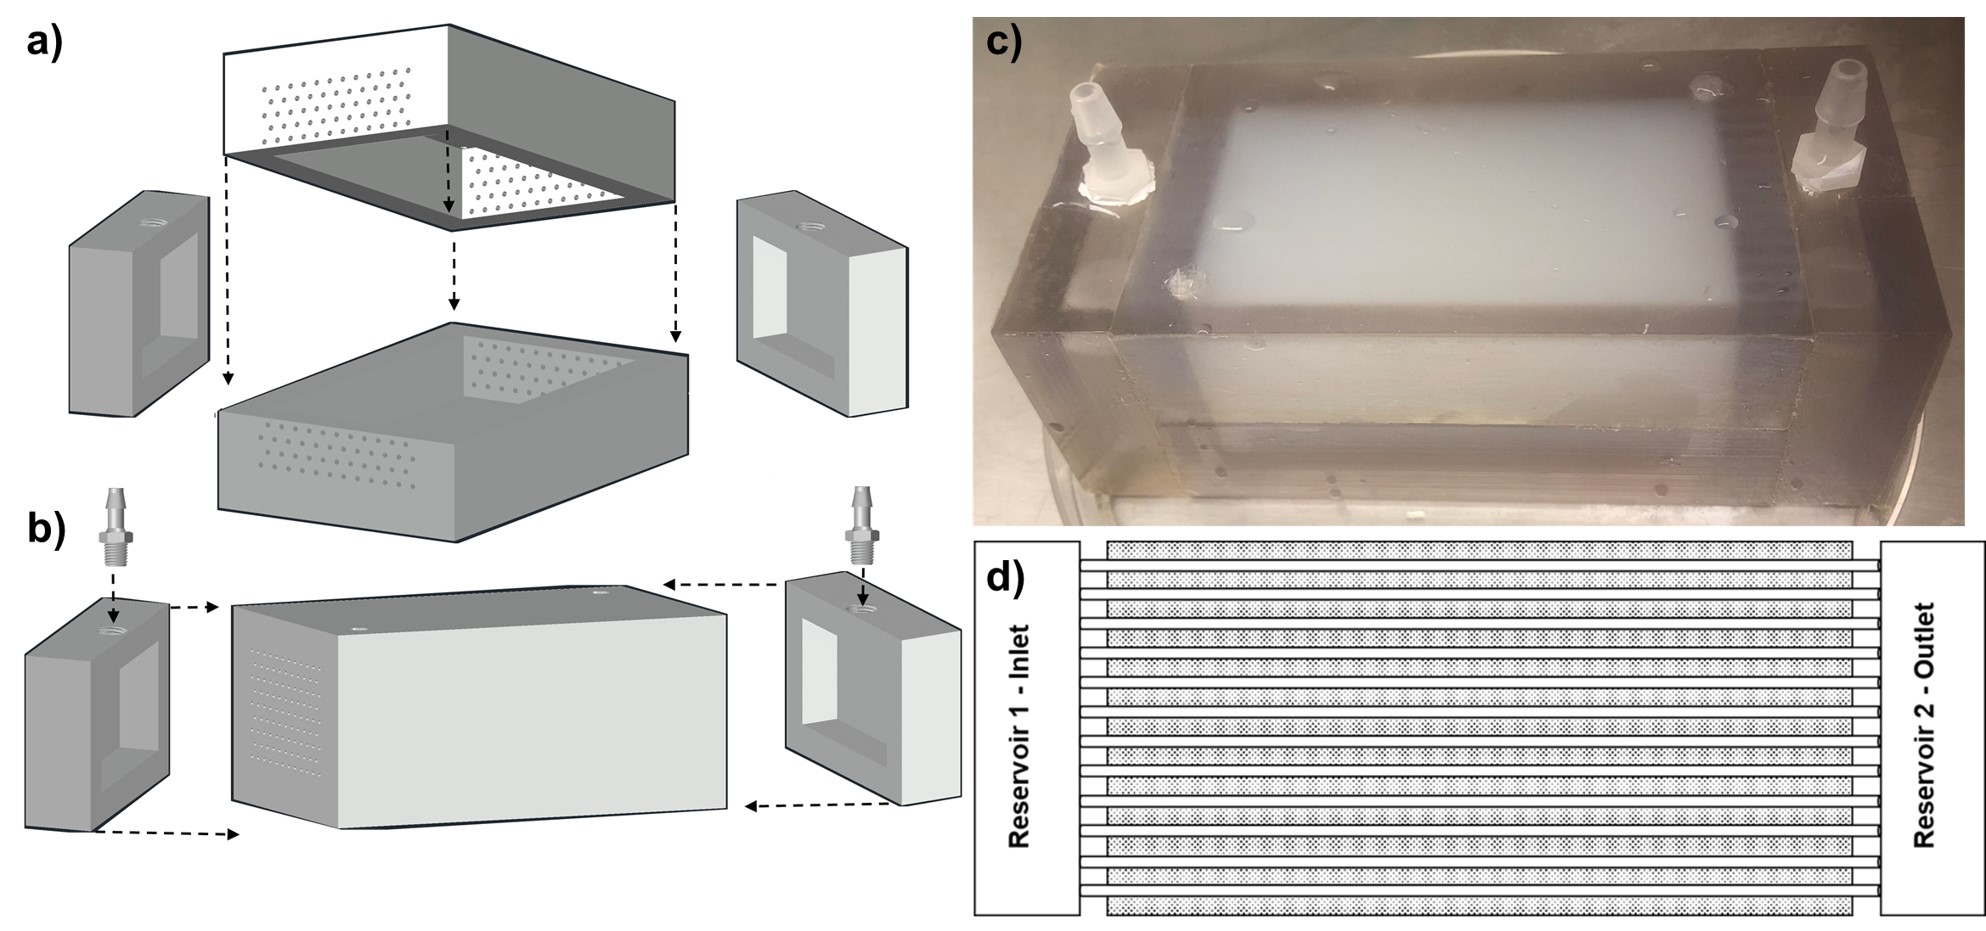
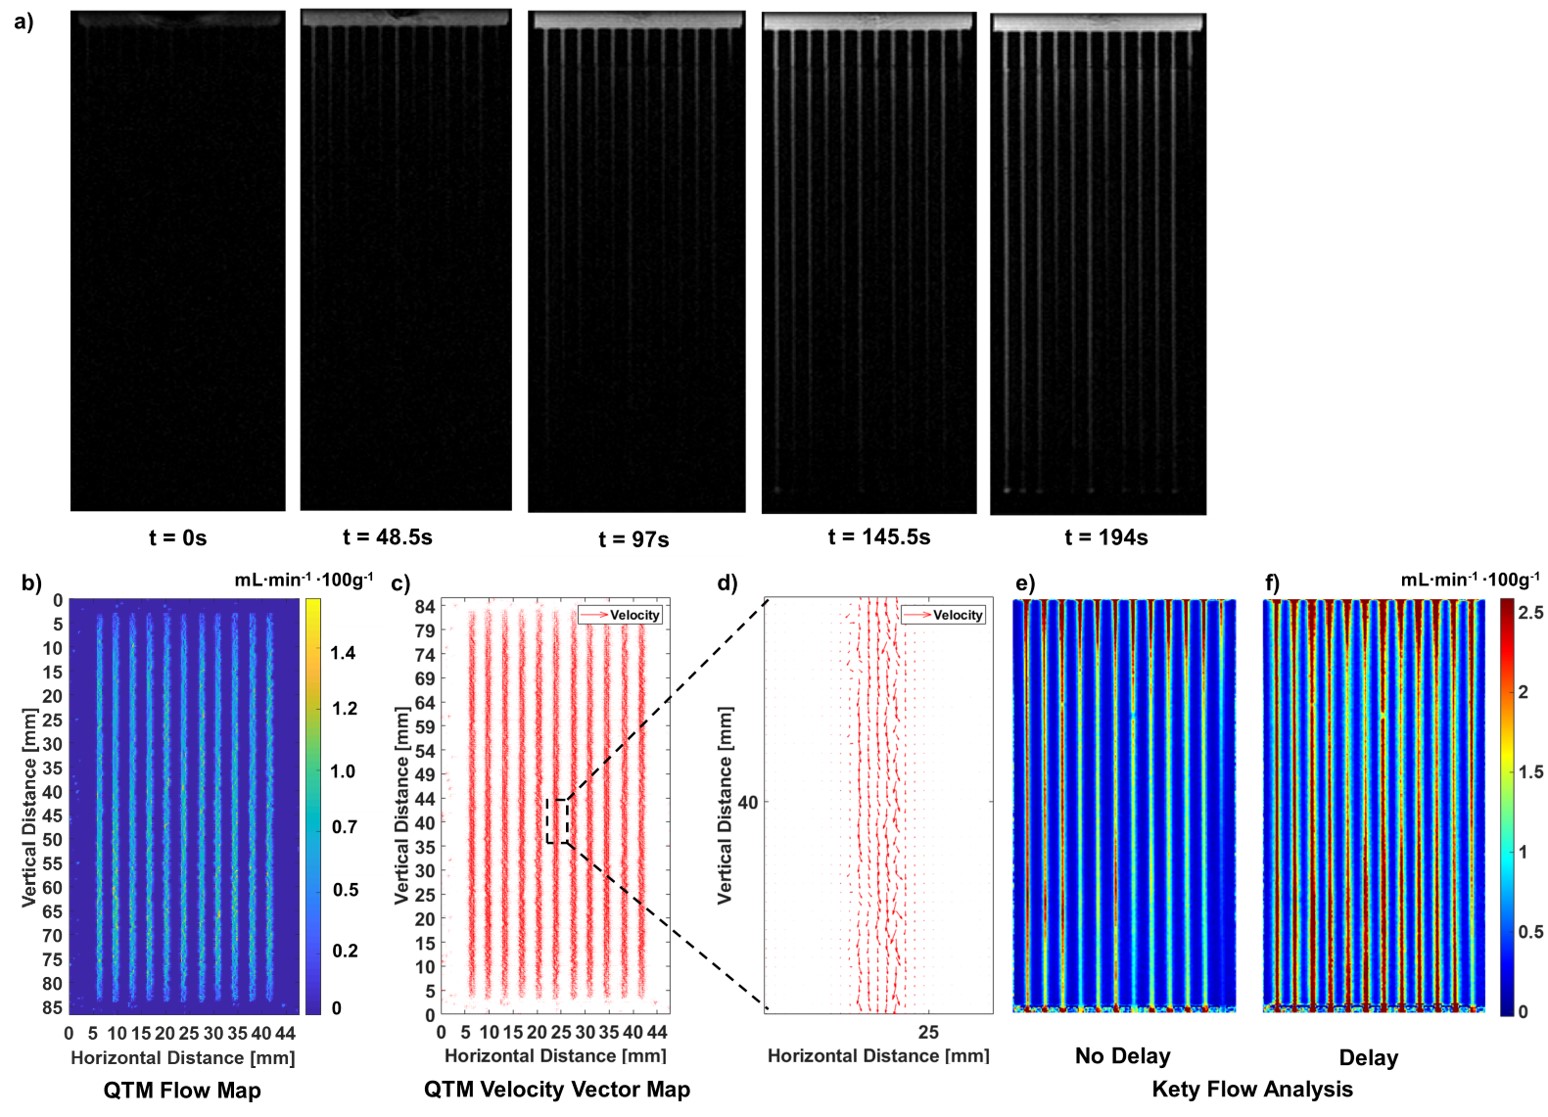
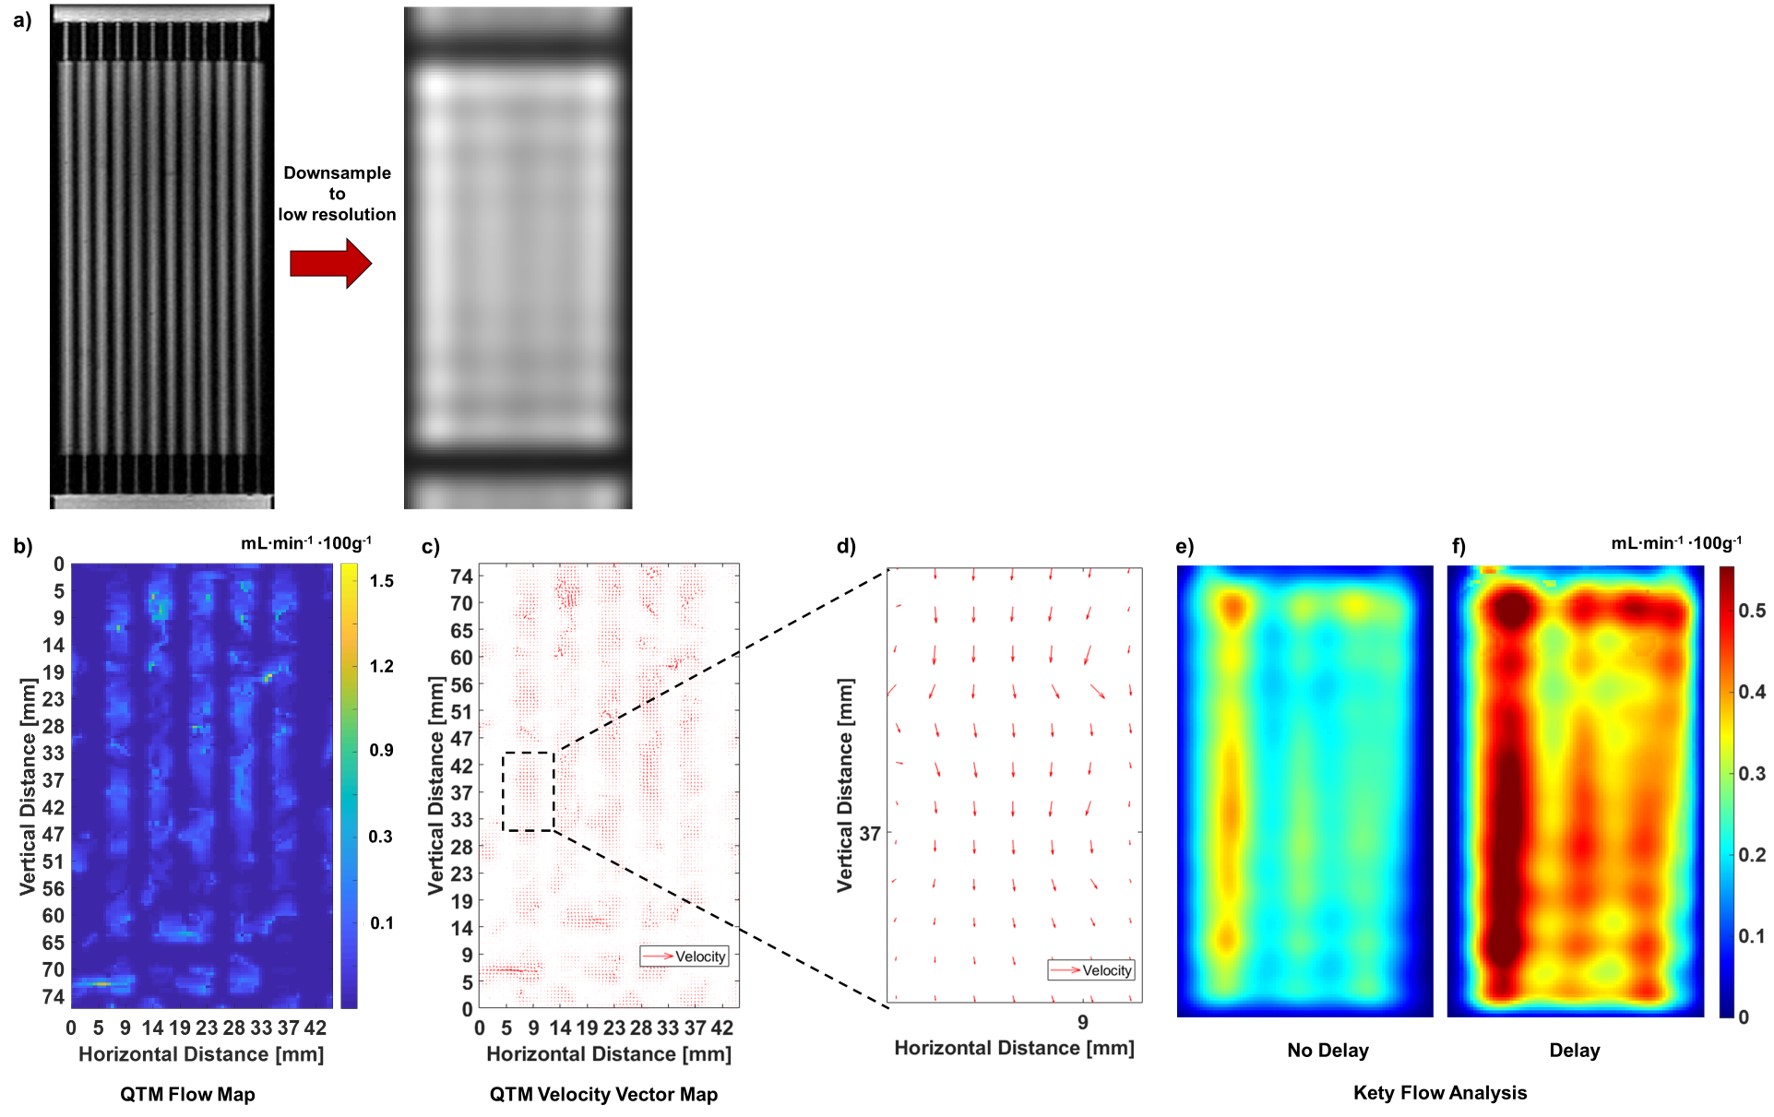
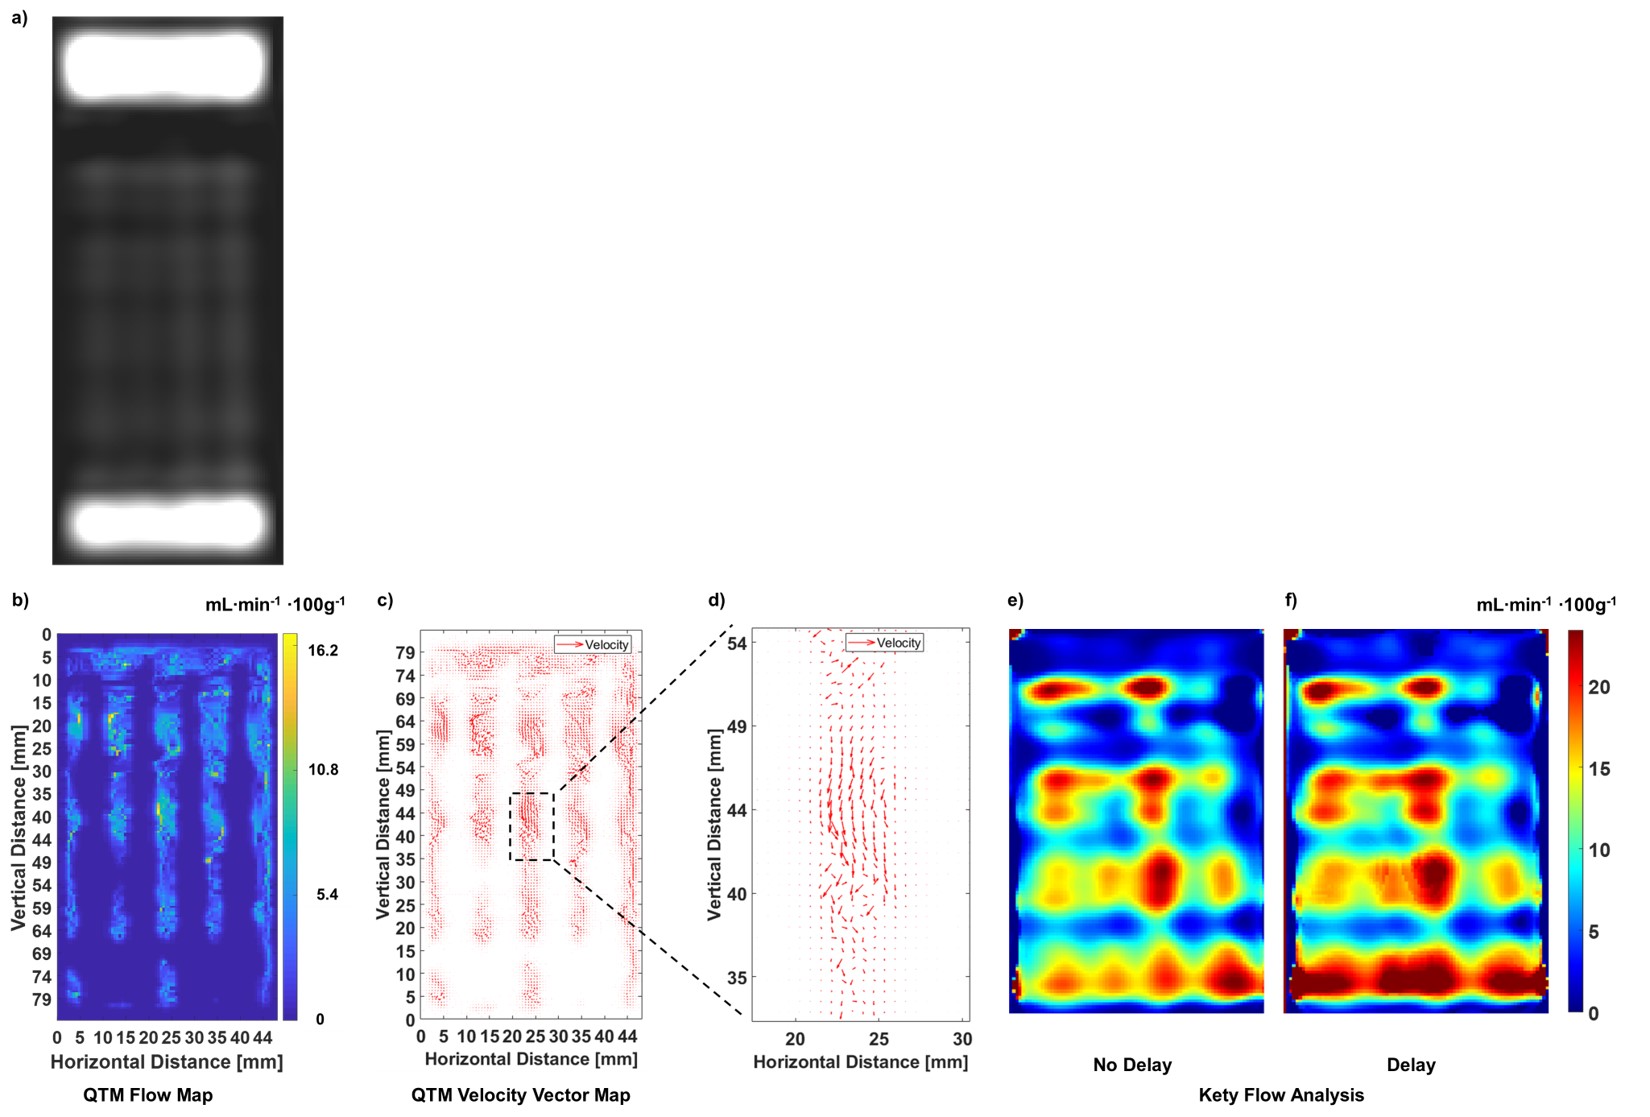
The microfluidic perfusion phantom is 3D printed and MRI-compatible, with connections for MR-power-injectors or pumps to perfuse fluid into a sealed chamber encapsulating multi-level microvasculature structure within hydrogel (Fig.1). It was 3D-printed (Stratasys-BJE260Connex-VeroClear™) from stereolithographic files (AutoCAD™). Injection molding of the hydrogel onto sacrificial templates created the vascular structure . The phantom was connected to an MR power-injector and perfused with 1% gadolinium tracer. Gradient echo data was acquired at both high-resolution, to visualize detail vascular structure, and lower (clinical) resolution using a GE-MR750-3T scanner with flexible coils. Acquisition parameters: bandwidth=±62.5 kHz, Flip angle=20⁰, TR=5.5ms, TE=1.992mS, voxel=(0.4x0.4x1.1)mm3, acquisition matrix=256×256×512, temporal resolution=8s, FOV=(10.5×5.5)mm2 (high res.); and TR=2.1ms, TE=0.7ms, voxel=(5.0×5.0×5.6)mm3 voxel, acquisition matrix=64×64×512, temporal resolution=5.8s, FOV=(32×16)mm (low res.). QTM and Kety’s approach were used to analyze the high, down-sampled-high and low-resolution scans. For QTM, the voxelized convection-diffusion equation of mass flux is$${\partial_t} c({\bf{r}},{t})=-\nabla \cdot {c({\bf{r}},t){\bf{u}}({\bf{r}},t)}+\nabla\cdot{D}\nabla{c({\bf{r}},t)}+\epsilon({\bf{r}},t)$$
where $$$c({\bf{r}},{t})$$$ is the tracer concentration, $$${\bf{r}}=\begin{bmatrix}r_{x},r_y,r_{z} \end{bmatrix}$$$ position vector, $$$t$$$ time, $$${\partial_t}$$$ time derivative, $$${\nabla}$$$ three-dimensional spatial derivative, $$${\bf{u}}{(}{\bf{r}}{)}=\begin{bmatrix}u^{x},u^y,u^{z} \end{bmatrix}$$$ velocity averaged over a voxel, $$${D}$$$ constant diffusion coefficient, and $$${\epsilon({\bf{r}},{t})}$$$ residual error. The derivatives of space and time in Eq.1 were discretized at the spatiotemporal resolution of imaging data. The discretized voxelized transport equation is used to formulate an inverse problem for estimating velocity via optimization. Tracer concentration maps are derived from time-resolved imaging data. A 4-D vector at each voxel is defined: $$${u(\zeta)}=\begin{bmatrix}u^x(\zeta),u^y(\zeta),u^z(\zeta),u^D(\zeta) \end{bmatrix}\equiv\begin{bmatrix}u,D \end{bmatrix}$$$. Eq. 1 is discretized at all voxels as $$$A\vec{u}=\vec{b}$$$, were $$${A}$$$ is a large sparse matrix matrix containing the divergence operator and $$$\nabla{c}({\bf{\zeta}},{t_i})$$$, $$$\vec{u}$$$ and $$$\vec{b}$$$ are vectors obtained by concatenating $$$u({\bf{\zeta}})$$$ and $$$c({\bf{\zeta}},{t_i})$$$ for all voxels $$${\bf{\zeta}}$$$, respectively. The inverse problem for reconstructing the velocity field $$$\vec{u}$$$ is formulated as a constrained minimization problem:
$$\vec{u}=argmin_{\vec{u}}{\parallel}A\vec{u}-\vec{b}{\parallel}^2_2$$
Results
The phantom design and assembly is depicted in Fig. 1, including individual components (Fig.a), assembly (Fig.1b), final device photo (Fig.1c) and interior vessel structure schematic for a single slice (Fig.1d). A high-resolution scan shows detail vessel structure, including initial entry of the tracer (Fig.2a). QTM approximated the experimental flow with < 7% error (Figs.2b) and exhibited expected theoretical parabolic velocity profiles (Fig.2c-2d, ), while Kety’s method overstated the flow (Fig.2e-2f) by >80% error. This high-resolution scan was down-sampled to low-resolution (Fig. 3a) and its image analysis compared to the results from the original data. QTM maintained reasonable accuracy compared to experimental data (Fig.3b-3d) and high resolution scan analysis, while the Kety’s method deviated significantly from both the high resolution analysis and experimental actual (Figs.3e-3f). Finally, images acquired at low resolution to simulate clinical conditions (Fig.4a) were analyzed. The QTM analysis provided greater accuracy compared to the experimental flow (<10% error, Figs.4b-4d) than the Kety analysis (>30% error, Fig.4e-4f).Discussion
Preliminary data demonstrates the feasibility of simulating physiologic perfusion to enable quantitative MRI characterization in healthy and pathologic contexts. QTM mapped velocity fields with good accuracy versus actual flow, while Kety’s method suffered errors in mapping regional flow. For all experimental DCE-MRI data, QTM velocity maps were automatically generated, while Kety’s method required manual input of AIF and produced dissimilar flow patterns. Time-resolved tomographic imaging of tracer transport through tissue is critical to managing stroke, heart attack and cancer, but its present qualitative interpretation via Kety assumes a global AIF to all local tissues.1-3 Conversely, this phantom enables computation of velocity maps from time-resolved image data of tracer transport and the QTM approach eliminates a major practical and theoretical difficulty of selecting an AIF in Kety’s method for interpreting time-resolved imaging of tracer transport. The resulting quantifiable and reproducible approach provides a promising new method for validating theoretical perfusion models against known experimental conditions and characterizing blood-flow in a clinical context.Conclusion
The design, fabrication, operation and characterization of a first generation, 3D-printed, multi-level perfusion phantom has been presented that simulates 3D-vascularized tissue, and enables quantitative analysis of perfusion via MRI. It supports a new perfusion characterization method via Quantitative Transport Mapping (QTM), that will enable resolution of local transport constitutive equations to time-resolved imaging (4D-image data) of tracer flux in tissues, thus addressing the fundamental global arterial input function (AIF) limit in the current Kety’s method. QTM is feasible for automated processing of DCE-MRI data.Acknowledgements
No acknowledgement found.References
1. Bammer R. MR and CT Perfusion and Pharmacokinetic Imaging: Clinical Applications and Theoretical Principles: LWW; 2016.
2. Saremi F. Perfusion Imaging in Clinical Practice: A Multimodality Approach to Tissue Perfusion Analysis: LWW; 2015.
3. Barker PB, Golay X, Zaharchuk G, ebrary Inc. Clinical perfusion MRI techniques and applications. Cambridge medicine. Cambridge: Cambridge University Press,; 2013. p xv, 356 p.
Figures