3793
Variable flip angle T1 mapping with MT-balanced RF pulses1Biomedical Engineering, University of Southern California, Los Angeles, CA, United States, 2Electrical and Computer Engineering, University of Southern California, Los Angeles, CA, United States
Synopsis
Quantitative DCE requires accurate and precise pre-contrast M0/T1 maps. Variable flip angle (VFA) T1 mapping has good precision but has accuracy issues. Magnetization transfer (MT) effects is one of the major reasons for differences between VFA and reference IR-FSE T1 measurements. Here, we apply the recent framework for MT-balanced RF pulse design to high-resolution whole-brain T1 mapping.
Introduction
Quantitative DCE requires accurate and precise pre-contrast Mo/T1 maps. Variable flip angle (VFA) T1 mapping has good precision but has accuracy issues1. Magnetization transfer (MT) effects is one of the major reasons for differences between VFA and reference IR-FSE T1 measurements. Here, we apply the recent framework for MT-balanced RF pulse design2 to high-resolution whole-brain T1 mapping. We hypothesize that controlled saturation magnetization transfer (CSMT) pulses enable improved precision for both T1 and M0 estimates compared to non-CSMT pulses.Methods
MT-balanced Pulse Design: Nonselective multiband RF pulses were designed as described by the CSMT framework2. The base excitation pulse was a minimum-phase SLR pulse with a TBW product of 6. When multiband excitation pulses are generated, the peak amplitude of multiband pulses often violates its allowable peak B1 value. To circumvent this, the base excitation pulse was stretched (<2x) and started with a lower B1 amplitude. The base excitation pulse is designed as selective in a product spoiled gradient echo (SPGR) pulse sequence but the base and multiband excitation pulses are played as nonselective for a CMST scan without a slab-selective gradient in this study.VFA T1/M0 mapping: VFA 3D SPGR images were acquired on a 3T HDxt GE scanner using a body coil for RF transmission and an eight-channel receive head coil with a modified product SPGR pulse sequence. Imaging parameters were TR = 6.9ms, echo time = 3.4ms, pulse duration = 992ms, $$$\Delta/2\pi$$$=10kHz, $$$B_1^{rms}$$$ = 1.65 μT, anisotropic resolution = 0.94 x 0.94 x 2 mm3, coronal, without acceleration, 3:30 sec per scan. Seven flip angles were used: 1°, 1.71°, 2.92°, 5°, 8.55°, 14.62°, 25°.
T1 maps and M0 maps were estimated with the DESPOT1 method3. The RF transmit field was measured with the Bloch-Siegert method4 for B1+ compensation in relaxometry estimation. White matter and gray matter masks were obtained using the FSL5.0 FAST tool on the SPGR image with a flip angle of 25°.
Evaluation: Imaging was performed in a healthy adult volunteer (36/M). VFA T1 mapping was performed with conventional excitations (selective) and the proposed MT-balanced excitations (nonselective).
Results
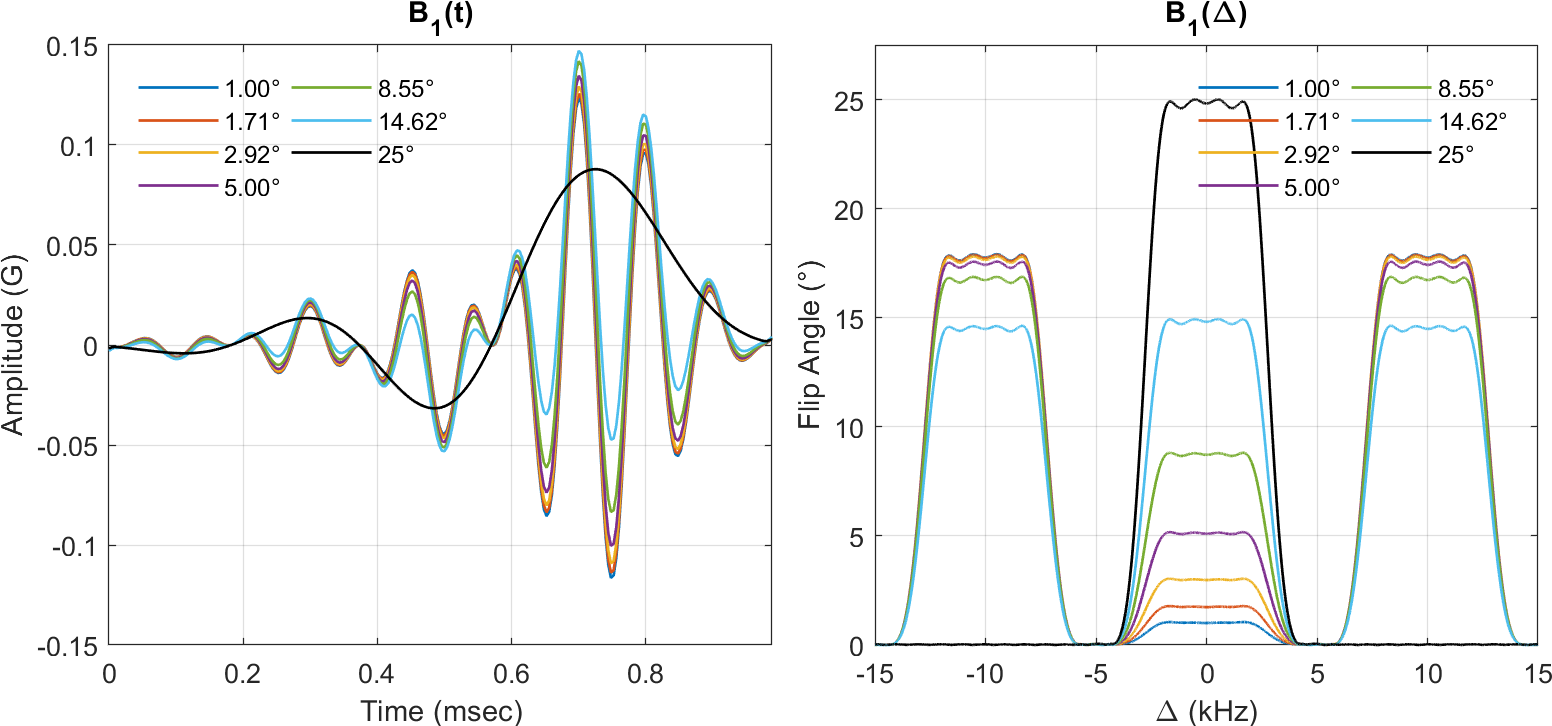
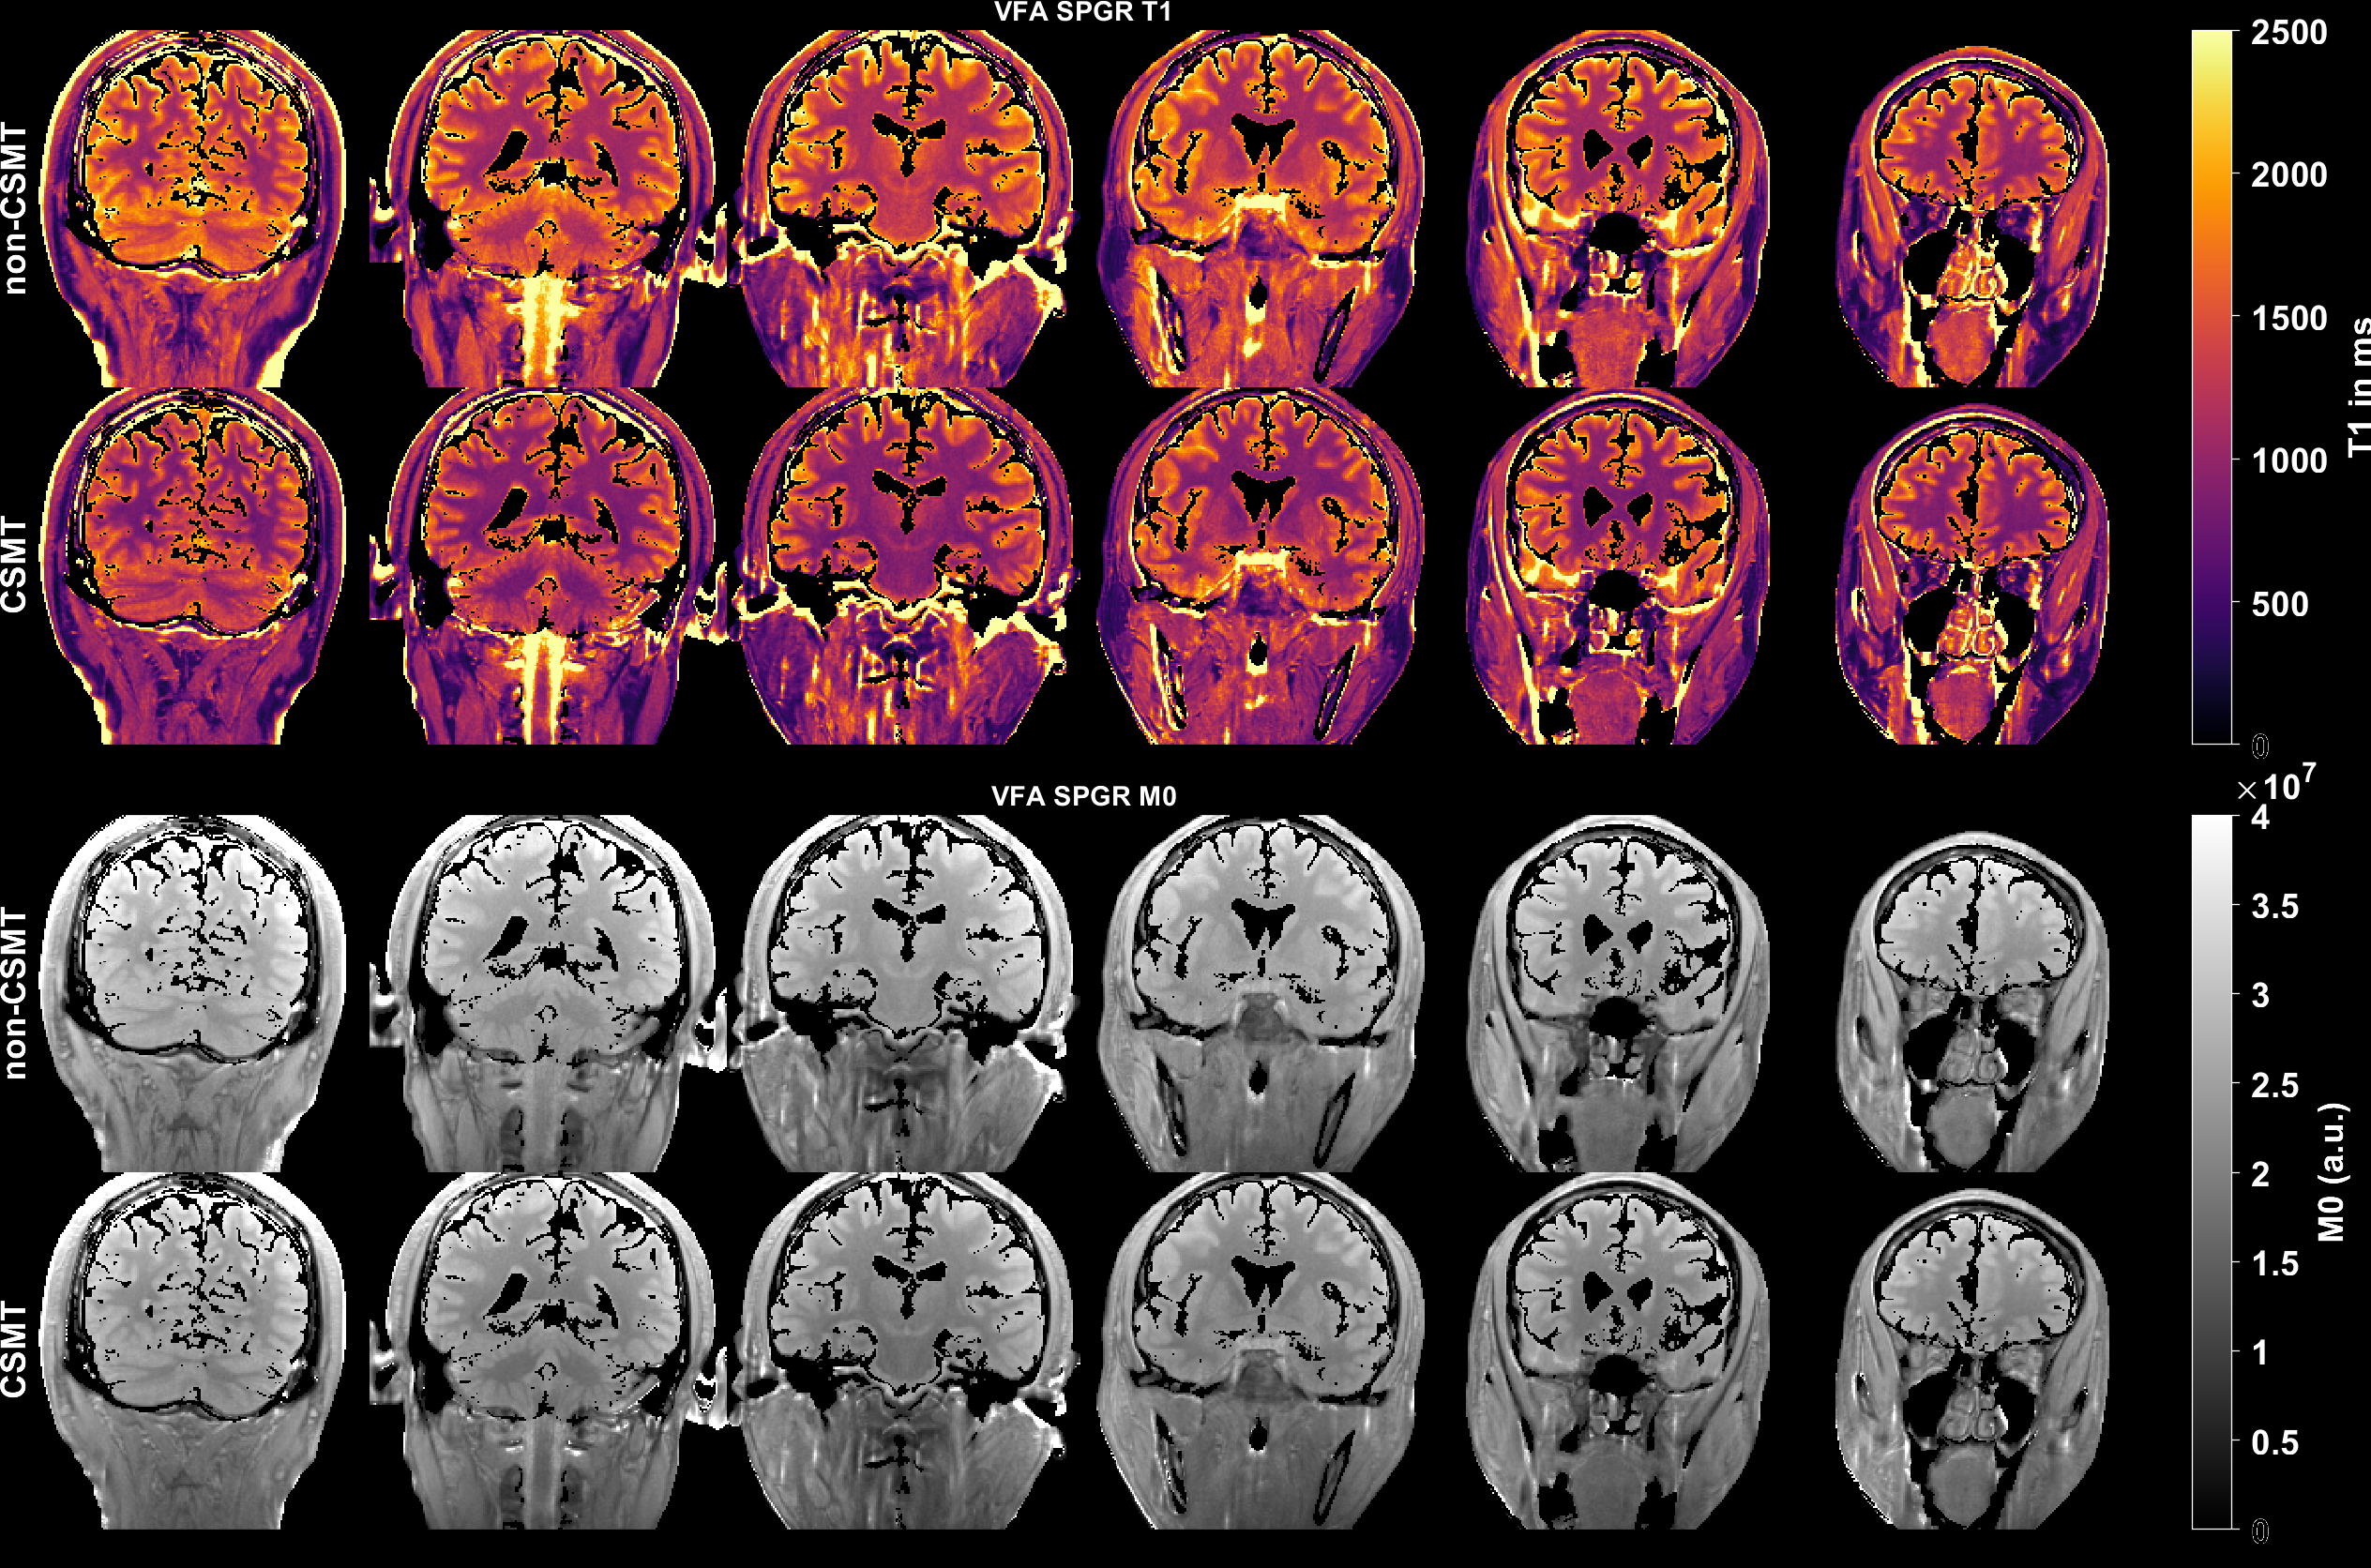
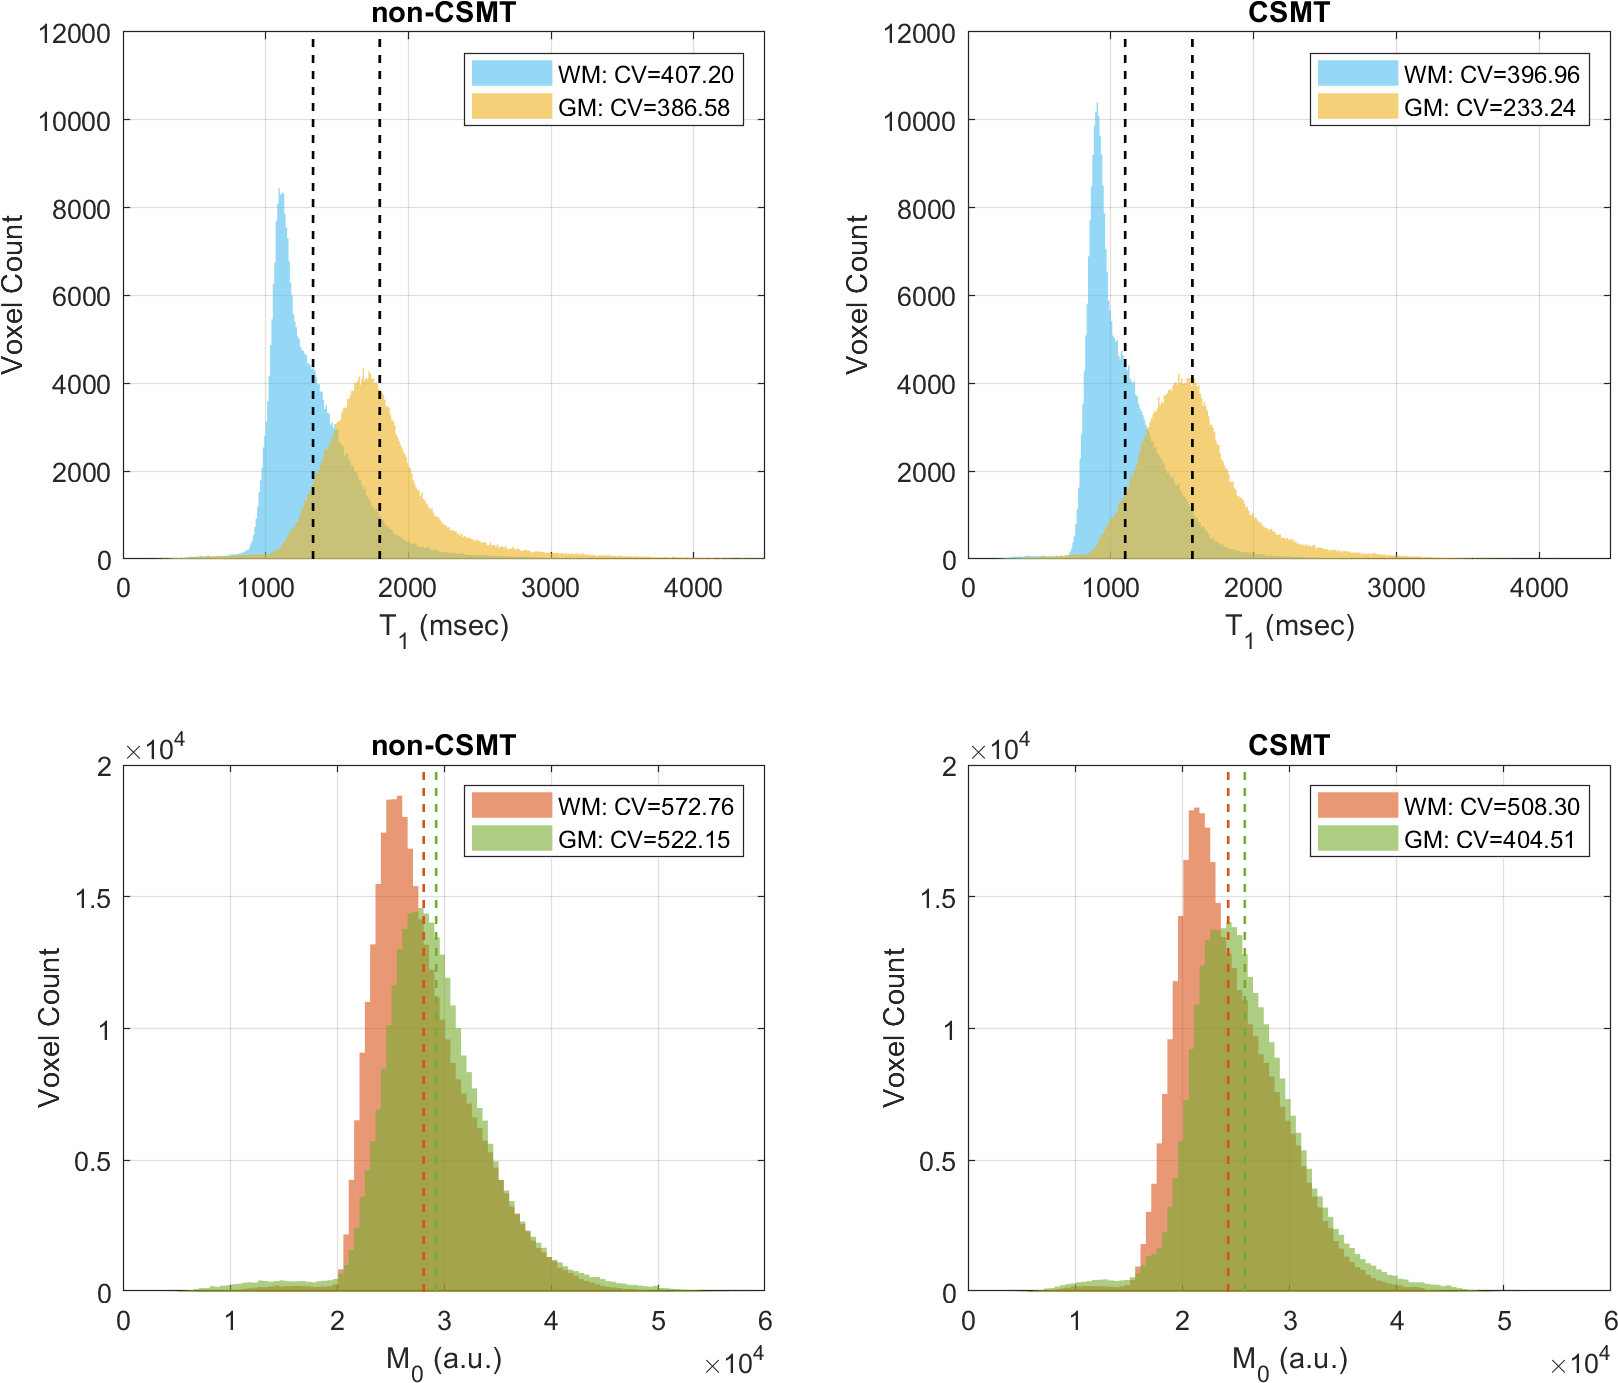
Figure 1 shows the time and frequency representation of multiband minimum-phase SLR pulses. The base excitation pulse is shown in black. The outer bands are centered at ±10 kHz (offset frequency). Figure 2 shows in vivo T1/M0 maps from VFA SPGR images estimated by DESPOT1. Figure 3 shows T1 and M0 histograms from a healthy human VFA dataset. The coefficient of variation (CV) for WM and GM is indicated in legend.Discussion
Histograms support our hypothesis that CV decreases for both T1 and M0 estimates with CSMT pulses compared to non-CSMT pulses. We assume that the absorption lineshape G(\Delta) is flat and constant throughout off-resonant frequencies. This approximation may not be realistic and is likely to break down for shorter excitation pulses with wider bandwidth. This pulse has potential issues with slab selection. In whole-brain with coronal or sagittal prescriptions, we can switch to non-selective. However, this is not true for axial brain, or most other parts of the body. That would require careful study of spatial variation in MT balancing.Conclusion
We have demonstrated improved VFA T1 mapping in the brain using recently developed MT-balancing framework.Acknowledgements
We acknowledge National Institute of Health grant support (#R33-CA225400).References
1. Stikov N, Boudreau M, Levesque IR, Tardif CL, Barral JK, Pike GB. On the accuracy of T1 mapping: searching for common ground. Magn Reson Med 2015;73:514–522.
2. A.G. Teixeira, R. P., Malik, S. J. & Hajnal, J. V. Fast quantitative MRI using controlled saturation magnetization transfer. Magn. Reson. Med. 1–14 (2018). doi:10.1002/mrm.27442
3. Deoni SC, Peters TM, Rutt BK. High-resolution T1 and T2 mapping of the brain in a clinically acceptable time with DESPOT1 and DESPOT2. Magn Reson Med 2005;53:237–241.
4. Sacolick
LI, Wiesinger F, Hancu I, Vogel MW. B1 mapping by Bloch-Siegert shift.Magn Reson
Med. 2010;63:1315–1322.
Figures