3792
Brain T1 relaxometry changes across the life span: a comparison between two populations1Advanced Clinical Imaging Technology, Siemens Healthcare AG, Lausanne, Switzerland, 2Department of Radiology, Lausanne University Hospital and University of Lausanne, Lausanne, Switzerland, 3LTS5, École Polytechnique Fédérale de Lausanne (EPFL), Lausanne, Switzerland, 4School of Psychology, Capital Normal University, Beijing Key Laboratory of Learning and Cognition, Beijing, China, 5Faculty of Medicine, University of Freiburg, Freiburg, Germany, 6MR Collaboration, Siemens Healthcare Ltd., Shanghai, China, 7Department of Radiology, Xuanwu Hospital, Capital Medical University, Beijing, China, 8Beijing Key Laboratory of Magnetic Resonance Imaging and Brain Informatics, Beijing, China
Synopsis
Understanding the normal evolution of T1 values across the life span allows to disentangle ageing from degenerative pathologies. Following previous studies reporting brain anatomical and functional differences between Western and Chinese cohorts, this work investigates whether differences in the evolution of T1 values across the life span exist between these two populations using two datasets with 200 healthy subjects each. Derived trends were found to differ between the two populations in some brain structures, especially in grey matter tissues. The observed differences may indicate that norms derived from one population may not be directly applied to another without recalibration.
Introduction
The sensitivity of T1 measurements to the iron and myelin content in the human brain renders these techniques a valuable tool to study microstructural changes that brain tissues undergo during life1. Establishing normative ranges for T1 across the life span would allow to disentangle normal ageing from pathology and to automatically detect alterations of biophysical tissue properties2–4. Large-scale datasets of healthy subjects are needed to adequately represent the brain properties of a population and are in continuous growth nowadays. However, the question remains whether norms derived from one population can be used across populations. For instance, previous studies have reported both anatomical5 and functional6,7 differences between Western and Chinese cohorts that might be due to genetic and/or environmental factors. On this basis, this work investigates whether differences in the evolution of T1 values across the life span exist between two large cohorts of healthy Western and Chinese subjects.Material and Methods
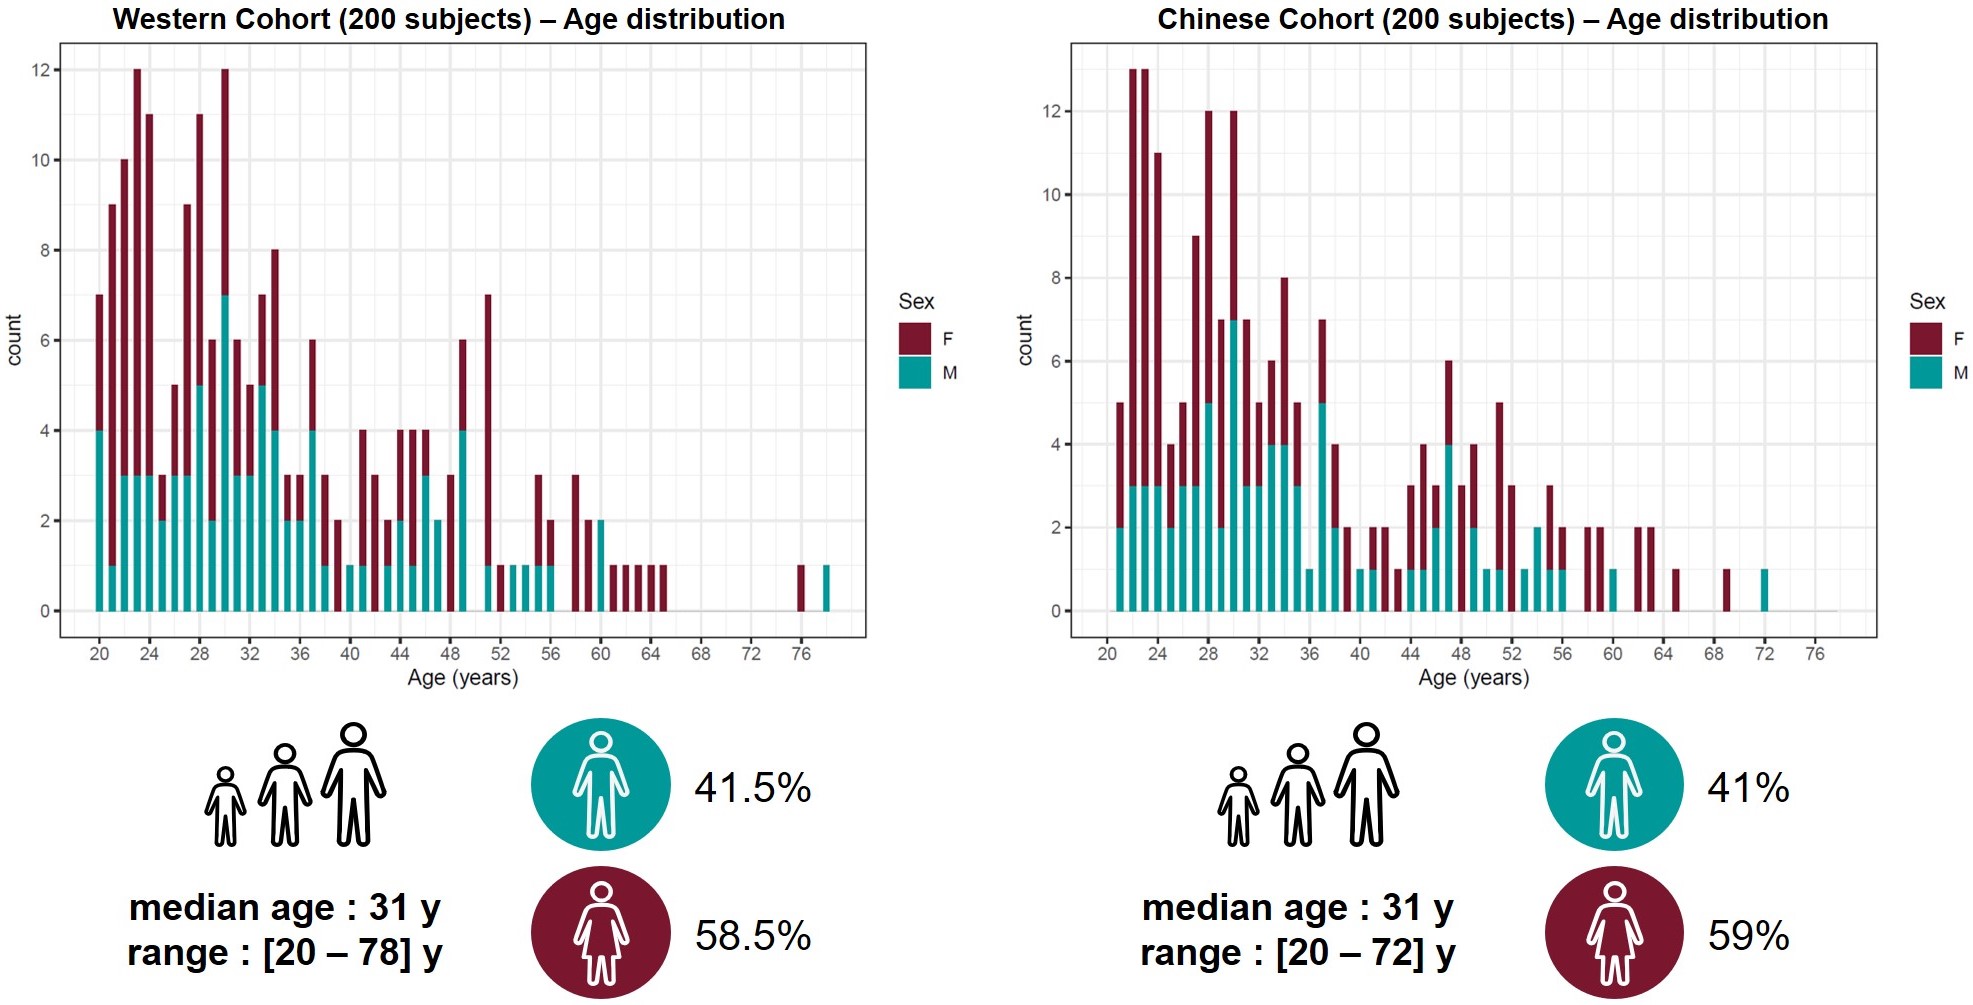
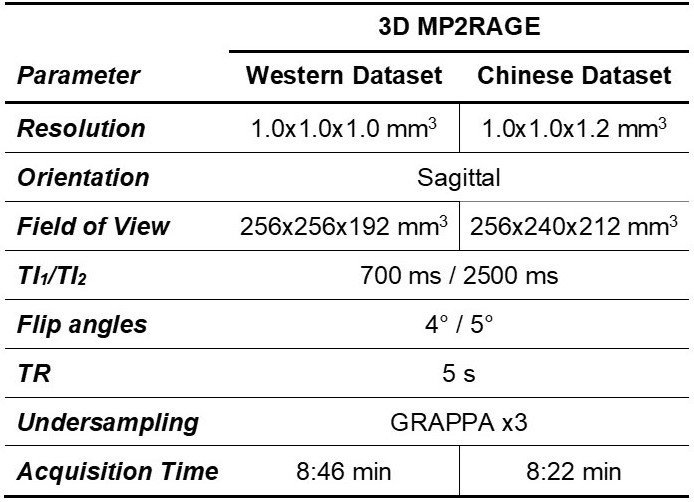
Populations and MR protocol: 200 Western and 200 Chinese healthy subjects were scanned at 3T (MAGNETOM Prisma, Siemens Healthcare, Erlangen, Germany) using a 64-channel head/neck coil. Whole-brain T1 maps were obtained with the prototype MP2RAGE sequence8 (acquisition parameters in Table 1). The Western subjects were previously screened for neurological pathologies. The Chinese subjects were selectively drawn from a larger study9 in order to match age and gender distribution of the Western cohort. All subjects were confirmed to be cognitively healthy based on a battery of cognitive tests. MRI data were visually inspected by a radiologist. Demographics of the two cohorts are summarized in Figure 1.Image processing: To mitigate confounding effects originating from the accuracy of the segmentation, brain regions of interest (ROIs) were obtained from the MP2RAGE T1-weighted volumes using both the MorphoBox10 prototype and FreeSurfer11,12 (v6.0). White matter (WM) and cortical grey matter (GM) labels extracted with FreeSurfer were combined into lobes. Labels corresponding to sub-volumes of the corpus callosum were merged into a single ROI. The label masks were eroded by one layer of voxels to avoid partial-volume effects. Average T1 values were computed in each ROI.
Statistical Analysis: A mixed-effects model (fixed effects: sex, age, age2; random effect: ethnicity) was employed to model the normal changes of regional T1 values over the life span:$$E\left\{T_{1,j}\right\}=(\beta_0+u_{0,j})+\beta_{sex}\ast sex+(\beta_{age}+u_{age,j})\ast age+(\beta_{{age}^2}+u_{{age}^2,j})\ast{age}^2,$$with j=(1, 2) referring to the two populations, $$$\beta$$$ being the coefficients of the fixed effects and $$$u_j$$$ the coefficients of the random effects. A likelihood-ratio test (LRT) was conducted to verify whether the goodness of fit of the mixed-effects model was statistically higher in comparison to the same model without the random effect of ethnicity, i.e. to test whether the T1 evolutions in the Western and Chinese cohort were different. Bonferroni’s correction was applied on the estimated p-values.
Results
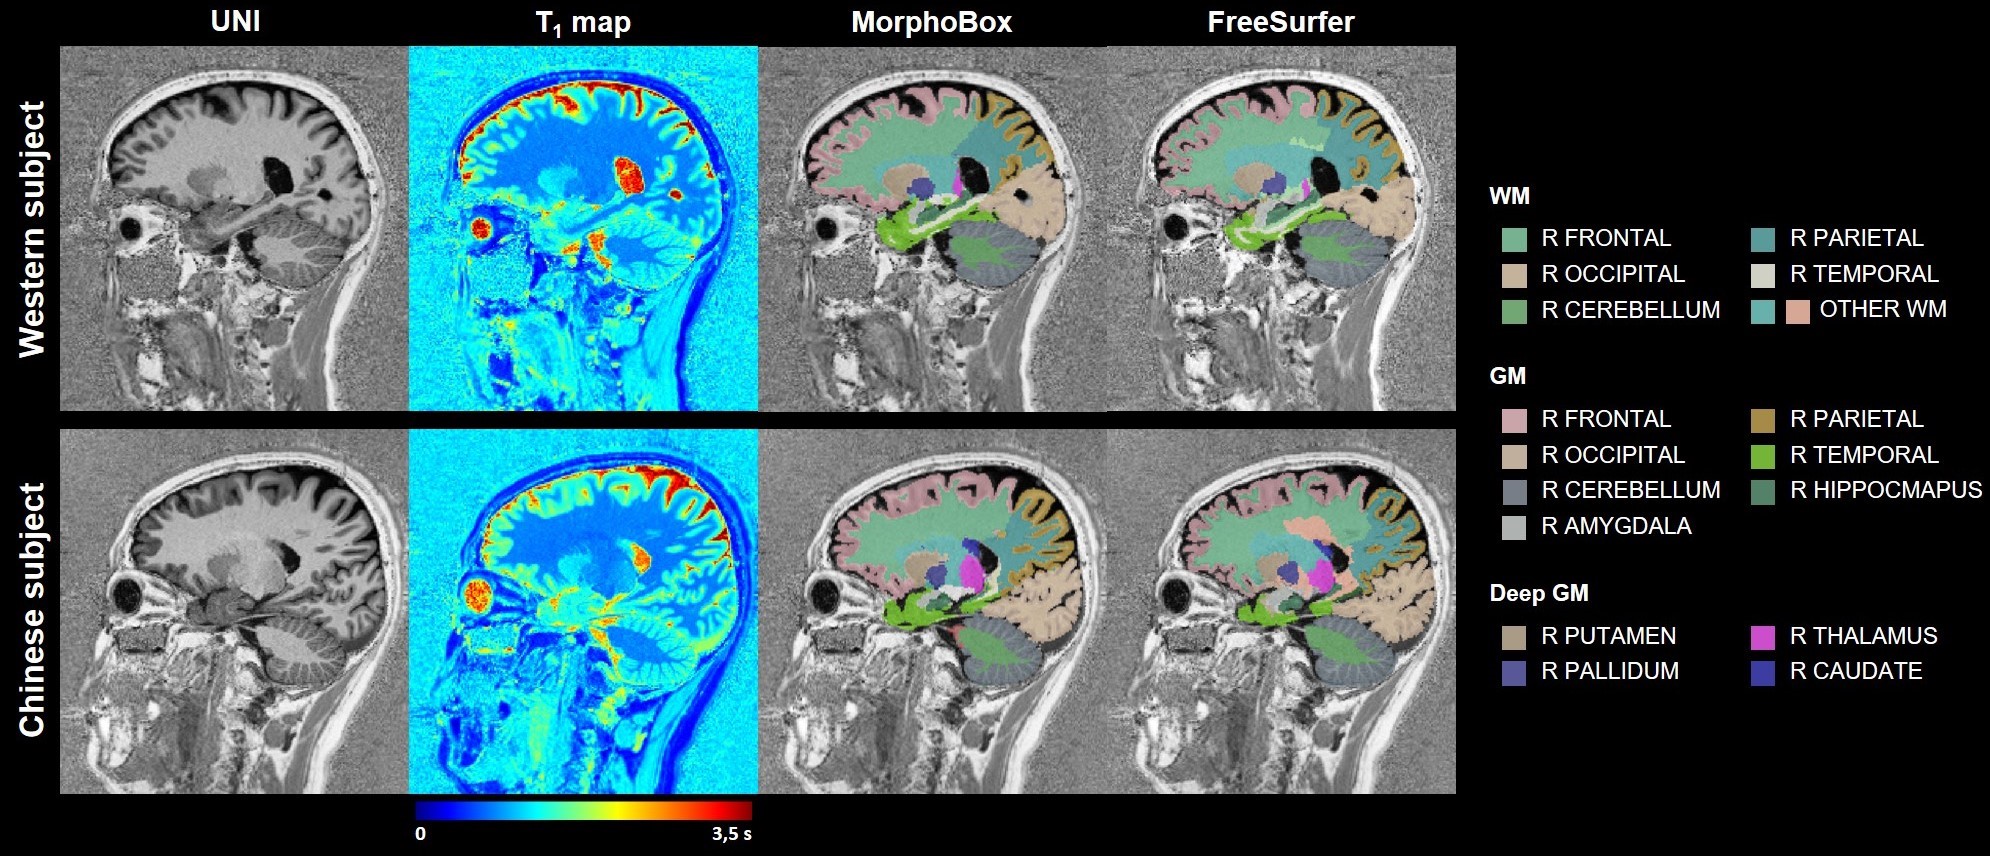
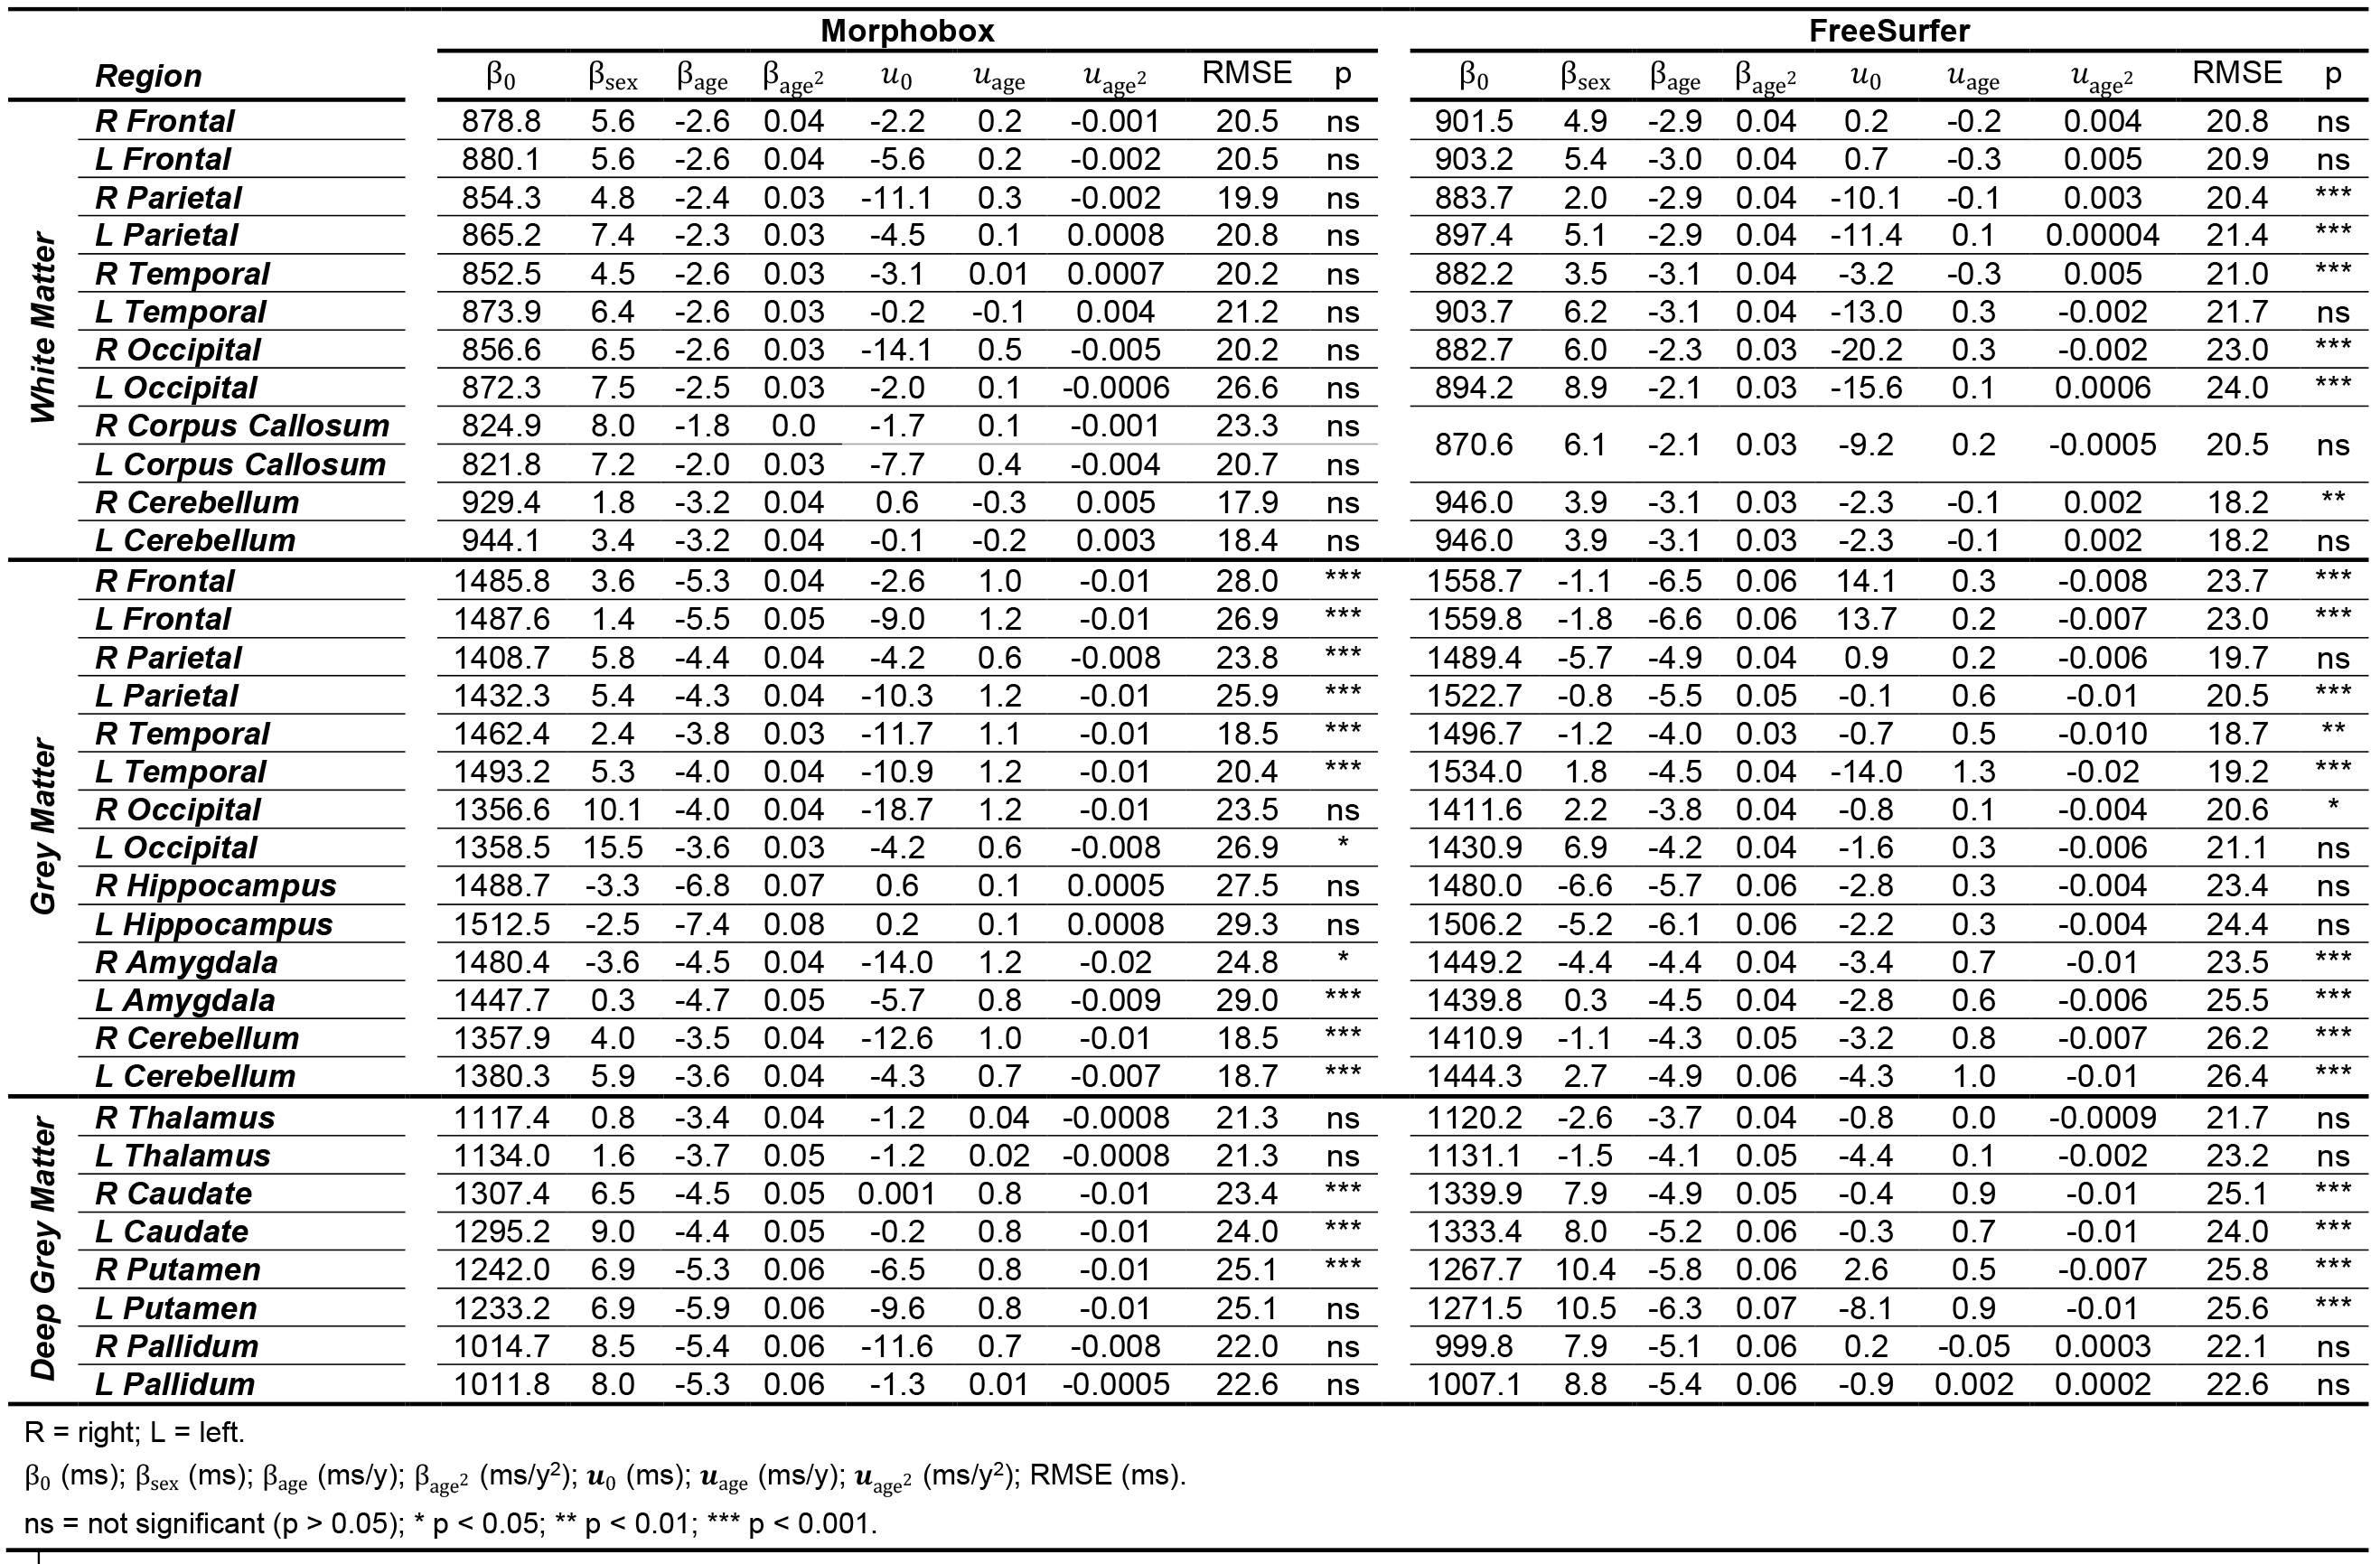
Example T1-weighted images and T1 maps acquired in two age-matched subjects from the two cohorts are shown in Figure 2.The coefficients of the mixed-effects models and the results of the LRT are reported in Table 2. The T1 models in all WM ROIs segmented with MorphoBox were found to be statistically equivalent between populations. Contrarily, values extracted from FreeSurfer labels in the WM of the parietal, occipital, right temporal and left cerebellum lobes were found to evolve differently in the two populations (maximum difference of 23$$$\:$$$ms at the cohort median age in right occipital lobe WM), while others were equivalent. T1 evolutions in most of the cortical GM regions were found to differ between datasets (maximum difference of 33$$$\:$$$ms at the cohort median age in right frontal lobe GM), independent of the segmentation algorithm. Among the deep GM structures, equivalent T1 norms were found in the thalamus and pallidum, but not in the caudate and putamen.
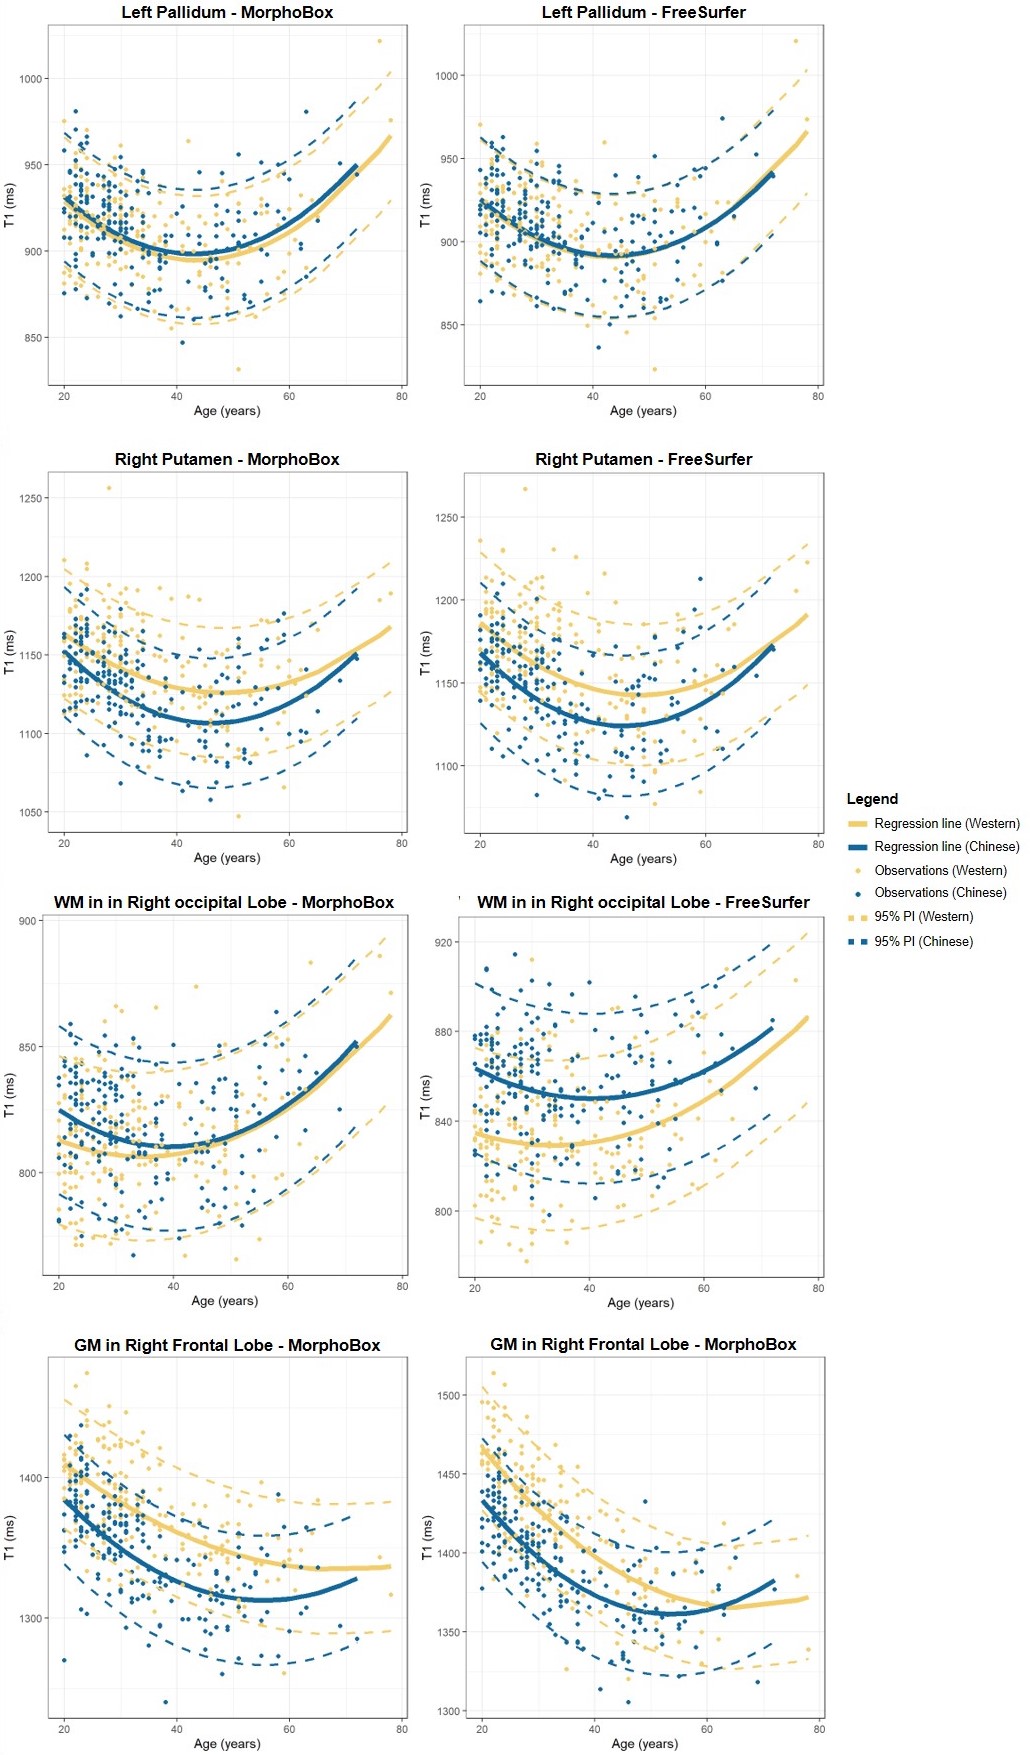
Normative ranges for T1 across the age range in four example brain regions (putamen, pallidum, occipital WM, frontal GM) are reported in Figure 4 for both segmentation tools. T1 evolutions are found to follow the expected U-shape13. In agreement with the previous analysis, the T1 models in the pallidum and the occipital WM appear qualitatively similar (when considering the parcellation of MorphoBox for the latter), while the trend differs in the putamen and frontal GM.
Discussion
Normal T1 ranges over the whole adult age range were modelled and compared in two large-scale Western and Chinese datasets. Differences among regional T1 evolutions were observed in several brain structures. We speculate that these potential differences may originate from genetics and/or environmental influences as shown in previous works investigating anatomical5 and functional6,7 differences. The effect of ethnicity has thus to be considered when using normative relaxometry models across populations. In this regard, the proposed formulation using random effects holds the advantage of incorporating information from the overall regression into the population-specific modelling, improving the modelling of the normative ranges in both cohorts.Although T1 values extracted from the masks obtained with the two segmentation tools allowed to draw similar conclusions, different evolutions were observed in some regions. Hence, consistent image processing should be employed when norms are used to classify abnormal tissues.
Conclusion
In conclusion, the observed differences in T1 evolutions in this study may suggest that a recalibration of normal relaxation ranges is required in order to use models across populations.Acknowledgements
We would like to acknowledge participation in this work from the following hospitals and institutions in China: Beijing Neurosurgical Institute, Beijing Chaoyang Hospital, Beijing Friendship Hospital, Henan Provincial People's Hospital, The First Affiliated Hospital of Zhengzhou University, Longgang District Central Hospital of Shenzhen, Tianjin First Central Hospital, Xiangya Hospital of Central South University, Meizhou People's Hospital, Zhongnan Hospital of Wuhan University, and Center for Brain Imaging Science and Technology of Zhejiang University.References
1. Stüber C, Morawski M, Schäfer A, et al. Myelin and iron concentration in the human brain: A quantitative study of MRI contrast. Neuroimage. 2014;93(P1):95-106.
2. Warntjes JBM, Engström M, Tisell A, Lundberg P. Brain Characterization Using Normalized Quantitative Magnetic Resonance Imaging. PLoS One. 2013;8(8).
3. Bonnier G, Fischi-Gomez E, Roche A, et al. Personalized pathology maps to quantify diffuse and focal brain damage. NeuroImage Clin. 2019;21:101607.
4. Piredda GF, Hilbert T, Granziera C, et al. Quantitative brain relaxation atlases for personalized detection and characterization of brain pathology. Magn Reson Med. 2020;83(1):337-351.
5. Tang Y, Hojatkashani C, Dinov ID, et al. The construction of a Chinese MRI brain atlas: A morphometric comparison study between Chinese and Caucasian cohorts. Neuroimage. 2010;51(1):33-41.
6. Kuo WJ, Yeh TC, Lee CY, et al. Frequency effects of Chinese character processing in the brain: An event-related fMRI study. Neuroimage. 2003;18(3):720-730.
7. Tan LH, Spinks JA, Feng CM, et al. Neural systems of second language reading are shaped by native language. Hum Brain Mapp. 2003;18(3):158-166.
8. Marques JP, Kober T, Krueger G, van der Zwaag W, Van de Moortele P-F, Gruetter R. MP2RAGE, a self bias-field corrected sequence for improved segmentation and T1-mapping at high field. Neuroimage. 2010;49(2):1271-1281
9. Piredda GF, Liang P, Hilbert T, et al. Large-scale quantitative atlases over the whole adult age range. Submitted in parallel to the Annual Meeting of ISMRM 2020.
10. Schmitter D, Roche A, Maréchal B, et al. An evaluation of volume-based morphometry for prediction of mild cognitive impairment and Alzheimer’s disease. NeuroImage Clin. 2015;7:7-17.
11. Fischl B. FreeSurfer. Neuroimage. 2012;62(2):774-781.
12. Fujimoto K, Polimeni JR, van der Kouwe AJW, et al. Quantitative comparison of cortical surface reconstructions from MP2RAGE and multi-echo MPRAGE data at 3 and 7T. Neuroimage. 2014;90:60-73.
13. Slater DA, Melie‐Garcia L, Preisig M, Kherif F, Lutti A, Draganski B. Evolution of white matter tract microstructure across the life span. Hum Brain Mapp. 2019;40(7):2252-2268.
Figures