3791
Thinking outside the black box: A fully transparent T1 mapping pipeline1NeuroPoly Lab, Institute of Biomedical Engineering, Polytechnique Montreal, Montreal, QC, Canada, 2Montreal Heart Institute, Montreal, QC, Canada, 3Unité de Neuroimagerie Fonctionnelle (UNF), Centre de recherche de l’Institut Universitaire de Gériatrie de Montréal (CRIUGM), Montreal, QC, Canada
Synopsis
Quantitative MRI is pointless if we cannot peak inside the black box that generates the numbers. This is the main motivation behind our concept for a fully transparent qMRI pipelines starting at the scanner console and extending all the way to a journal publication. In this work, we developed a simple application to demonstrate this for variable flip angle (VFA) T1 mapping. This application exemplifies the feasibility of a vendor-neutral qMRI sequence that is publicly shared under version control (https://github.com/qMRLab/pulse_sequences). Our approach opens a way towards community-driven development and improvement of qMRI applications without the need for specialized programming skills.
INTRODUCTION
Variable flip angle (VFA, a.k.a. DESPOT1)1 is one of the simplest, fastest and most popular T1 mapping routines. Recently, a study brought to light multi-site variations in VFA T1 maps caused by differences in vendor implementations and scanner software upgrades2. Even though accounting for effects such as magnetization transfer effects can minimize variability3, efforts along these lines require access to multiple vendor-specific software development kits (SDK), making this approach difficult to adopt and generalize across sites. Although there is a vendor-agnostic open SDK alternative for rapid sequence prototyping4, it is not readily integrated with a vendor-agnostic acquisition pipeline that has full control over the acquisition and reconstruction.Recently, we proposed fully transparent qMRI pipelines starting at the scanner console and extending all the way to journal publication5. For this work, we integrated qMRLab6 (https://qmrlab.org) with RTHawk7, an intuitive full-stack SDK for creating vendor-neutral custom MRI applications. We developed a simple VFA T1 application to demonstrate the feasibility and ease of development of a vendor-neutral qMRI application. We publicly shared a version-controlled pipeline, from the acquisition (https://github.com/qMRLab/pulse_sequences) to the final results of the analysis, executable online (http://bit.ly/qmr_vfat1).
METHODS
A 3D spoiled gradient recalled echo (SPGR) sequence that repeats over two predefined flip angles was developed using RTHawk SDK (v2.5.1., HeartVista Inc.) to create the acquisition component of the VFA T1 pipeline (Figure 1). Gradient and RF waveforms were generated and simulated for the acquisition using SpinBench8 (Figure 2), a freely available graphical environment for pulse sequence design and simulation (https://www.heartvista.ai/spinbench). After being tested using RTHawk’s simulation mode (to ensure proper functionality), the application was transferred to a powerful workstation connected to a 3T Skyra scanner (VE11C, Siemens Healthineers) via ethernet splitter for the actual scan.A NIST/ISMRM system phantom9 was placed inside the scanner for 1 hour prior to installing a 18-channel surface coil for imaging. Following the localization of the T1 plate of the phantom in the coronal plane, data collection for VFA T1 mapping was carried out using both the custom developed RTHawk sequence (Figure 2) and its commercial equivalent (3D FLASH) at 1x1x5mm3 resolution with TR/TE=25/4.5ms, FA of 3° and 20° and no parallel acceleration. Quadratic phase increment of 117° was applied for RF spoiling in the RTHawk acquisition. Both datasets were then converted to the BIDS format10,11 and processed using qMRLab (v2.3.0, using Octave 4.2.0) running in a Docker container. All configuration files needed to reproduce this container environment along with the source codes are publicly available at https://bit.ly/33k9eN3 and can be executed online on BinderHub to generate interactive figures (http://bit.ly/qmr_vfat1).
RESULTS
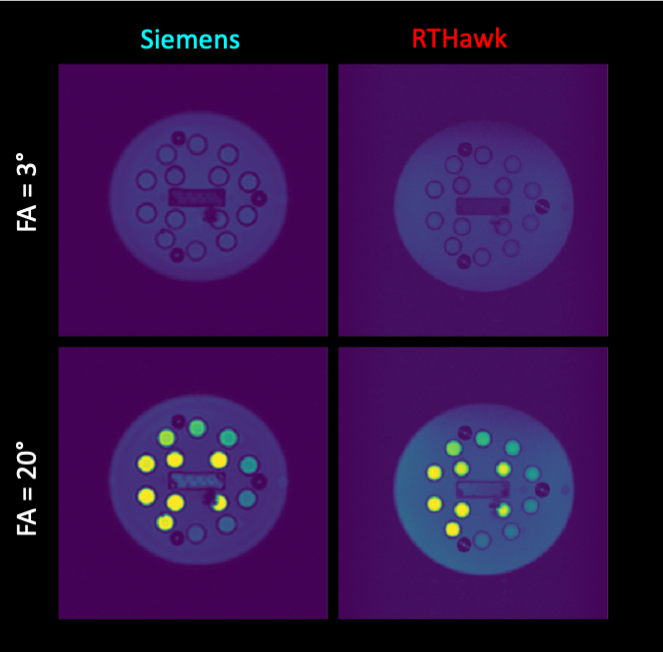
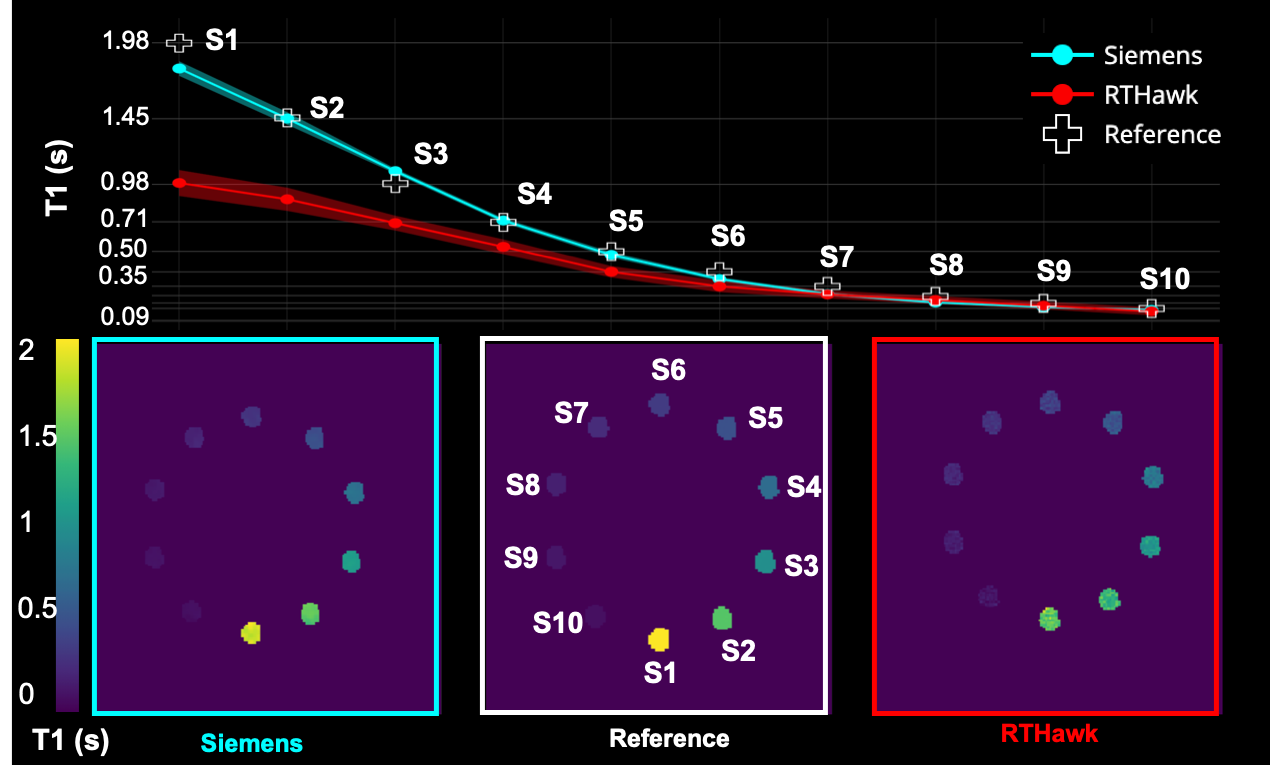
Despite being in its early stages of development (a.k.a. the day before the deadline), custom RTHawk 3D-SPGR sequence yielded images comparable to those from the 3D-FLASH acquisition (Figure 3). Thanks to the BIDS10 data structure, the fitting was initiated by a single line of code with detailed provenance recording for the derived maps. While T1 values below 350 ms were accurately estimated the custom VFA T1 RTHawk application underestimates higher T1 values in its current version (v1.0) (Figure 4).DISCUSSION
Unlike traditional pulse sequence development, which requires access to a vendor-specific proprietary SDE, our pipeline is open-source and vendor-neutral. The VFA sequence was implemented on RTHawk by a researcher with no prior pulse sequence experience, and the quantitative image processing was performed using a collaborative open-source toolbox.Improper spoiling and flip angle inaccuracies could account for the underestimation of high T1 values. A major benefit of our proposed transparent pipeline is that this can be debugged collaboratively on our publicly hosted open pulse sequence repository. For example, an experienced sequence developer can suggest alternative design choices by running simulations on SpinBench and can suggest fixes through a pull-request. Such open development practices have revolutionized a number of fields, and quantitative MRI has a lot to gain by adopting this approach.
CONCLUSION
While closed solutions may be appropriate for qualitative MRI (shades of grey lack standardized units), quantitative MRI is pointless if we cannot peak inside the black box that generates the numbers. With this proof of concept study, we illustrate how open-source development ecosystems powered by qMRLab workflows5 can facilitate the standardization of qMRI at multiple levels. Our open-source solution is currently compatible with two major vendors (GE and Siemens), and we hope that this concept will encourage researchers to collaborate on vendor-neutral sequences to level the field for MR quantification. We've been sitting in our MR cathedrals long enough. It is now time to join the MR bazaar12.Acknowledgements
References
[1] Fram, E., et al. "Rapid calculation of T1 using variable flip angle gradient refocused imaging." Mag. Res. Imag. 5 (1987): 201-208.
[2] Lee, Y., et al. "Establishing intra‐and inter‐vendor reproducibility of T1 relaxation time measurements with 3T MRI." Magn. Reson. Med. 81 (2019): 454-465.
[3] Teixeira, A., et al., “Fast quantitative MRI using controlled saturation magnetization transfer.” Magn. Reson. Med. 81 (2019): 907-920.
[4] Layton, K., et al., "Pulseq: a rapid and hardware‐independent pulse sequence prototyping framework." Mag. Reson. Med. 77 (2017): 1544-1552.
[5] Karakuzu A., et al., "The qMRLab workflow: From acquisition to publication.", Proceedings of ISMRM 27th annual meeting, Montreal, QC, Canada, (2019).
[6] Duval, T., et al., “Quantitative MRI made easy with qMRLab.” Proceedings of ISMRM 26th annual meeting, Paris, France, (2018).
[7] Santos, J., et al., "Flexible real-time magnetic resonance imaging framework." The 26th Annual International Conference of the IEEE Engineering in Medicine and Biology Society. Vol. 1. IEEE, (2004).
[8] Overall, W., Pauly, J.. "An extensible, graphical environment for pulse sequence design and simulation." Proceedings of ISMRM 16th annual meeting, Berlin, Germany, (2007).
[9] Keenan, K., et al., “Quantitative magnetic resonance imaging phantoms: A review and the need for a system phantom.” Magn. Reson. Med. 78 (2018): 48-61.
[10] Gorgolewski, K., et al. "The brain imaging data structure, a format for organizing and describing outputs of neuroimaging experiments." Scientific Data 3 (2016): 160044.
[11] https://github.com/bids-standard/bep001, commit d07489f (Accessed: November 6 2019).
[12] Raymond, E., “The cathedral and the bazaar.” First Monday, 3(3) (1998). (Accessed: 6 November 2019)
Figures