3790
Acceleration of 3D high-resolution variable-flip-angle T1 mapping based on SUPER1College of Life Science and Technology, Huazhong University of Science and Technology, Wuhan, China, 2United Imaging Healthcare Co., Ltd, Shanghai, China, 3Department of Cardiology, Renji Hospital, School of Medicine, Shanghai Jiao Tong University, Shanghai, China, 4Institute of Medical Imaging Technology, School of Biomedical Engineering, Shanghai Jiao Tong University, Shanghai, China
Synopsis
Three-dimensional variable-flip-angle(VFA) T1-mapping is a rapid T1 quantification method with important clinical applications. However, the requirement of acquiring multiple 3D images greatly increases the scan time. We propose a novel application of SUPER—a recently developed framework for parametric mapping acceleration—to reduce scan time and/or improve spatial resolution of 3D VFA T1-mapping. In healthy subjects, we demonstrate that SUPER(R=2) and SUPER-SENSE(R=4 combining SUPER and parallel imaging) achieved similar accuracy, reasonable noise amplification, and similar reconstruction time compared with the non-acceleration gold standard. The whole upper-brain T1-mapping scan time was reduced from 5.33 minutes to 1.33 by employment of SUPER-SENSE.
Introduction
Variable-flip-angle (VFA) T1 mapping is a rapid T1 quantification method1,2 used in a variety of clinical and preclinical applications, including diagnosis of multiple sclerosis3, neurodegenerative disorders4, liver fibrosis5,6, and cancer7,8. Acceleration of VFA T1 mapping is of great importance for improving resolution and reducing scan time. SUPER9 (Shift Undersampling improves Parametric mapping Efficiency and Resolution) is a novel parametric mapping acceleration method that uses interleaved Cartesian undersampling, which leads to fast reconstruction and robustness against hardware imperfection. SUPER has been validated in Look-Locker T1 mapping9 and T2 mapping10, for brain and cardiac imaging applications. Here we validate for the first time the application of SUPER to acceleration of VFA T1 mapping.Methods
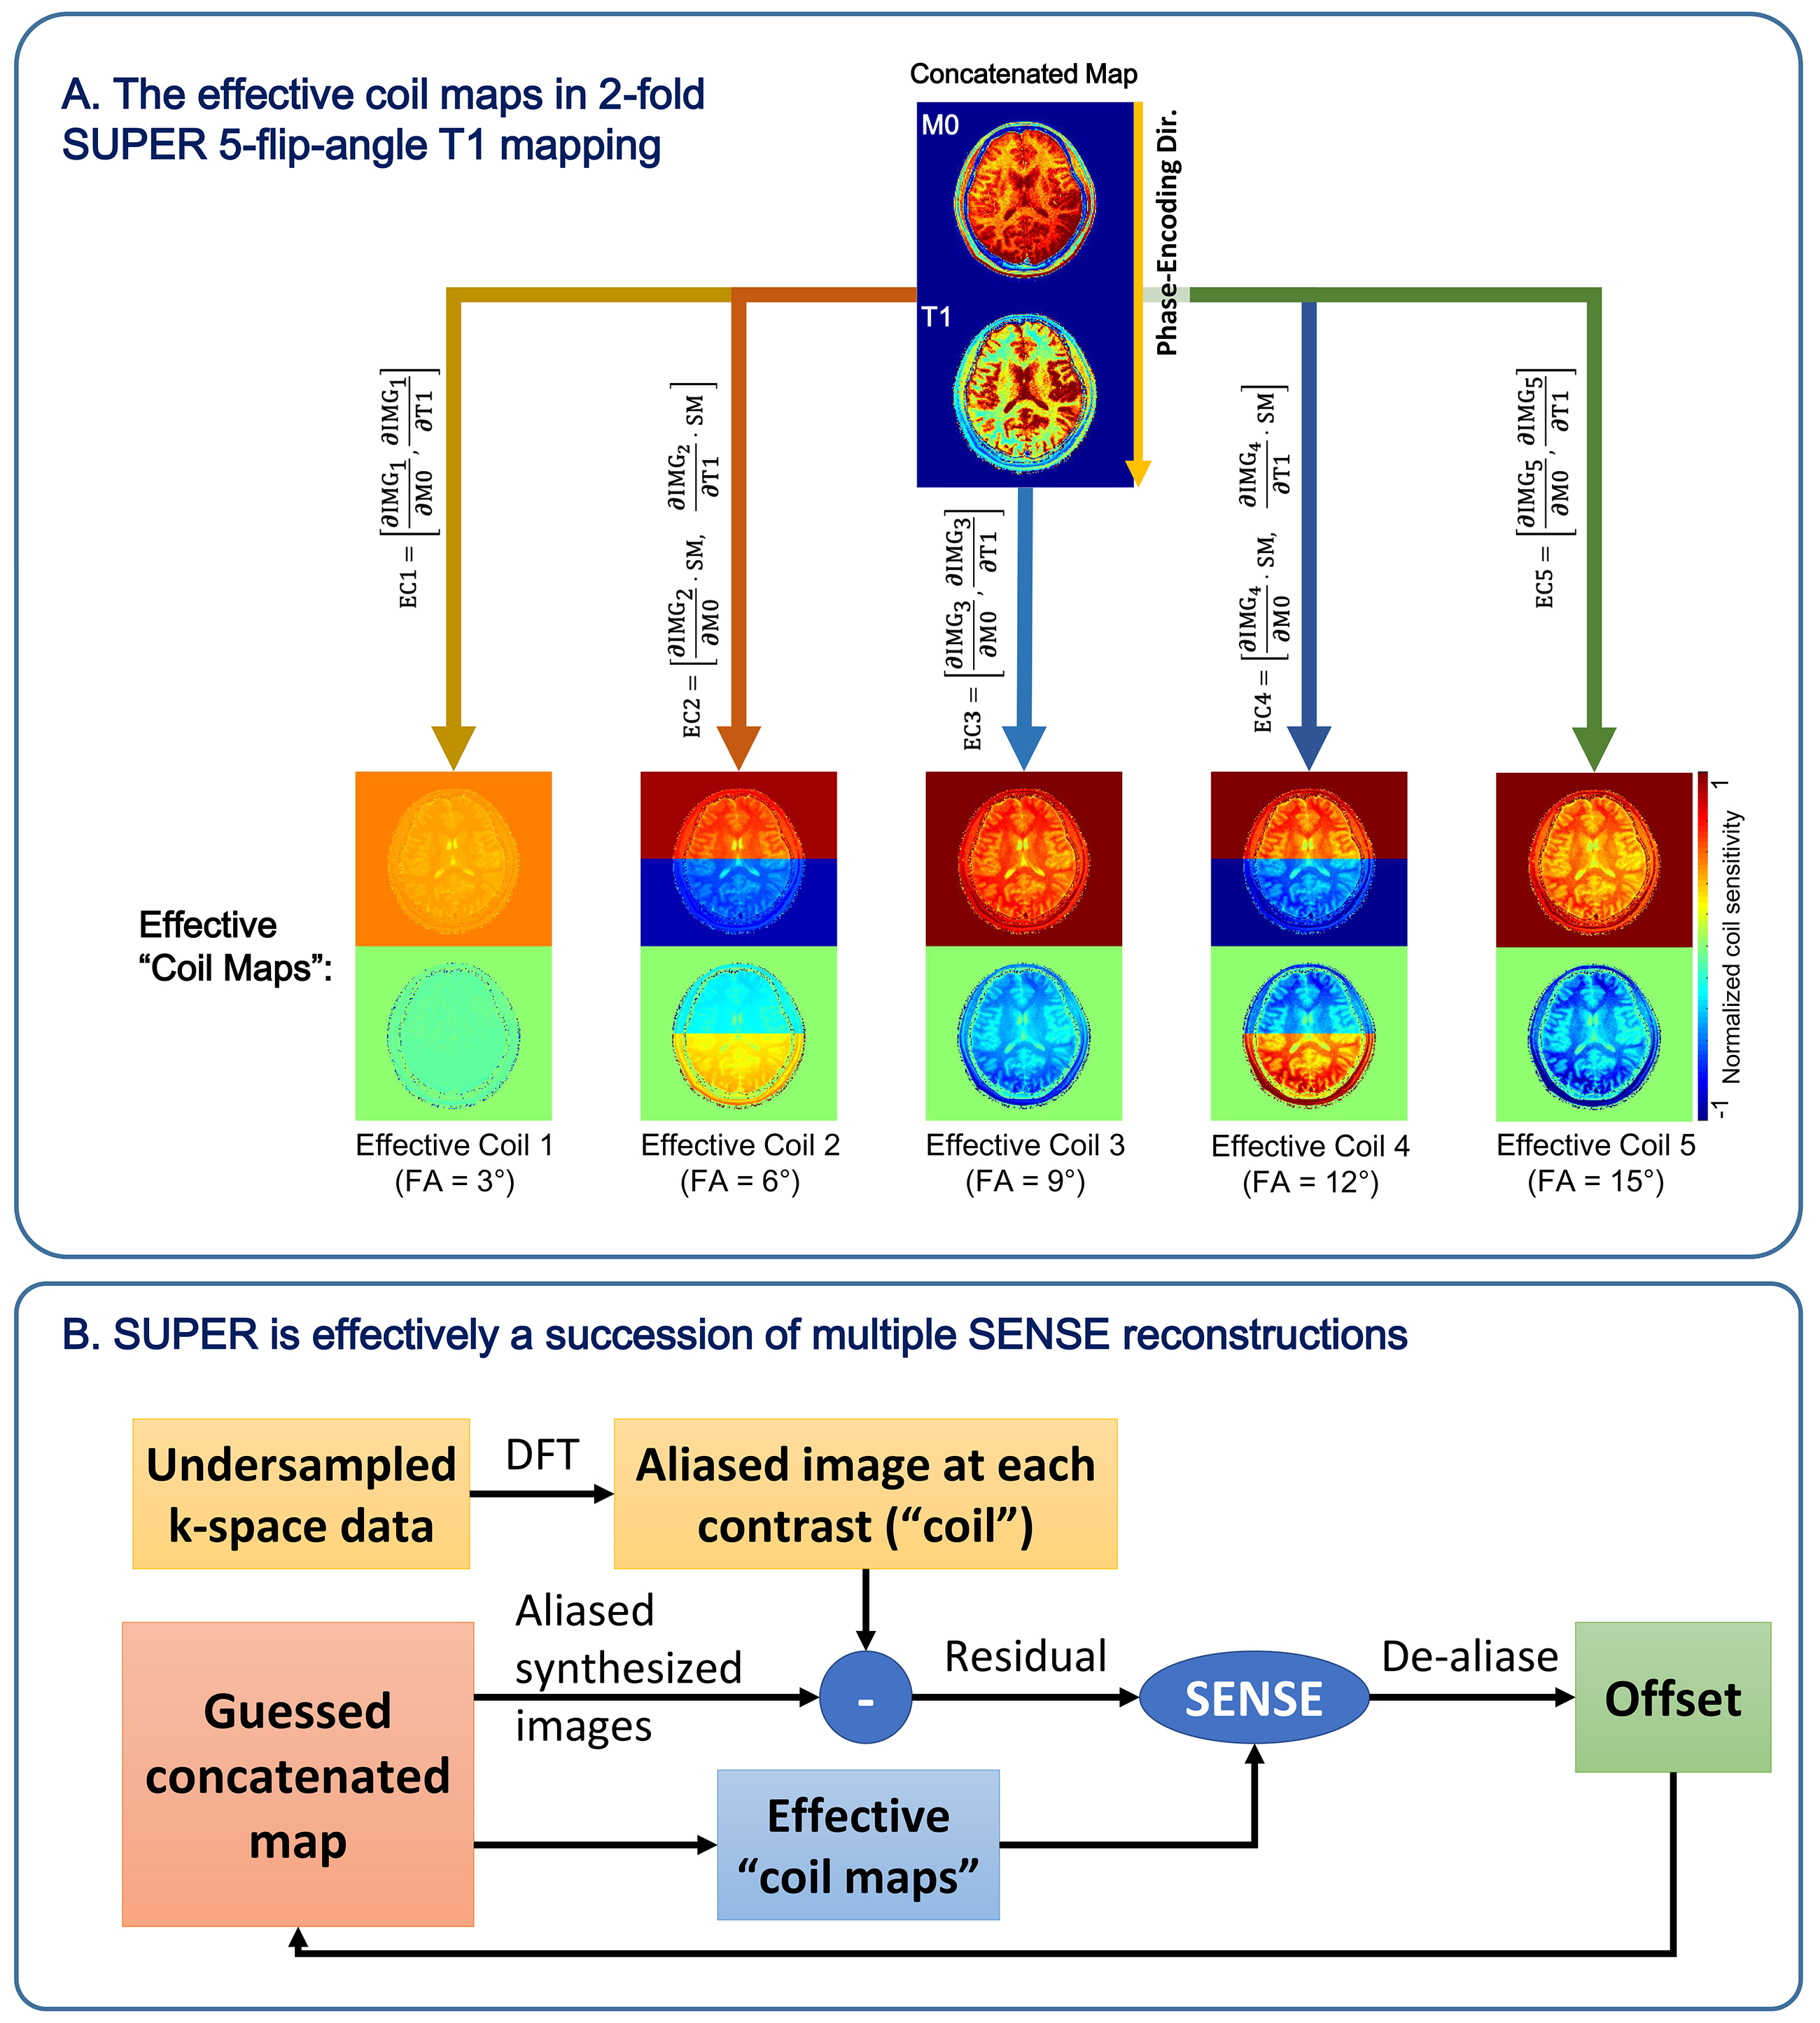
A detailed description of SUPER can be found in Reference [9]. In principle, SUPER treats each contrast-weighted image in a parametric mapping task as a separate “coil”, and leverages the methodology of parallel imaging to accelerate parametric mapping. A 2-fold SUPER for VFA T1 mapping, illustrated in Figure 1 for example, is equivalent to reconstructing a concatenated M0 and T1 map (the “image”) from an effective 4-fold aliasing in the concatenated space, using multiple T1-weighted images (the different “coils”). Of the 4-fold aliasing, 2-fold is from voxels half-FOV apart in each map, for which de-aliasing is mainly contributed by the spatial modulation created by the interleaved undersampling pattern at each contrast9. The other 2-fold aliasing is between M0 and T1 in the same voxel, for which de-aliasing is facilitated by the different partial derivatives of the signal with respect to each parameter. The reconstruction of SUPER is essentially a succession of multiple Cartesian SENSE11 reconstructions, each with a linearized effective “coil maps” derived from the current guess of the concatenated map. For implementation, we used Levenberg-Marquardt to avoid explicit matrix inverse to further improve the computational efficiency.Six healthy subjects (age 26±4, 3 male) were scanned in a 3T scanner (uMR790, Shanghai United Imaging Healthcare, Shanghai, China) after providing written informed consent, with a 3D FLASH sequence using a 24-channel (17 used in acquisition) head coil. The imaging volume was axially placed in the upper brain, with FOV 300×300×48mm3, and image size 256×256×12. Five flip angles including 3º, 6º, 9º, 12º, and 15ºwere acquired. Fat saturation was performed with SPIR and another time with SPAIR. Other parameters of the sequence were: slice-thickness/slice oversampling/TR/TE/bandwidth/scan time = 4mm/10%/4.7ms/2.2ms/400Hz/pixel/22seconds. One subject was repeatedly scanned with 48 slices and 3mm slice-thickness covering the whole upper brain. k-Space was retrospectively undersampled for T1 mapping based on non-acceleration (R=1), SENSE (R=2), SUPER (R=2), and SUPER-SENSE (combined SUPER and parallel imaging, R=4). Bias and precision of the reconstructed parametric maps were compared between all acceleration methods. Non-accelerated reconstruction was considered the gold standard for image quality assurance.
Results
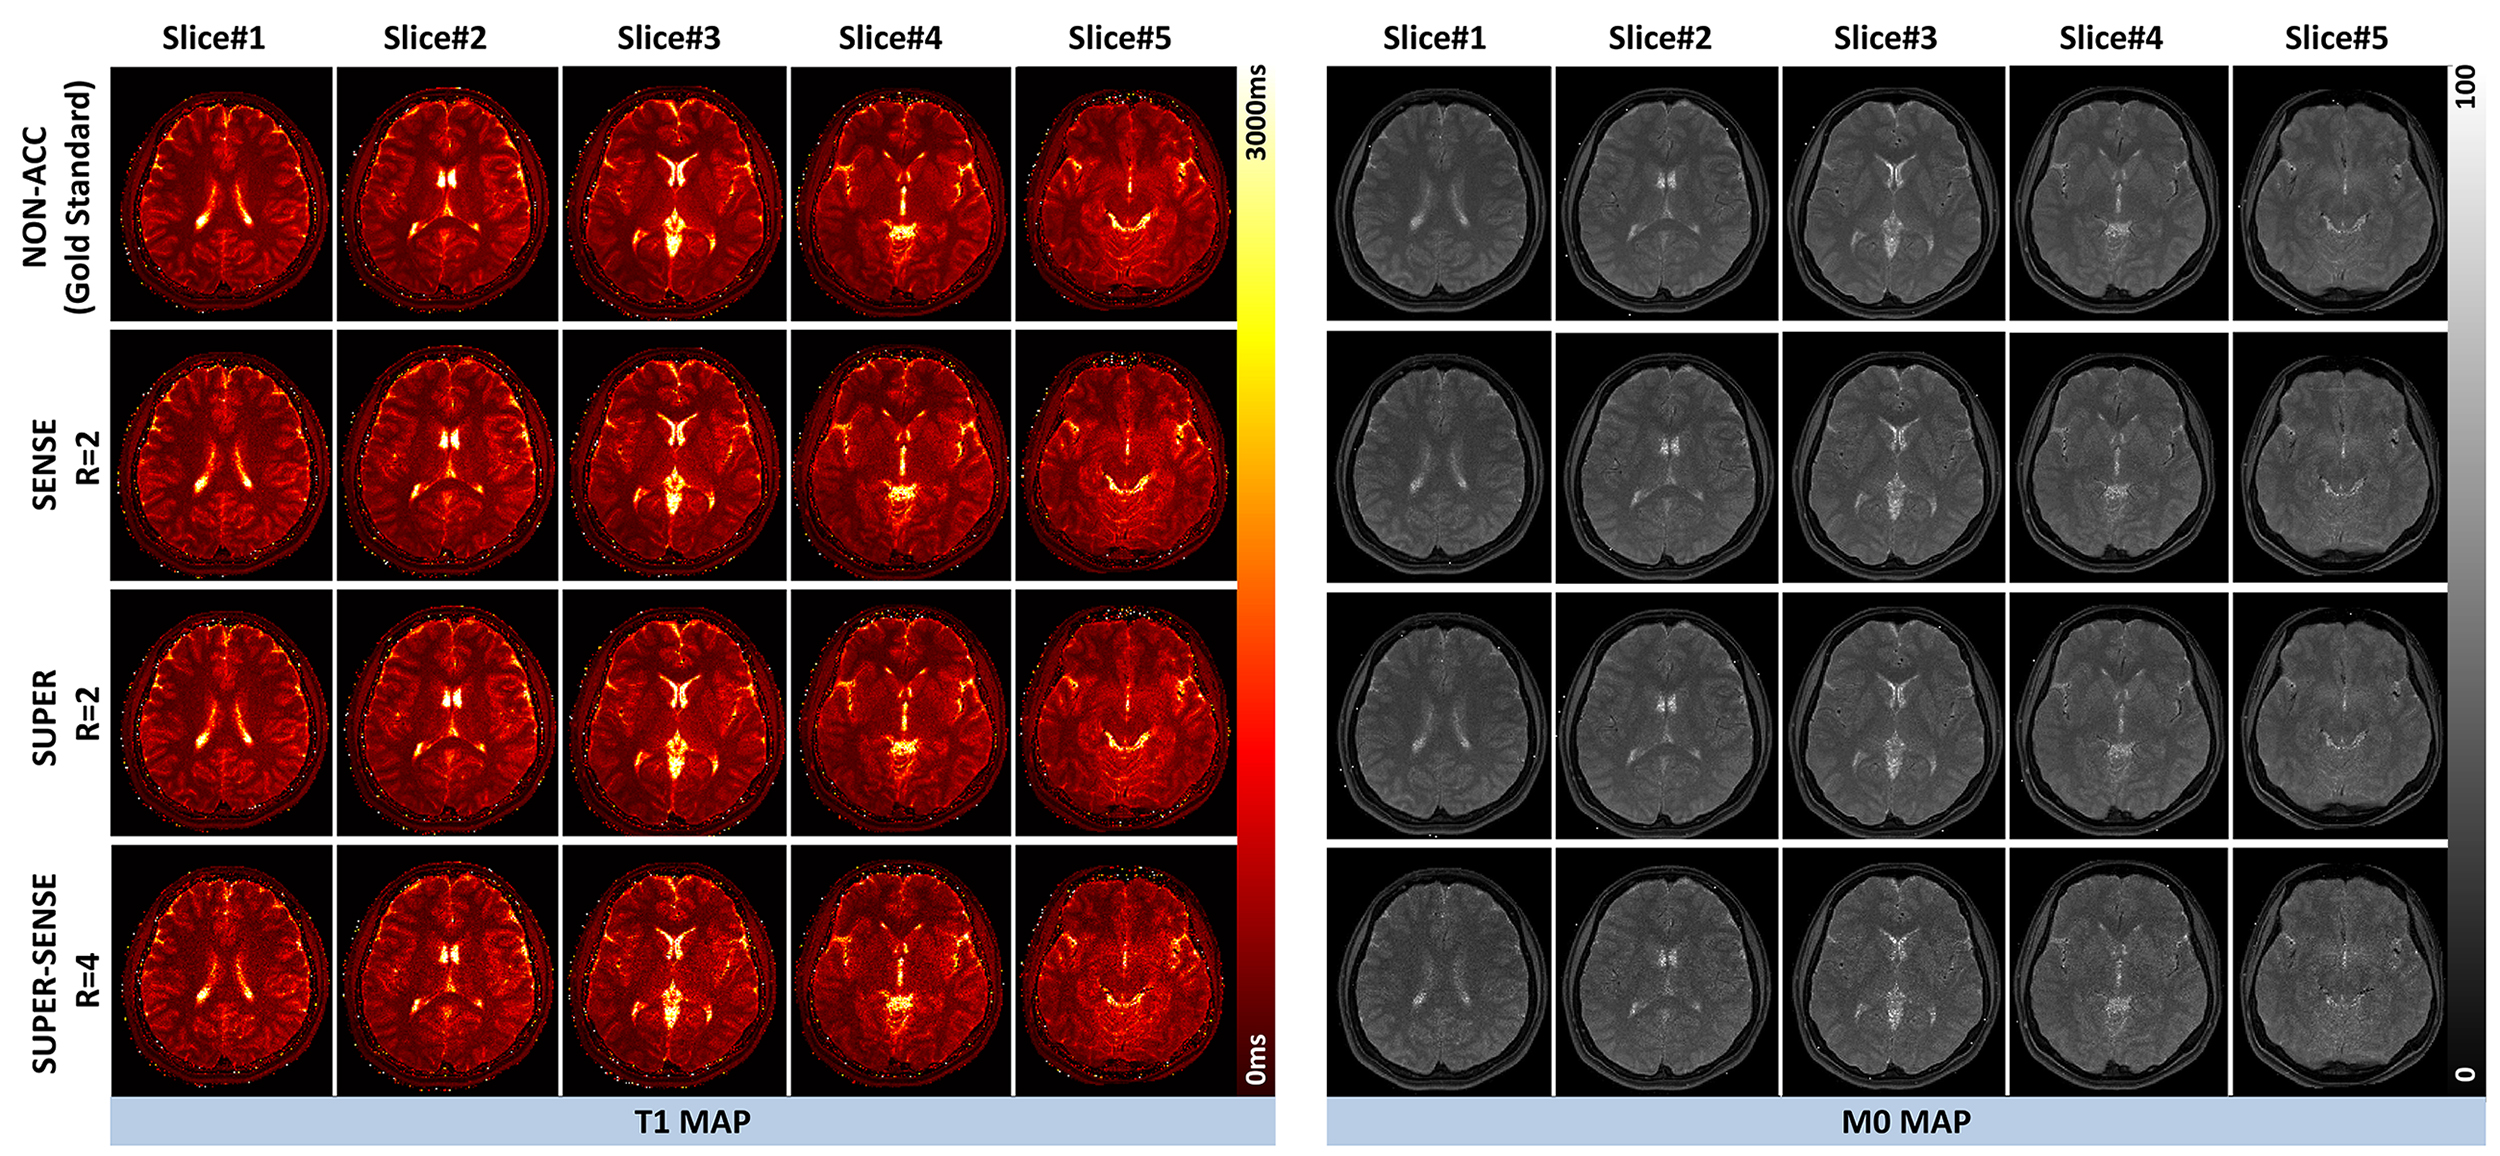
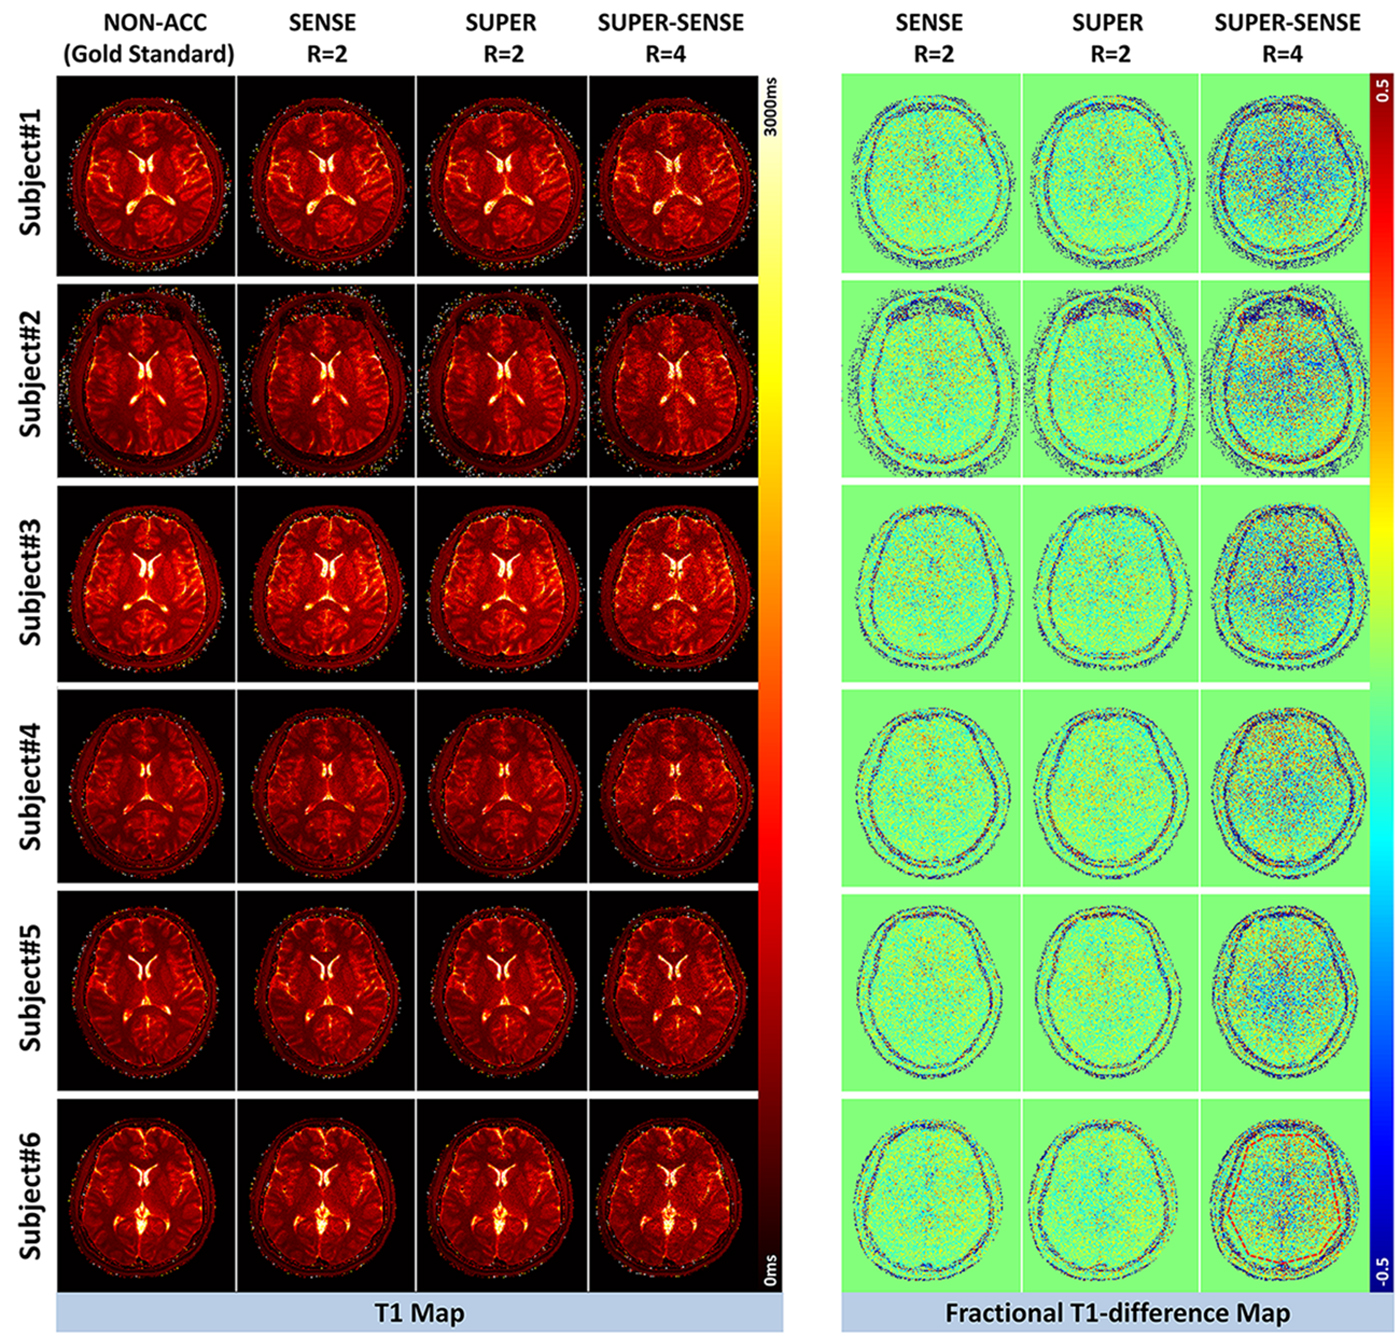
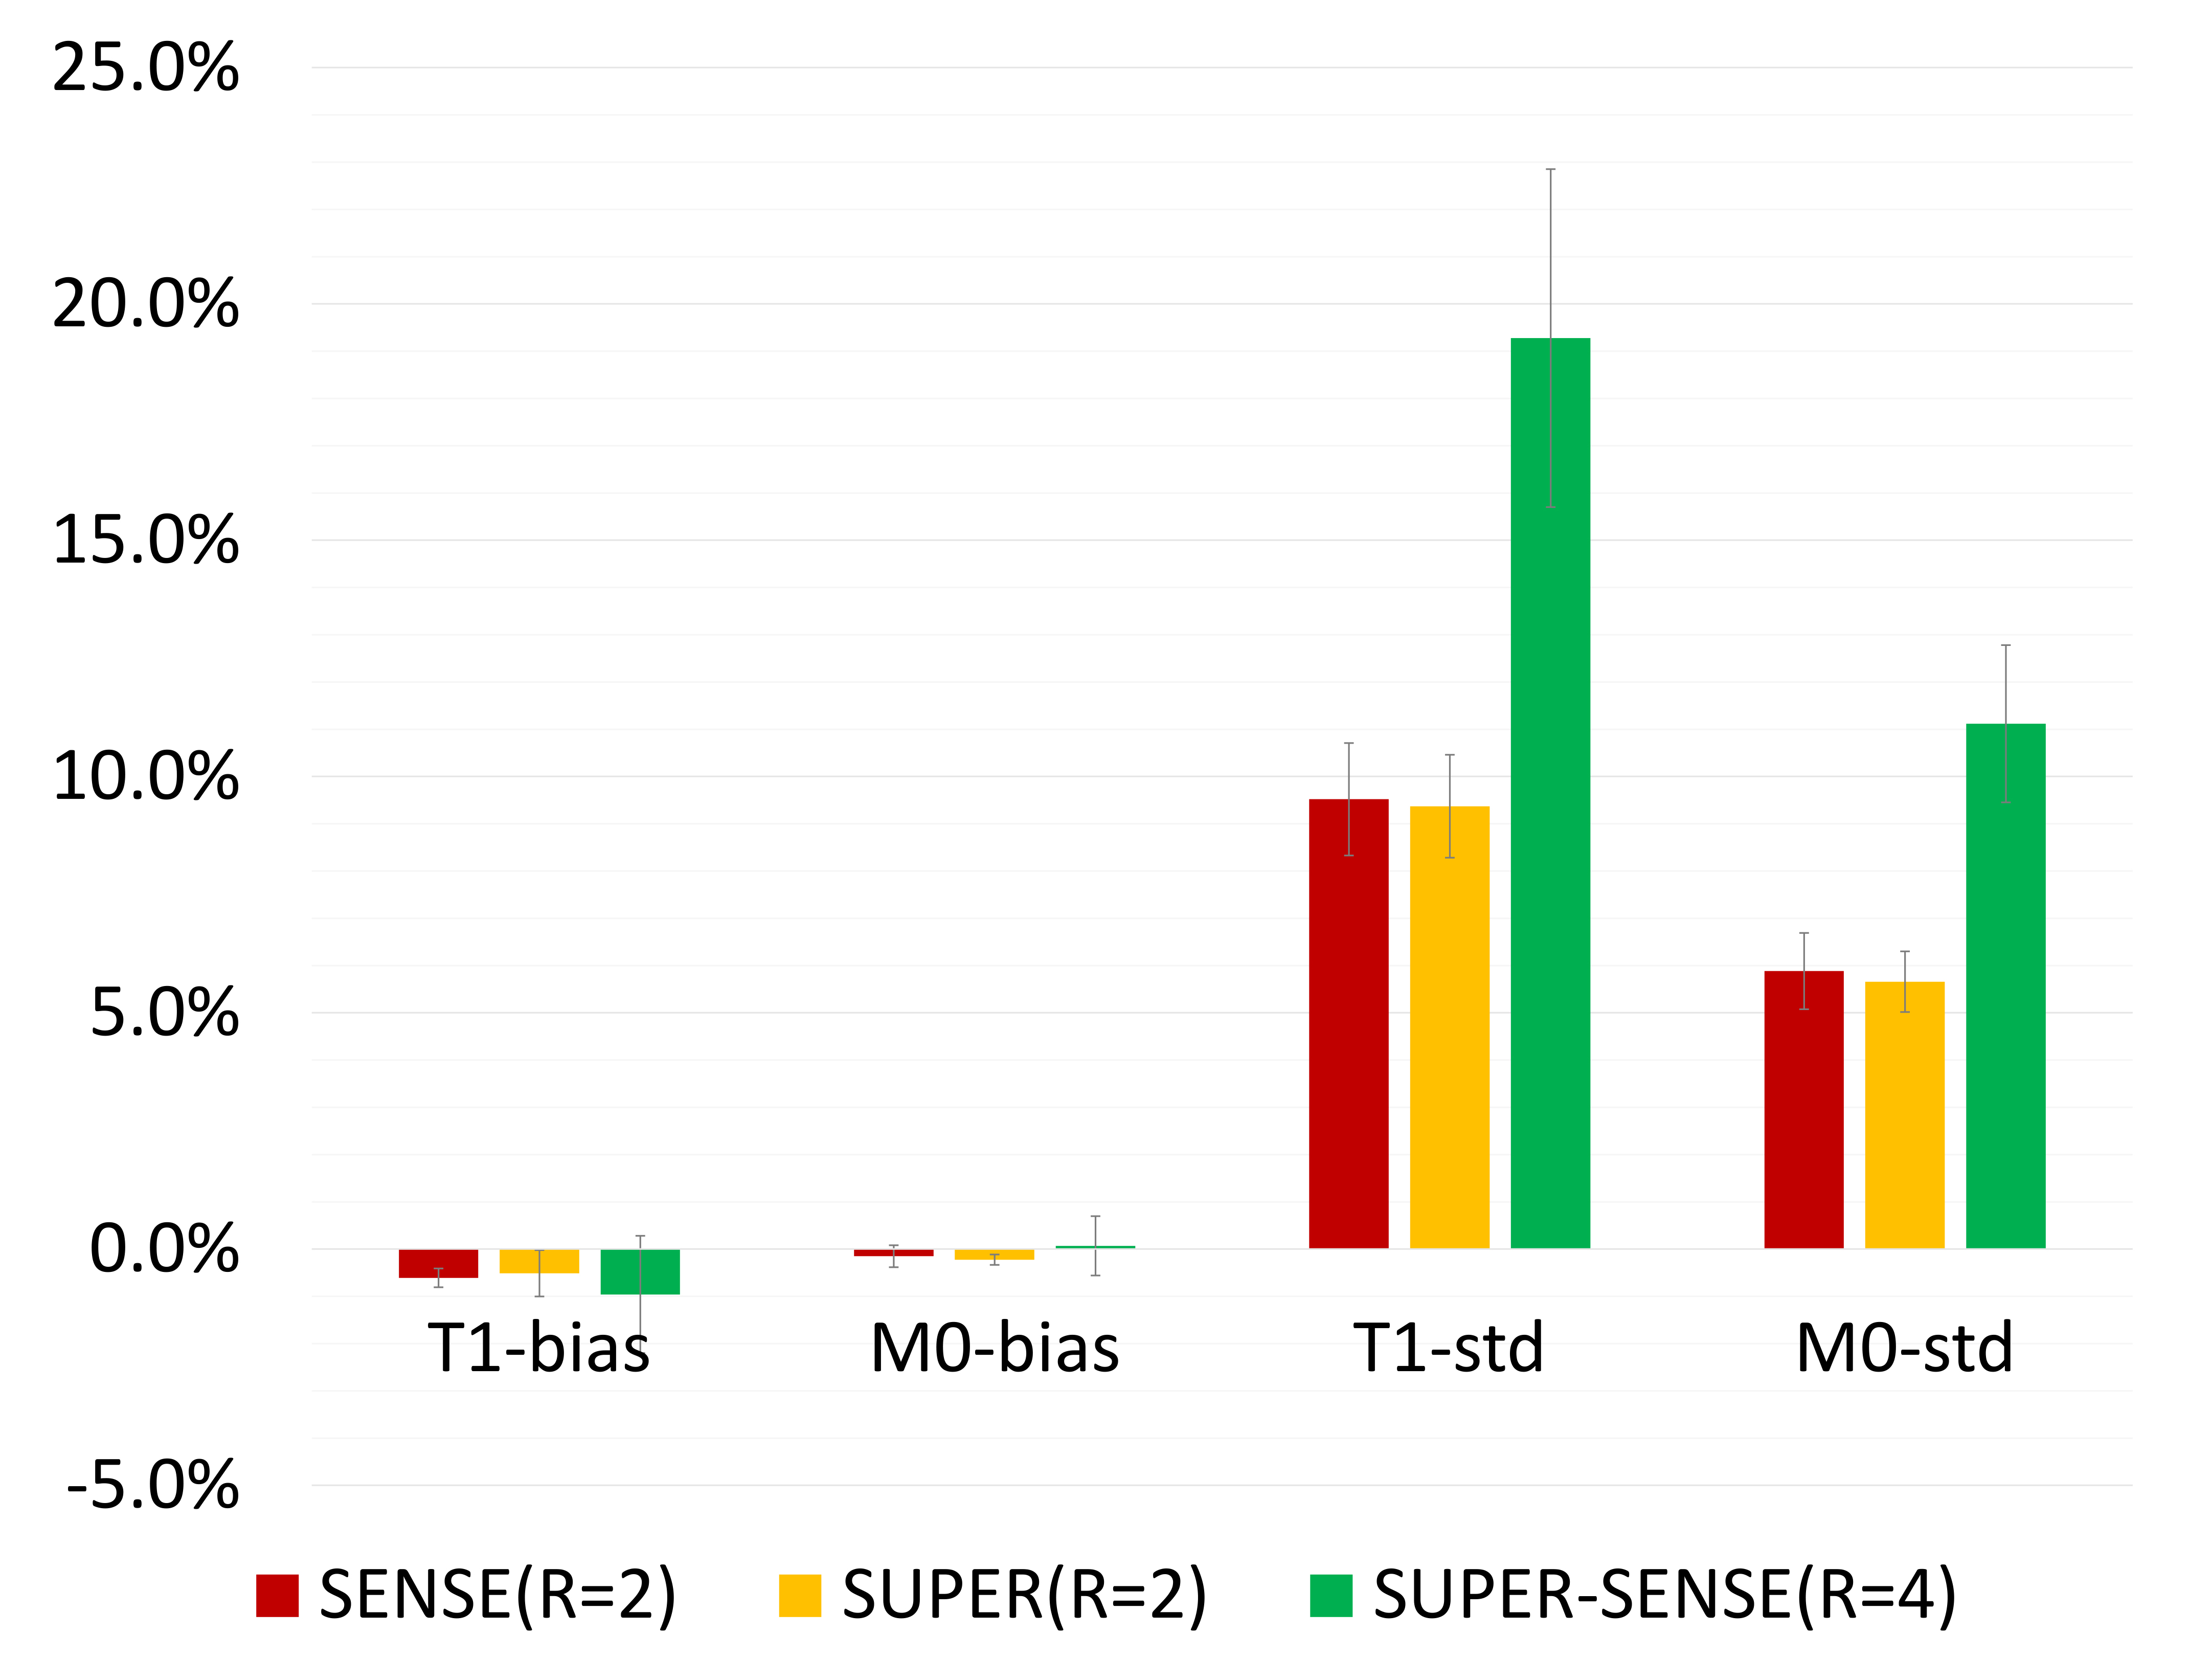
Figure 2 shows representative T1 and M0 maps in 5 slices of 1 healthy subject. All 3 acceleration methods achieved similar image quality compared with the non-acceleration gold standard, despite a 2- or 4-fold reduction of the reconstruction data. Figure 3 shows the T1 maps from the central slice in all 6 subjects, and the fractional T1-difference for all acceleration methods, calculated by (T1_acc – T1_nonacc)/T1_nonacc. There was visible noise amplification due to acceleration, but the map-SNR was reasonable and all image features were well preserved even under 4-fold acceleration. An ROI (illustrated in Figure 3) was drawn to measure the mean bias and standard deviation of the fractional T1 difference, and the results were shown in Figure 4. All methods were virtually unbiased (bias < 1%). SUPER had roughly the same precision with SENSE, which was remarkable considering that SUPER had only 5 “coils” while SENSE had 17. Note that the T1 and M0 standard deviation increases by at least a factor of square root of the acceleration factor due to scan time reduction. Figure 5 shows a video of 48 slices of T1 and M0 maps covering the entire upper brain. SUPER and SUPER-SENSE reduced the effective scan time from 5:20 minutes to 2:40 minutes and 1:20 minutes respectively, while remaining the image quality. The average reconstruction time per voxel for non-acceleration, SENSE, SUPER, and SUPER-SENSE was 5.7ms, 6.1ms, 6.4ms, and 4.1ms, respectively, which were similar between all methods.Conclusion
We demonstrated a novel application of SUPER to accelerate VFA T1 mapping up to 4-fold undersampling rate. Note that SUPER-SENSE exploits information redundancy along two independent domains, and this is important for suppressing noise amplification at high acceleration rates. In this work, we did not observe any aliasing artifacts from inaccurate modeling of signal that was previously observed with Look-Locker T1 mapping9, mainly due to a better nulling of fat in 3D brain imaging. No difference was found between SPAIR and SPIR, and aliasing artifacts occured when we turned off fat saturation. SUPER-SENSE can dramatically reduce the scan time for whole-brain T1 mapping, and improve image resolution in applications such as liver T1 mapping, where scan time is restricted by breath-holding. Although further investigation using prospective data is needed, the preliminary data shows that SUPER and SUPER-SENSE are accurate and practical approaches for accelerating VFA T1 mapping.Acknowledgements
References
1. Fram, EK., Herfkens, RJ., Johnson, GA., et al. Rapid calculation of T1 using variable flip angle gradient refocused imaging. Magnetic Resonance Imaging. 1987;5(3):201-208.
2. Cheng, HM. and Wright, GA., Rapid high‐resolution T1 mapping by variable flip angles: Accurate and precise measurements in the presence of radiofrequency field inhomogeneity. Magn. Reson. Med. 2006;55(3):566-574.
3. Coste, A., Boumezbeur, F., Vignaud, A., et al. Tissue sodium concentration and sodium T1 mapping of the human brain at 3 T using a Variable Flip Angle method. Magnetic Resonance Imaging. 2019;58:116-124.
4. Menke, RA., Scholz, J., Miller, KL., et al. MRI characteristics of the substantia nigra in Parkinson's disease: A combined quantitative T1 and DTI study. NeuroImage. 2009;47(2):435-441.
5. Li, Z., Sun, J., Hu, X., et al. Assessment of liver fibrosis by variable flip angle T1 mapping at 3.0T. J. Magn. Reson. Imaging. 2016;43(3):698-703.
6. Ding, Y., Rao, S.-X., Zhu, T., et al. Liver fibrosis staging using T1 mapping on gadoxetic acid-enhanced MRI compared with DW imaging. Clinical Radiology. 2015;70(10):1096-1103.
7. Chen BB. and Shih TT., DCE-MRI in hepatocellular carcinoma-clinical and therapeutic image biomarker. World J Gastroenterol. 2014;20(12):3125–3134.
8. Ippolito D., Inchingolo R., Grazioli L., et al. Recent advances in non-invasive magnetic resonance imaging assessment of hepatocellular carcinoma. World J Gastroenterol. 2018;24(23):2413–2426.
9. Hu, C. and Peters, DC., SUPER: A blockwise curve‐fitting method for accelerating MR parametric mapping with fast reconstruction. Magn Reson Med. 2019;81(6):3515-3529.
10. Hu, C. and Peters, DC., High-resolution single-breath-hold cardiac T2 mapping based on SUPER-SENSE-PCA. SCMR 2019, Seattle, Washington, USA .
11. Pruessmann, KP., Weiger, M., Scheidegger, MB., et al. SENSE: Sensitivity encoding for fast MRI. Magn. Reson. Med. 1999;42(5):952-962.
Figures