3788
To Evaluate the Effect of Compressed-SENSE on Accuracy of High-Resolution Quantitative T1-Perfusion MRI Parameters and on glioma grading at 3T1Indian Institute of Technology Delhi, New Delhi, India, 2Fortis Memorial Research Institute, Gurugram, India, 3Philips India Limited, Gurugram, India, 4Indian Institute of Technology Delhi, Hauz Khas, India, 5All India Institute of Medical Science, New Delhi, India
Synopsis
T1-perfusion derived parameters have been utilized for brain tumor quantification and grading. In this study, we have analyzed the potential of Compressed SENSE (CSENSE) acceleration technique on high resolution T1-perfusion MRI for quantitative analysis of brain tumor(glioma) and compared its performance and accuracy with conventional acquisition protocol in terms of concentration-time curve, perfusion parameters and glioma grading. A prospective analysis was also carried on healthy subjects to analyze the spatial error propagation at different acceleration factors(R). All derived perfusion parameters were able to quantify and differentiate different tumor classes with improved concentration-time curve(High grade and low grade glioma).
Introduction
T1-perfusion derived parameters acts as a biomarker in tumor angiogenesis and hence clinicians and researchers have been utilizing its potential for tumor analysis1. Several scan acceleration techniques such as SENSE2, compressed sensing(CS)3, compressed-SENSE(CSENSE)4etc. have been utilized in clinical practice to improve the spatial coverage and resolution for MR perfusion imaging. A preliminary study was previously reported5 on analyzing the effect of CSENSE enabled T1-perfusion derived rCBV in differentiating high grade and low grade glioma on 25 patients. In this extension to previous study, we have prospectively analyzed the spatial error propagation as a function of acceleration factor(R) on healthy subjects and a retrospective analysis was carried on T1-perfusion data of 100 treatment naïve subjects to evaluate the effect of CSENSE on accuracy and performance of quantitative perfusion parameters and the behavior of concentration-time curves(CTC) on contralesional healthy tissue as well as on tumor tissue, and compared it with conventional acquisition protocol(protocol-1).Methods
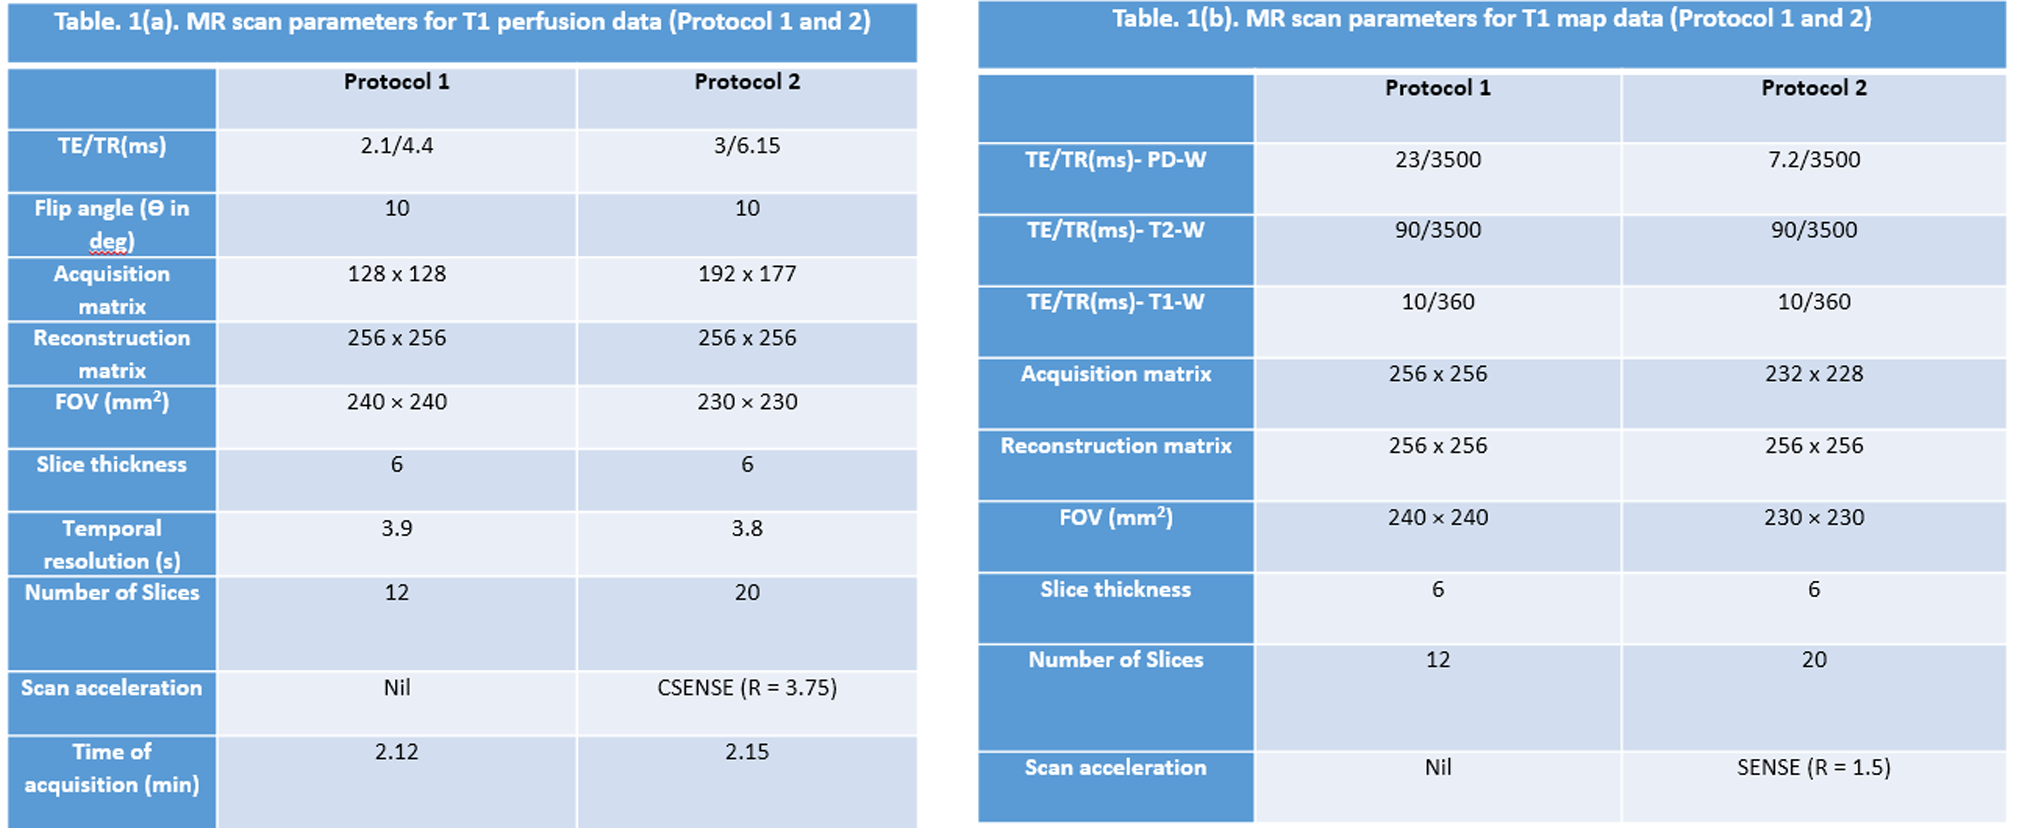
All MRI experiments were carried out using 3.0 T whole body Ingenia MRI system(Philips Healthcare, The Netherlands) using a 15 channel head coil. A retrospective analysis was carried on T1-perfusion MRI data of 100 treatment naïve glioma subjects(50 subjects/protocol) acquired using protocol-1 and CSENSE enabled protocol(protocol-2). Each protocol subsumed equal number of HGG and LGG subjects. A prospective study, which included acquisition of 3D T1-FFE images(20 slices and 8 dynamics) of 3 healthy volunteer without the injection of intravenous contrast agent was also carried out to analyze the error propagation with respect to R. Repeatability was measured using co-efficient of variation(COV) at different ROIs in white matter. The MR parameters for both acquisition protocols are given in table 1. All patients were intravenously administered with 0.1 mmol/kg body weight of gadobenate dimeglumine Gd-BOPTA(Multihance, Bracco) at the fourth time point. Protocol-2 took the advantage of SENSE enabled scan acceleration(R=1.5) for T1 mapping7. We have considered the histologically confirmed grades based upon WHO 2016 classification as a gold standard.Normalized-Mean-Squared-Error(NMSE) was used to evaluate the error propagated as a function of R in healthy volunteer data. Generalized-Tracer-Kinetic-model6 and first pass analysis was used for T1-perfusion analysis. Quantitative perfusion parameters CBV(leakage corrected CBV)2 and CBF used in this study were normalized using their mean values in the normal–appearing-white-matter tissue on the contralesional side to obtain rCBV and rCBF maps. Glioma grading was carried out using independent perfusion parameters as well as combination(using logistic regression) of different parameters computed at tumor tissue(contrast-enhancing and non-enhancing area) segmented using previously reported semi-automatic method6. Mean values greater than 90th percentile was used for grading(ROC analysis) and statistical analysis(t-test).
Results
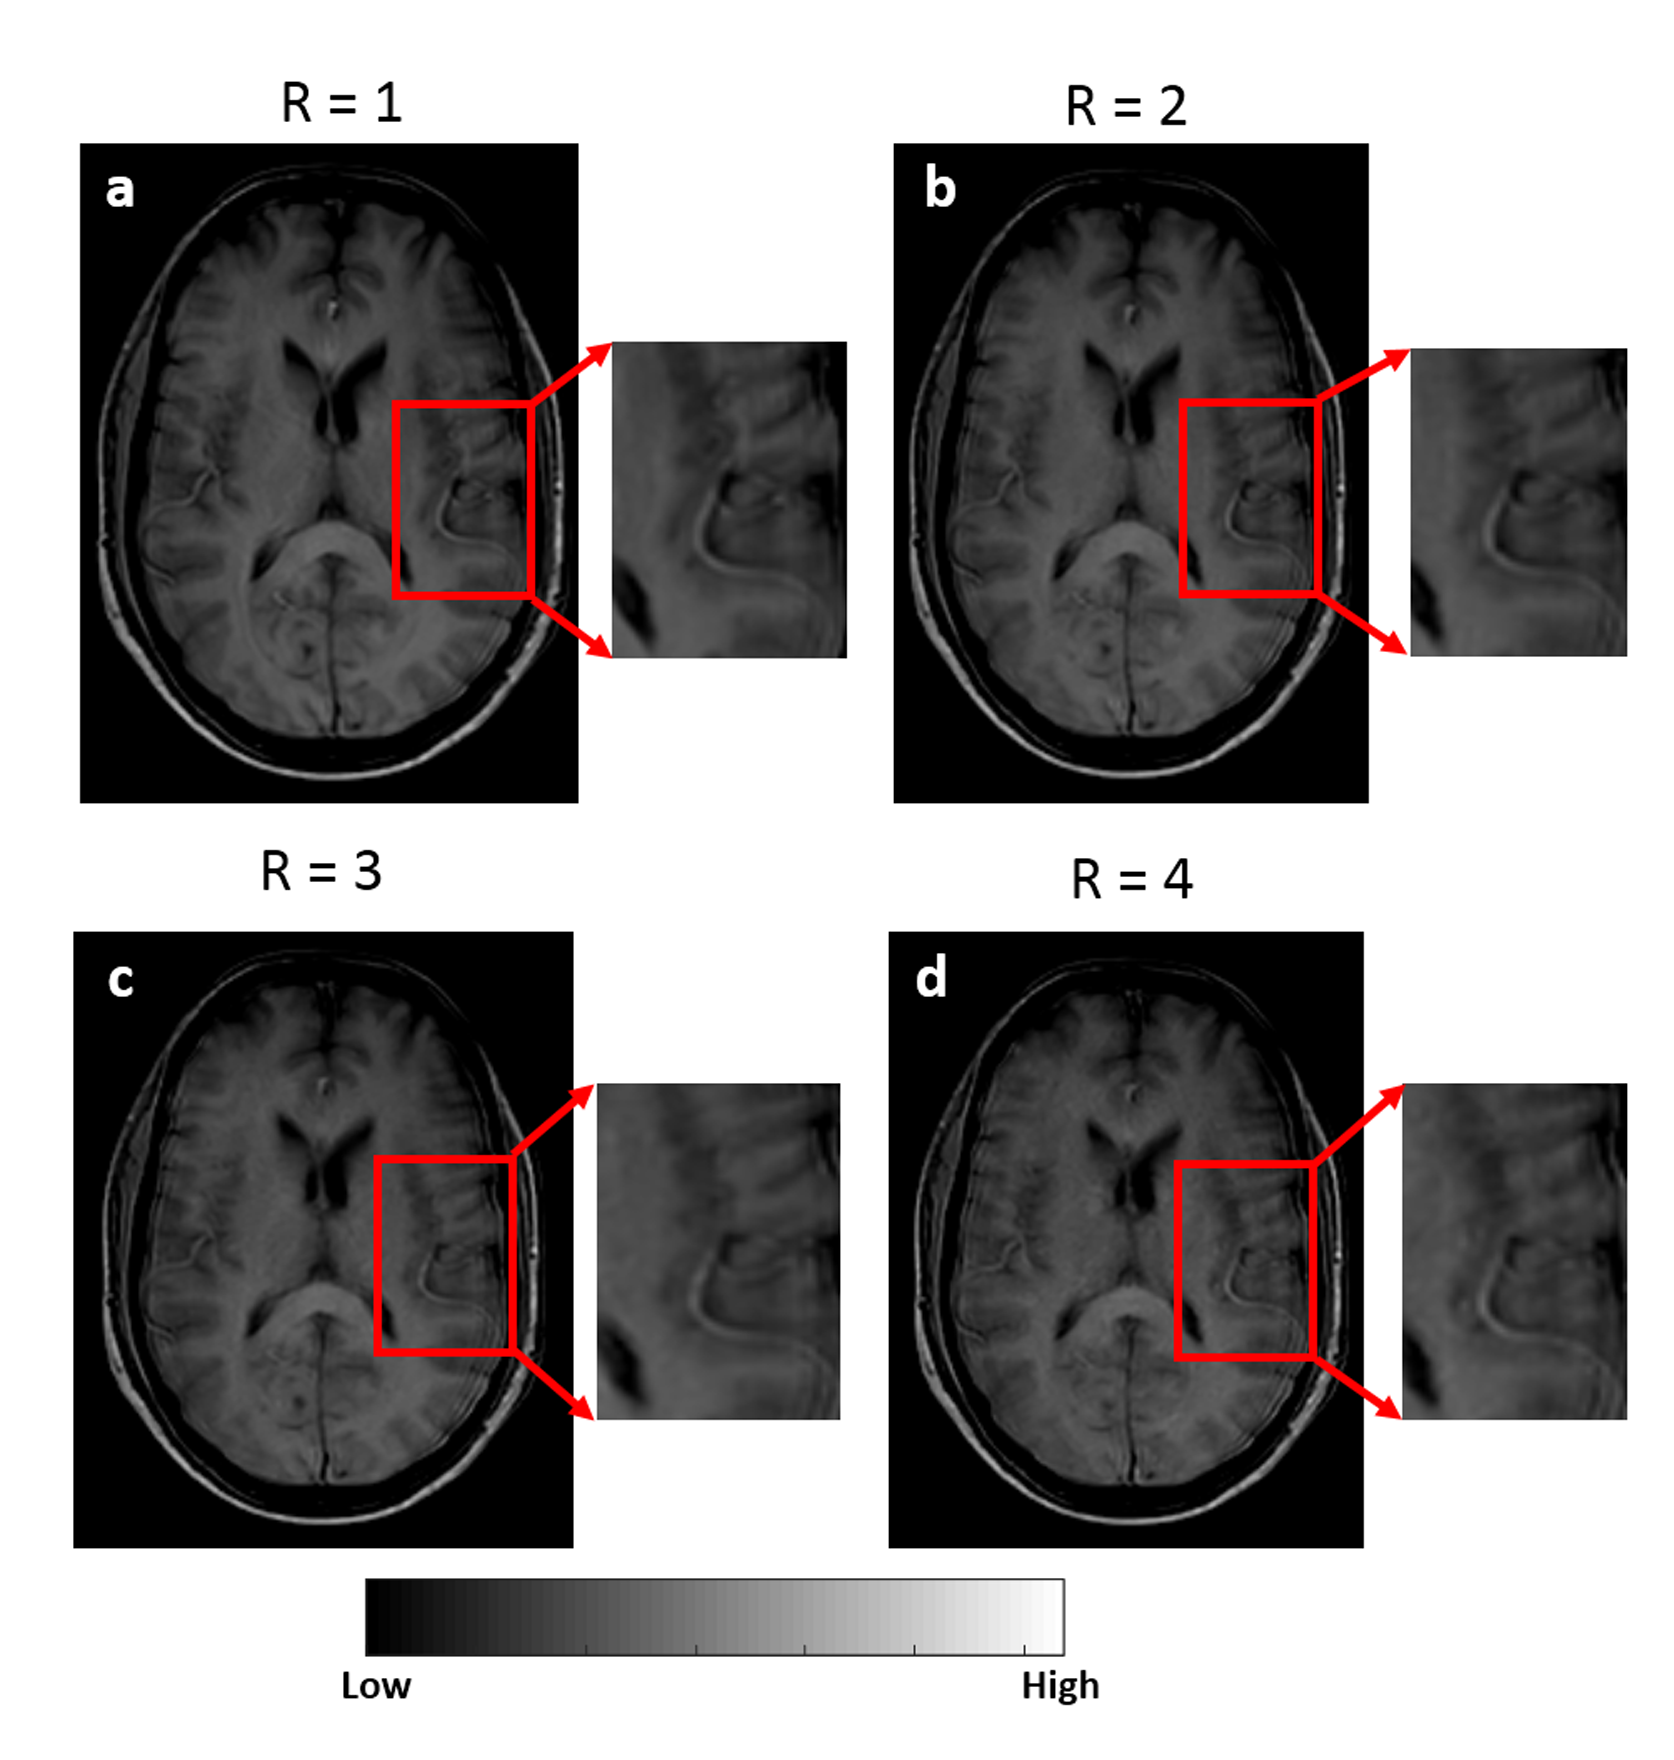
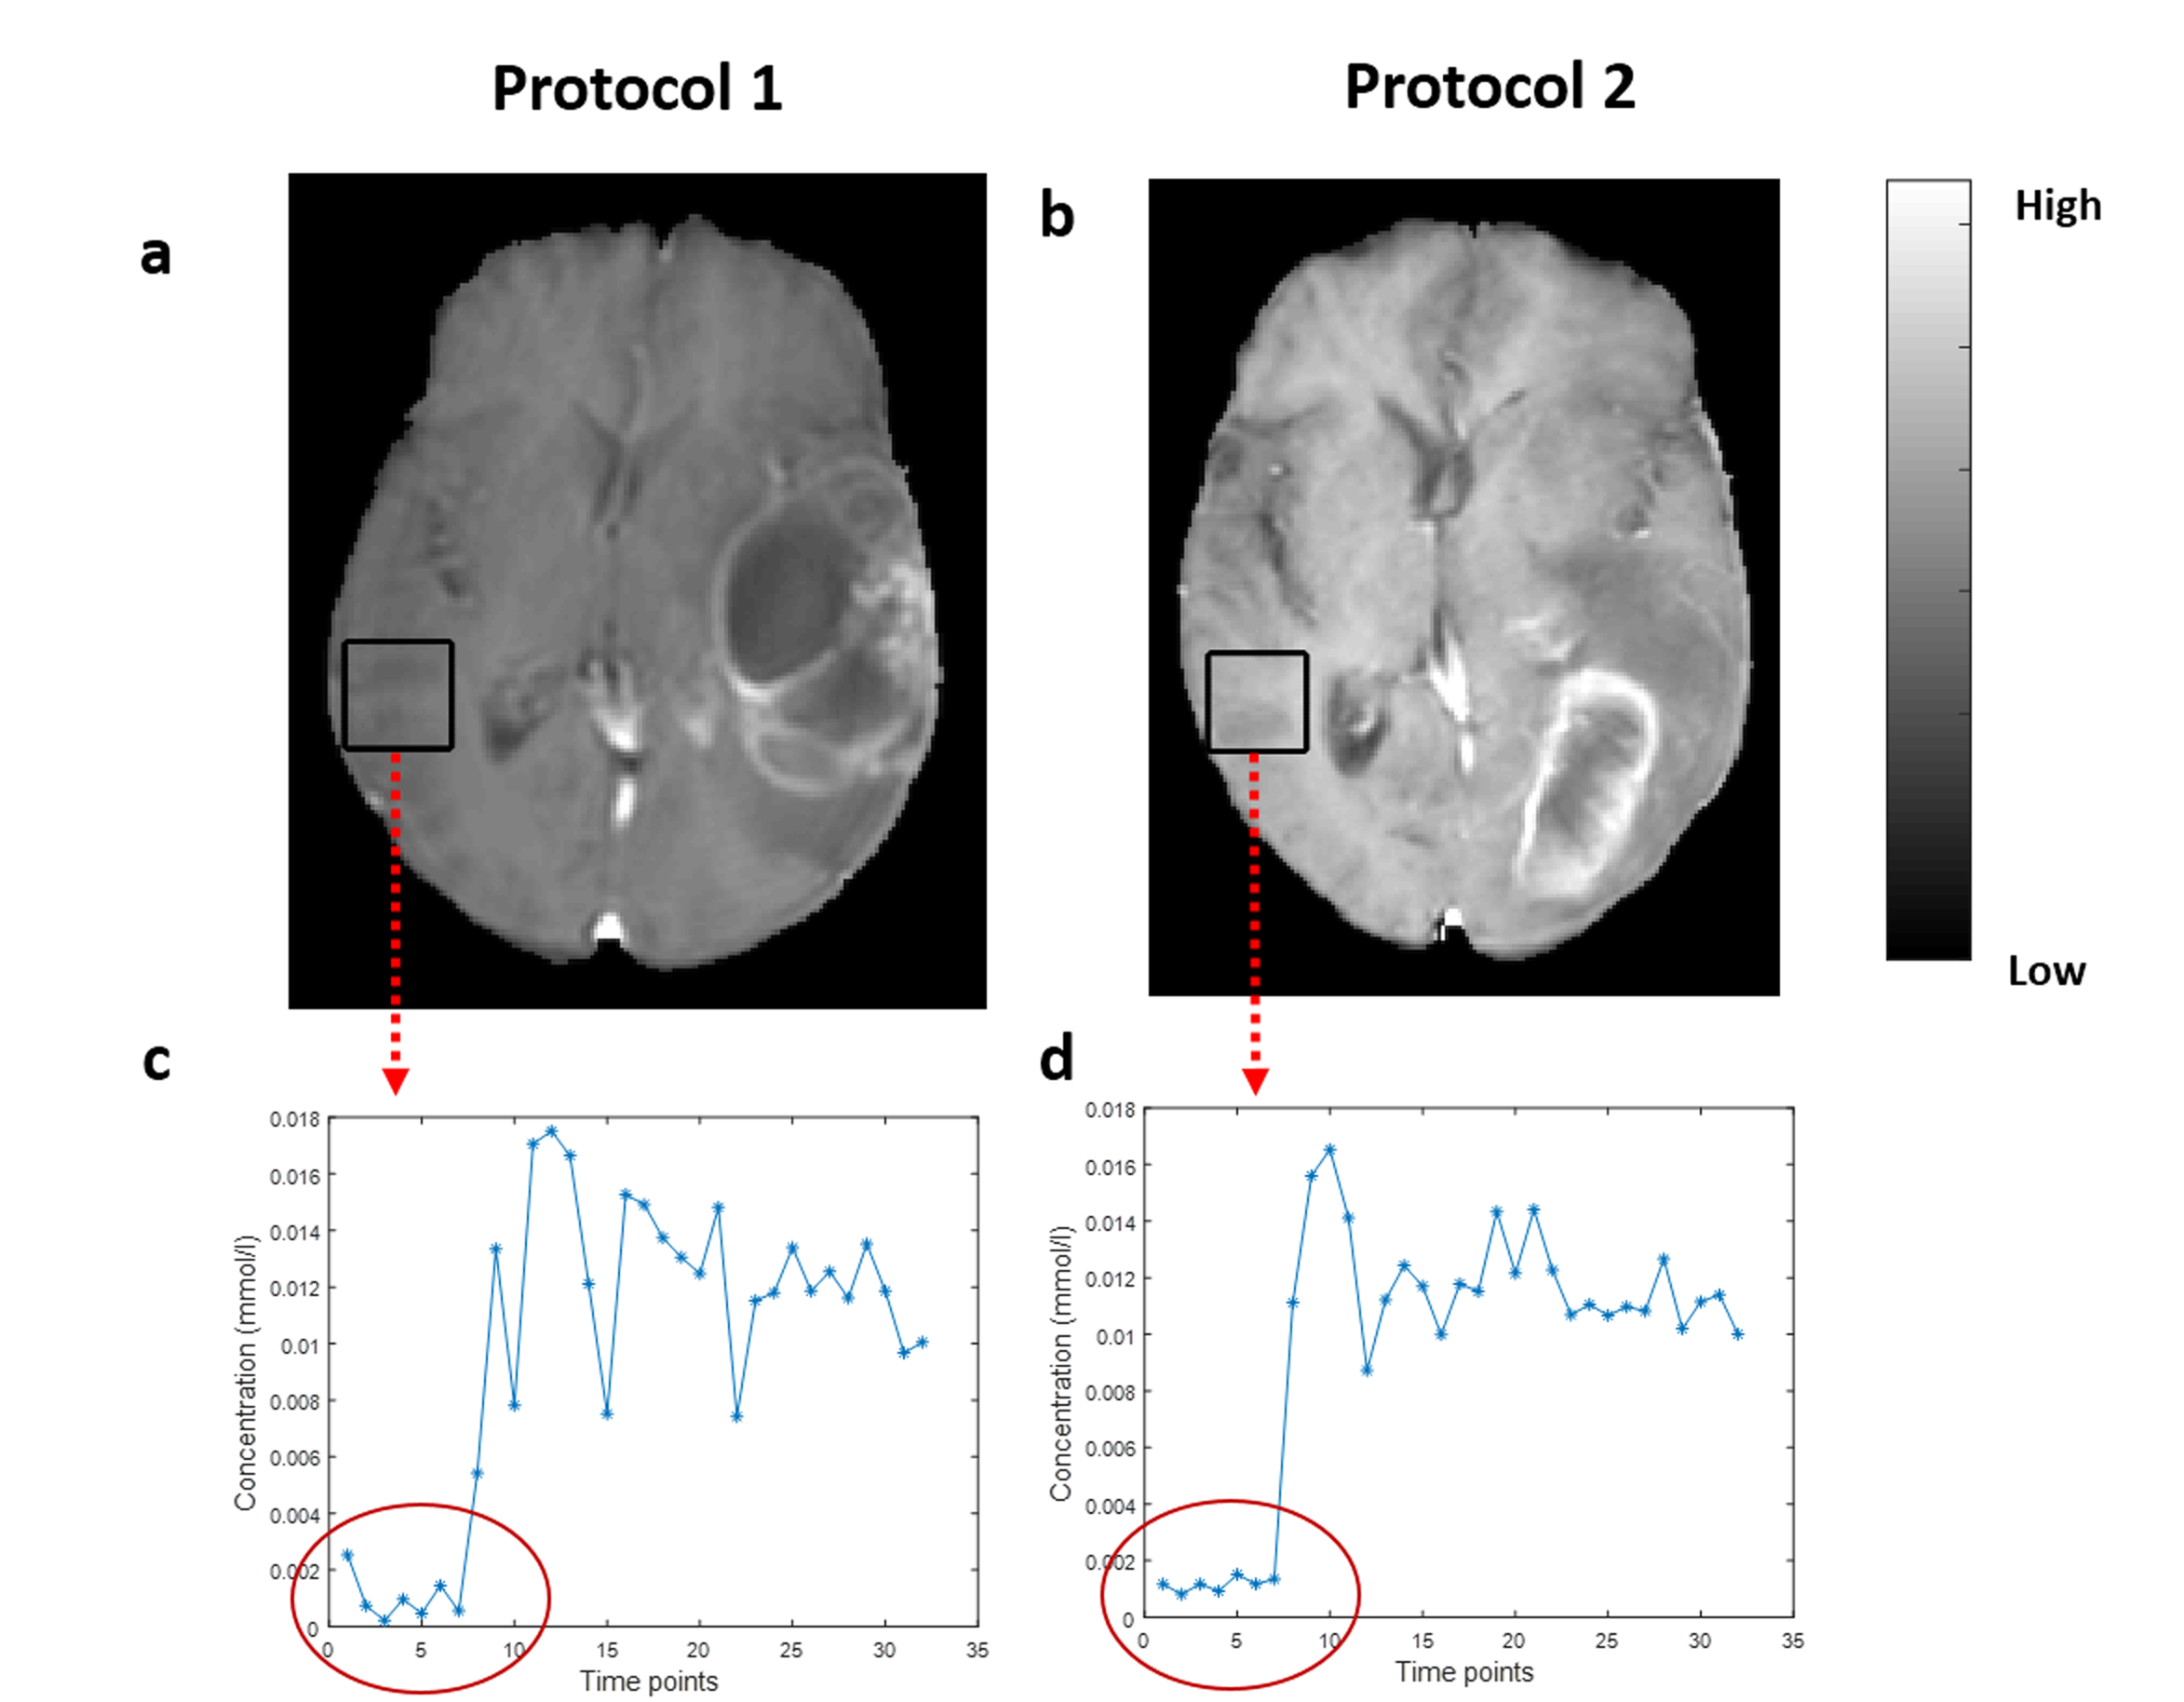
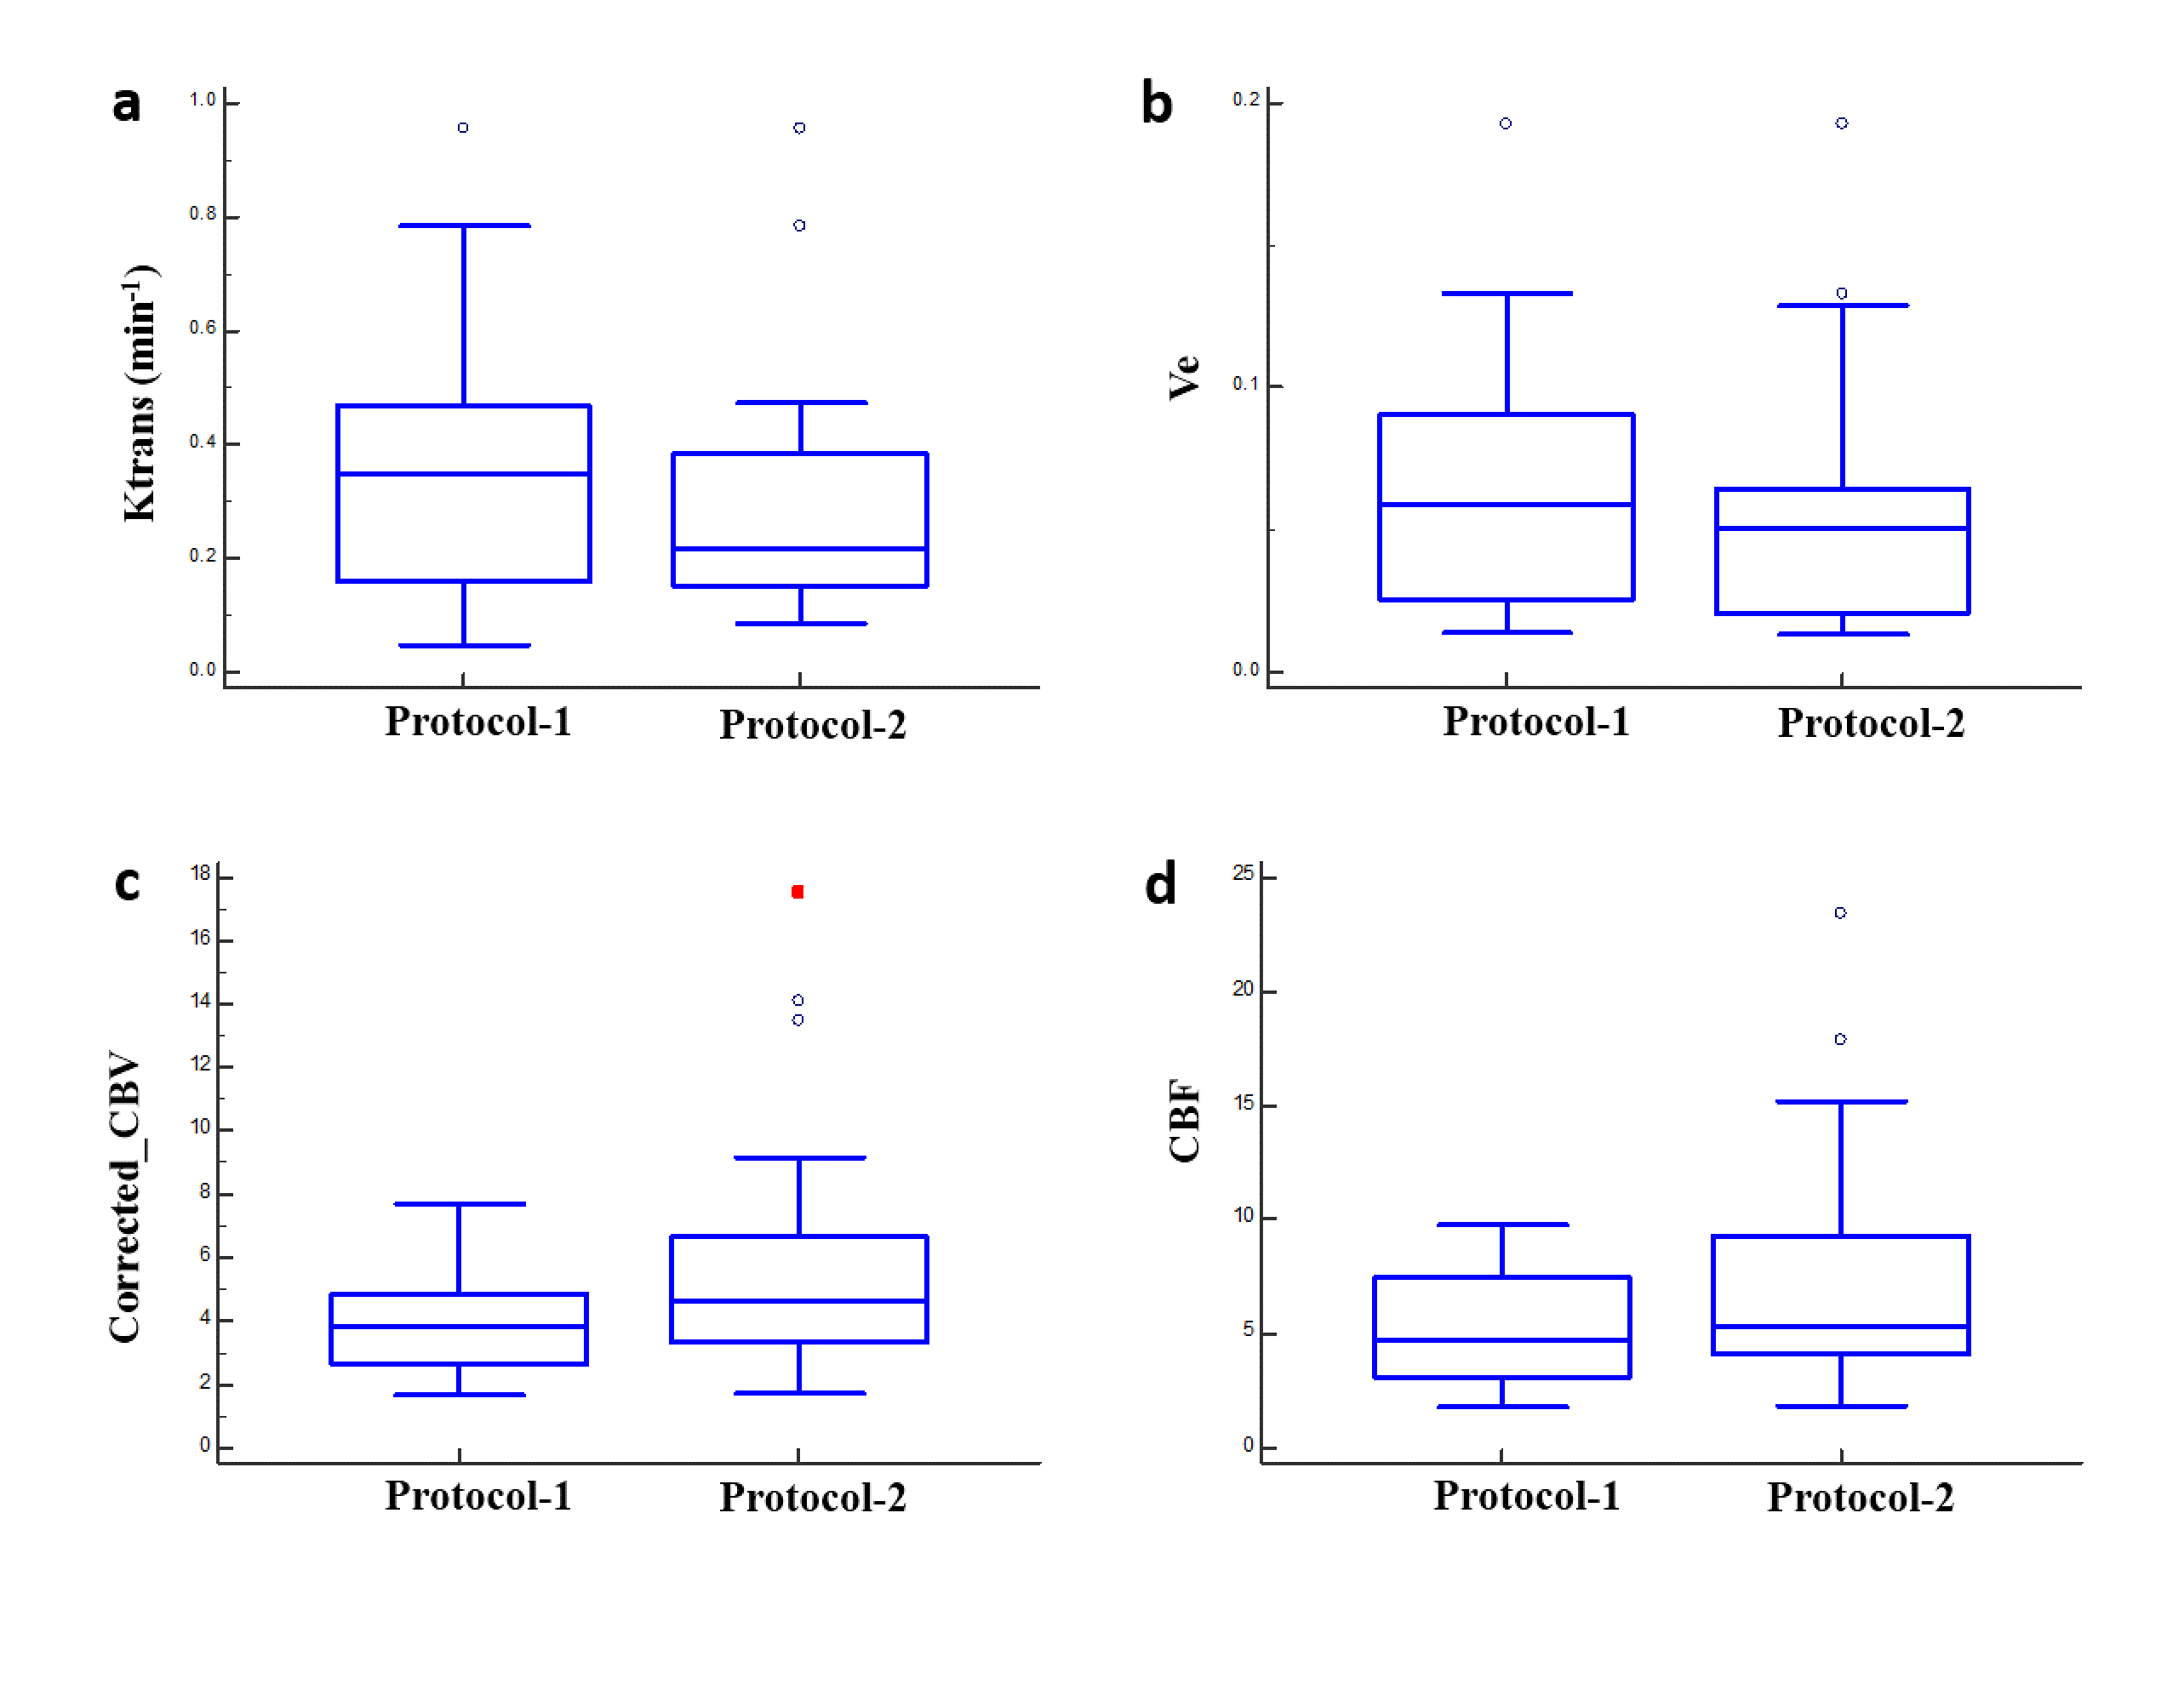
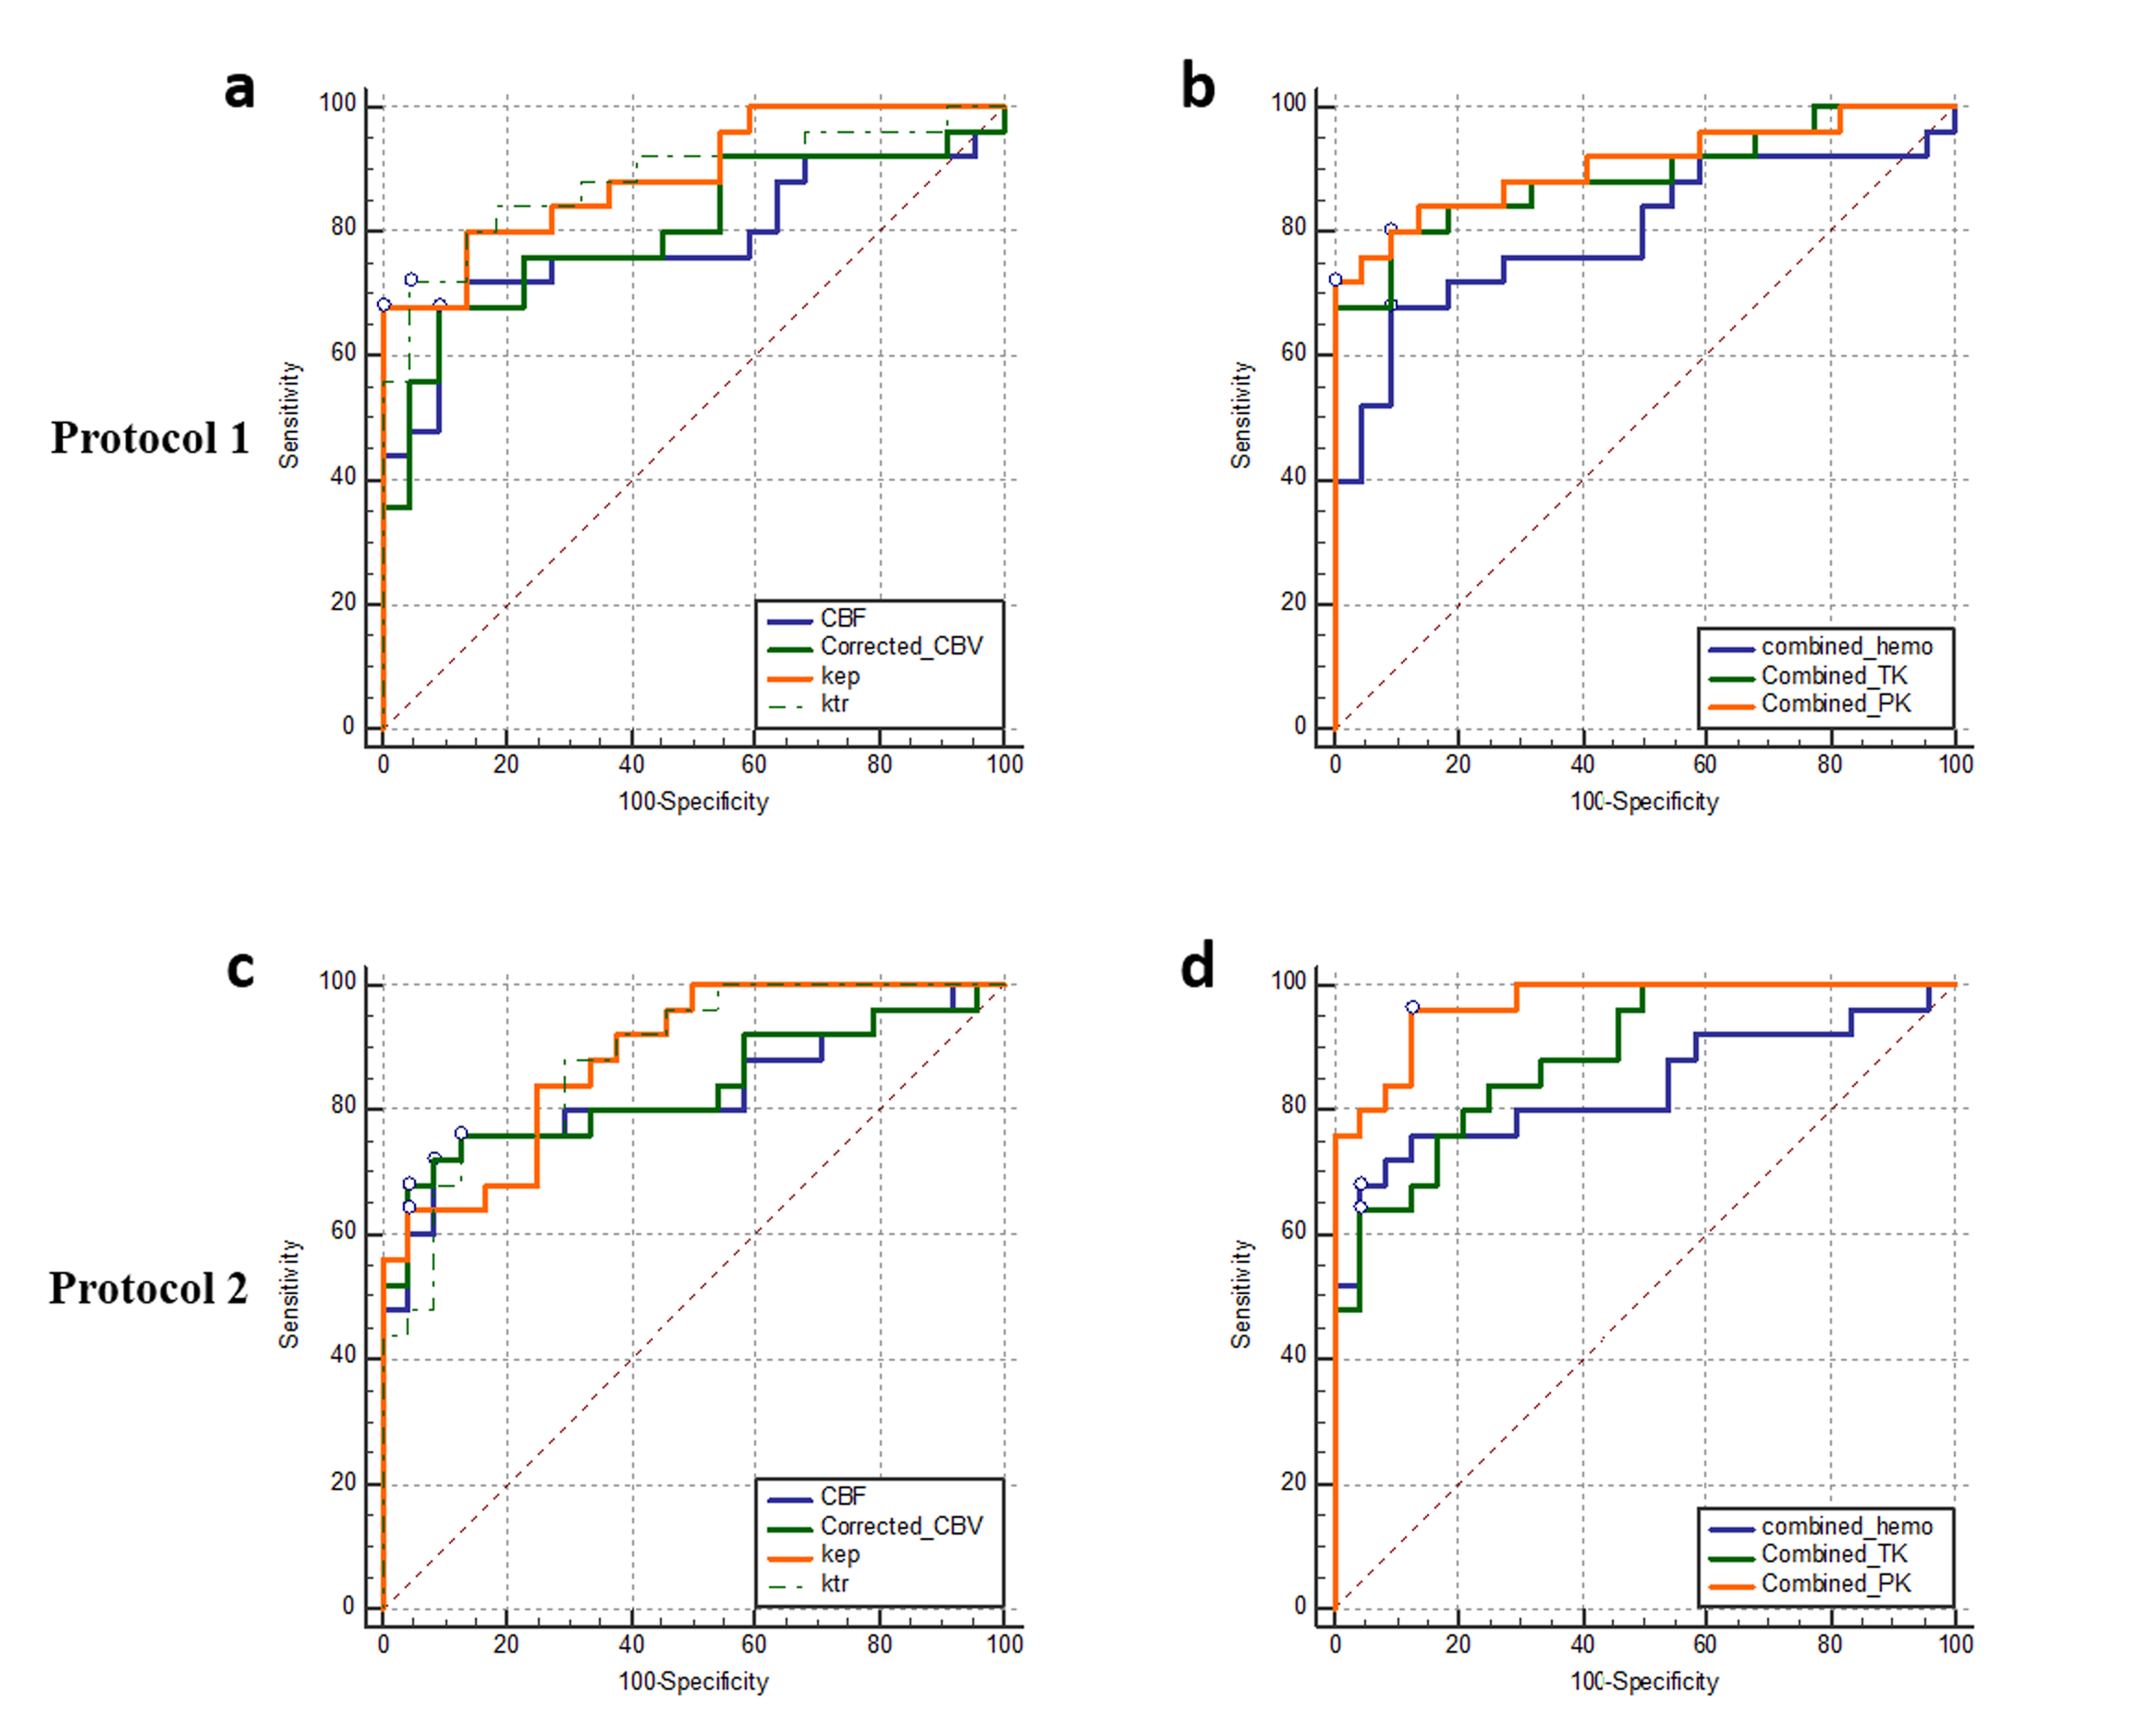
The acquisition of 20 slices 3D-T1-FFE images at 32 time points using protocol-2 took ~1.9 times less than the time taken for acquiring the same images without any scan acceleration. Also, protocol-1 took similar time of acquisition (same temporal resolution) for lesser spatial coverage and resolution compared to protocol-2. Figure-1 shows the T1-FFE images of a healthy subject acquired at different R. The NMSE of images at R = 2, 3 and 4 were (5.23±2.35)×10-4, (6.64±2.95)×10-4 and (9.66±3.33)×10-4 respectively. Figure 2 shows the similar slices of a 2 different subjects for different protocols and CTC corresponding to each protocol. CTC exhibited more oscillations(noisy) in protocol-1. The mean CBV at gray matter ROIs of 25 representative HGG data from each protocol were statistically similar(p=0.23, mean rCBV at GM ROIs were 1.39±0.55 and 1.34±0.23 respectively for protocol-1 and 2). Figure 4 shows box-whisker plot of all perfusion parameters of HGG data acquired using both protocols. Even if most of the values comes under the inter-quartile range, the range of tracer kinetic parameters were more in protocol-1, while the hemodynamic parameter has shown a lesser range. The perfusion parameters of both protocols didn’t change significantly(Ktrans(p=0.3971), Ve(p=0.4222), rCBV(p=0.1562) and rCBF (p=0.1621). Figure 5 show the ROC plots for differentiating glioma using individual perfusion parameters as well as combining all parameters(rCBV, rCBF, Ktrans and Ve) for protocol-1 and protocol-2. In protocol-2, combining all parameters has produced an AUC 0.962 with 88% sensitivity and 95.83% specificity.Discussion
This study evaluated the potential of CSENSE(at R=3.75) in improving the spatial coverage and resolution of data acquired for T1-perfusion MRI for quantitative analysis of glioma and compared it with conventional protocol. For CSENSE, on increasing R(upto 4), even though the error in signal increases, it didn’t effect much the behavior of concentration-curve. On the other hand it has reduced the oscillations in CTC, since the increased resolution inversely effects the presence of ringing related artefacts. Since there was no statistically significant change observed for hemodynamic parameters at normal appearing tissues and all perfusion parameters in tumor tissues, R=3.75 can be adopted in to a clinical setting, which can either be used to improve the scan time, spatial resolution or coverage. In this study, better accuracy of grading was observed while combining all parameters for both protocolsConclusion
For the application of T1-perfusion MRI to brain tumour(glioma), compressed-SENSE can be used at R=3.75 without compromising the data quality either to reduce the scan time or to increase the resolution/coverage. Accuracy of quantitative parameters as well as their performance in Glioma grading was similar to conventional imaging protocol(Protocol-2).Acknowledgements
This work was supported by SERB (Quantitative software tools for processing DCE perfusion MRI data of patients with intracranial Mass lesions (YSS/2014/000092)) and IIT Delhi. The authors would like to acknowledge Philips India Limited in data acquisition and Dr. Pradeep Kumar Gupta and Dr. Mamta Gupta for data handling. The authors also acknowledge Dr Rana Patir and Dr Sunita Ahlawat for clinical input.References
1. Falk A, Fahlström M, Rostrup E, Berntsson S, Zetterling M, Morell A. Discrimination between glioma grades II and III in suspected low-grade gliomas using dynamic contrast-enhanced and dynamic susceptibility contrast perfusion MR imaging : a histogram analysis approach. 2014:1031-1038. doi:10.1007/s00234-014-1426-z
2. Guo Y, Lebel RM, Zhu Y, et al. High-resolution whole-brain DCE-MRI using constrained reconstruction: Prospective clinical evaluation in brain tumor patients. Med Phys. 2016;43(5):2013-2023. doi:10.1118/1.4944736
3.Smith DS, Li X, Abramson RG, Quarles CC, Yankeelov TE. Potential of compressed sensing in quantitative MR imaging of cancer Theory of CS. 2013;13:633-644. doi:10.1102/1470-7330.2013.0041
4.Geerts-ossevoort L, Weerdt E De, Duijndam A, et al. Speed done right . Every time . Why is it important to increase productivity ?
5. Gupta RK, Saha I, Singh A, et.al. Proc. Intl. Soc. Mag. Reson. Med. 26 (2018), 3419.
6. Singh A, Haris M, Rathore D, et al. Quantification of Physiological and Hemodynamic Indices Using T 1 Dynamic Contrast-Enhanced MRI in Intracranial Mass Lesions. 2007;880:871-880. doi:10.1002/jmri.21080
7. Sasi SD, Singh A, Bhattacharjee R, et.al. Proc. Intl. Soc. Mag. Reson. Med. 27 (2019), 4414.
8. Sahoo P, Gupta RK, Gupta PK, et al. Diagnostic accuracy of automatic normalization of CBV in glioma grading using T1- weighted DCE-MRI. Magn Reson Imaging. 2017;44:32-37. doi:10.1016/j.mri.2017.08.003
Figures