3787
The cerebral blood flow derived from multi-delay ASL MRI varies with the choice of post-labeling delay1Department of Medical Imaging, National Taiwan University Hospital Hsin-Chu Branch, Hsinchu, Taiwan, 2Department of Neurology, National Taiwan University Hospital, Taipei, Taiwan, 3Institute of Medical Device and Imaging, National Taiwan University, Taipei, Taiwan, 4Graduate Institute of Clinical Medicine, National Taiwan University, Taipei, Taiwan
Synopsis
With arterial spin labeling (ASL) MRI, the delay time between labeling and image acquisition is a critical imaging parameter for accurate flow quantification. Multi-delay ASL has been proposed to tackle the problem of unknown arterial transit time (ATT). However, it is not fully understood how the range of delay times affects the derived CBF. The present study aimed to investigate this potential issue. Results show that the CBF derived from multi-PLD ASL varies with the choice of PLD (overestimated when the PLD range does not cover ATT) as well as SNR (overestimated along with greater variability when SNR is low).
Introduction
Arterial spin labeling (ASL) is an MRI technique that provides cerebral blood flow (CBF) measurement without contrast administration 1. The delay time between labeling and image acquisition is an ASL-specific imaging parameter critical for accurate flow quantification. The optimal delay time is the arterial transit time (ATT), which unfortunately is usually unknown and can vary with diseases 2 and anatomical locations 3. Multi-delay ASL has been proposed to tackle this problem by acquiring data at multiple delays and nonlinear model fitting 4. However, it is not fully understood how the range of delay times affects the derived CBF. The present study aimed to investigate this potential issue by using computer simulations and experimental data obtained from healthy subjects.Materials and Methods
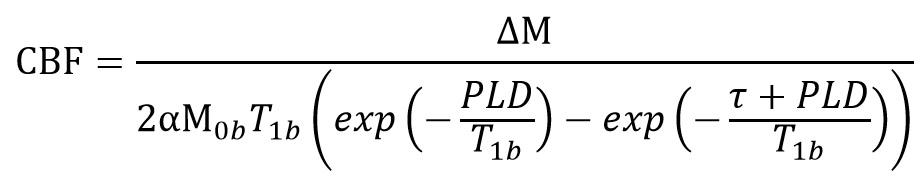
1. MRI Experiments. The Institutional Review Board approved this study. Eight healthy subjects (five women, three men; age = 33-56 years) were included after they provided written informed consent. On a 3-Tesla clinical system, pseudo-continuous ASL was performed with five post-labeling delays (PLDs = 0.4, 0.8, 1.2, 1.6, 2.0 s; labeling duration τ = 2.0 s; 30 tag/control pairs for each PLD), followed by a gradient-echo echo-planar readout (TR = 5 s, TE = 13 ms, FOV = 20-22 cm, in-plane matrix = 64, 14 slices, slice thickness = 5 mm, slice gap = 1-2 mm). Average difference images (ΔM) were obtained for each PLD and fitted to the model describe in Ref. 5 to estimate CBF (referred to as multi-PLD CBF in the following context), assuming a single intravascular compartment for simplicity. CBF was also calculated for each PLD (single-PLD CBF) by Equation [1]. Bootstrap was performed to estimate measurement variability.2. Computer Simulation. With the above-mentioned model, DM was generated with varied PLD (0.4-3.6 s, in steps of 0.4 s), ATT (1, 2, and 3 s), and CBF (20 and 60 ml/100ml/min, typical flow quantity of white matter and gray matter, respectively). Rician noise (n) was then added with signal-to-noise ratio (SNR) defined in reference to M0b (see Equation [2]). For each combination of PLD, ATT, CBF, and N (20 and 100), 1000 sets of signals were generated and from which multi-PLD CBF and single-PLD CBF were calculated.
Results and Discussion
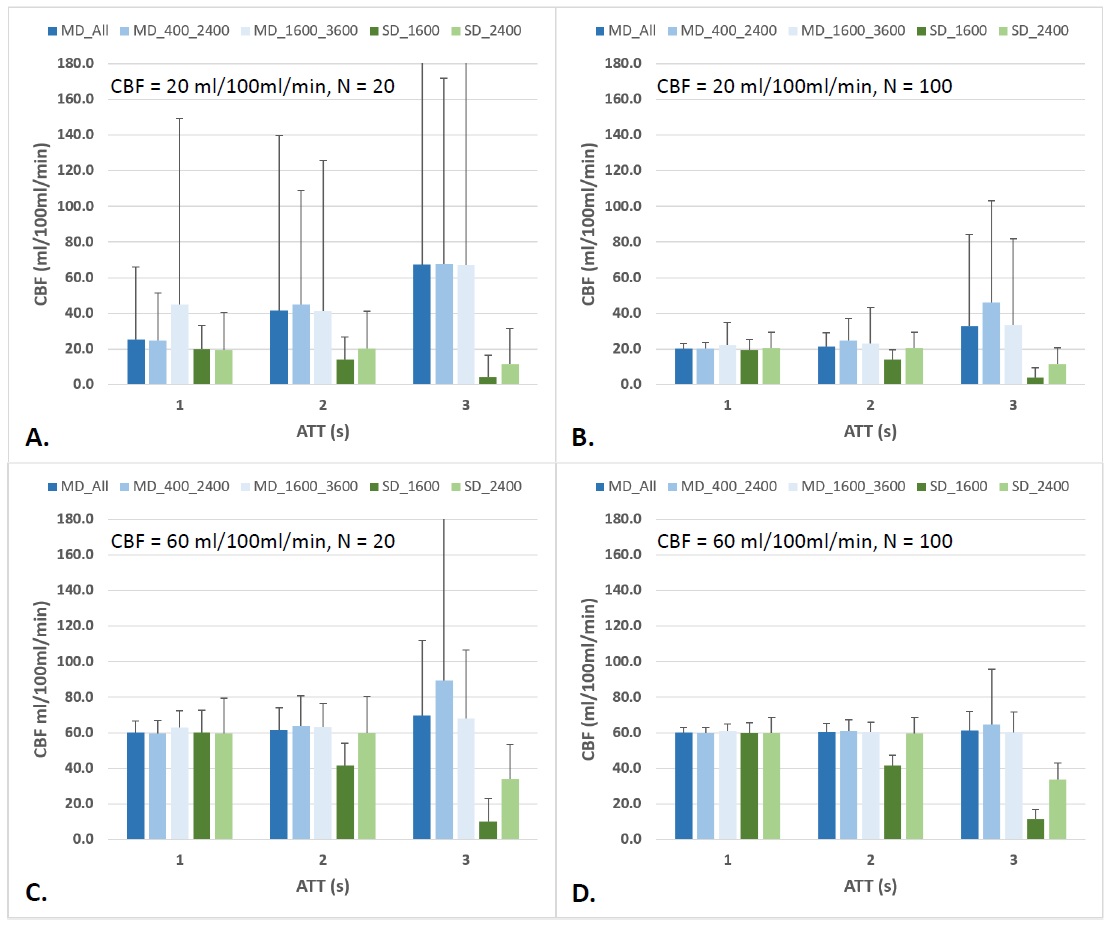
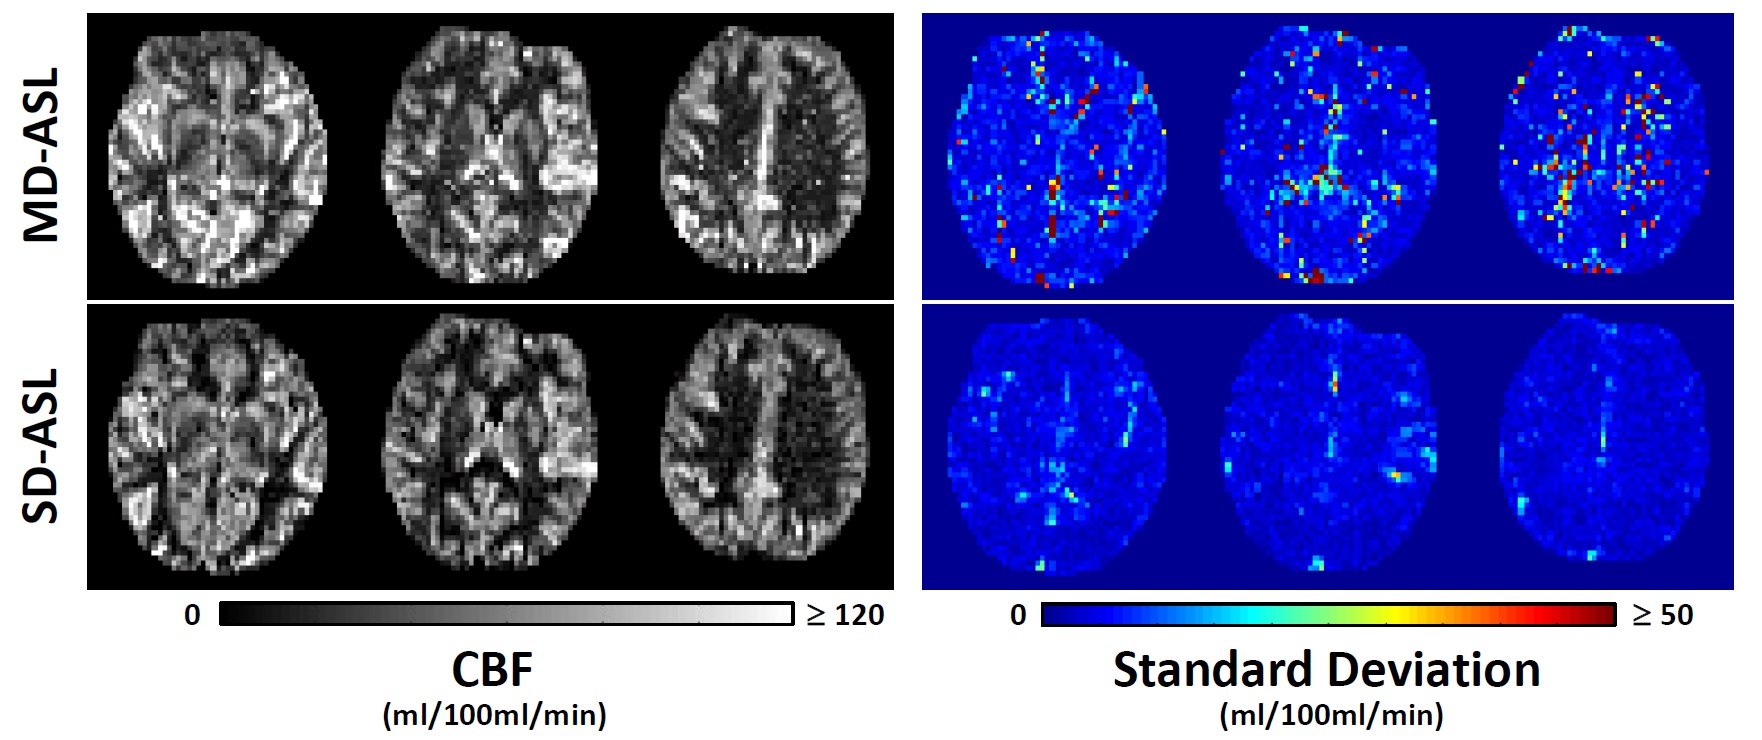
Figure 1 summarizes the flow values calculated with multi-PLD and single-PLD methods (mean and standard deviation of 1000 datasets). As expected, single-PLD underestimates CBF when PLD is shorter than ATT. On the other hand, multi-PLD tends to overestimate CBF when SNR is low (particularly in 1A, and also in 1B-1D when ATT = 3 s). The overestimation is more remarkable when the PLD range does not cover ATT. Overall, multi-PLD yields larger measurement variability. Note that the scan time for single-PLD here is shorter than required for multi-PLD. That is, if the PLD is properly chosen, single-PLD is expected to achieve higher accuracy and precision for a given scan time. Figure 2 shows representative CBF maps obtained with multi- and single-PLD methods. Also note in Figure 1 that N = 100 (tag/control pairs) was adopted to demonstrate the high-SNR condition, which does not suggest practicality (e.g., with TR = 5 s and 6 PLDs, the total scan time = 100 minutes). While N = 20 is more practicable, our results suggest multi-PLD may not be able to reliably measure blood flow in white matter (1A).Conclusion
With multi-PLD ASL, the derived CBF varies with the choice of PLD (overestimated when the PLD range does not cover ATT) as well as SNR (overestimated along with greater variability when SNR is low). When the PLD is longer than ATT, single-PLD ASL provides better accuracy and precision as compared to multi-PLD ASL, for the same scan time. Therefore, it may be useful to combine both methods as follows. First, perform the multi-PLD method with a shortest possible time to derive ATT. Then, acquire additional averages for one of the PLDs (long but with adequate SNR) to derive a CBF map. At last, calibrate the CBF map with the ATT.Acknowledgements
This work was supported by Taiwan Ministry of Science and Technology (grants: 103-2420-H-002-006-MY2,104-2221-E-002-088, and 105-2314-B-002 -094 -MY3).References
1. Alsop DC., et al. Recommended implementation of arterial spin labeled perfusion MRI for clinical applications: A consensus of the ISMRM Perfusion Study Group and the European Consortium for ASL in dementia. Magn Reson Med 2015;73:102-116.
2. Zaharchuk G. Arterial spin labeling for acute stroke: Practical considerations. Transl Stroke Res 2012;3:228-235.
3. Wang J, et al. Arterial transit time imaging with flow encoding arterial spin tagging (FEAST). Magn Reson Med 2003;50:599-607.
4. Bokkers RP, et al. Arterial spin labeling perfusion MRI at multiple delay times: a correlative study with H(2)(15)O positron emission tomography in patients with symptomatic carotid artery occlusion. J Cereb Blood Flow Metab 2010;30:222-229.
5. Wu WC, et al. Quantification issues in arterial spin labeling perfusion magnetic resonance imaging. Top Magn Reson Imaging 2010;21:65-73.
Figures