3786
Towards robust QSM in cortical and sub-cortical regions of the human brain at 9.4T: influence of coil combination and masking strategies1Biomedical Magnetic Resonance, University Hospital Tübingen, Tübingen, Germany, 2High Field Magnetic Resonance, Max Planck Institute for Biological Cybernetics, Tübingen, Germany, 3High Field MR Centre, Medical University of Vienna, Vienna, Austria, 4Centro Uruguayo de Imagenología Molecular (CUDIM), Montevideo, Uruguay, 5Centre for Advanced Imaging, University of Queensland, Brisbane, Australia
Synopsis
Strong background signals leading to multiple phase wraps may hamper accurate quantification of magnetic tissue susceptibility (QSM) especially at high field strengths using long echo times to achieve a high spatial sampling. Here we show how different coil-combination, automated tissue masking and background removal techniques can be used to improve QSM quality. Performance was evaluated with regard to iron quantification in subcortical and cortical areas in the same subjects. We found a substantial improvement in accuracy and precision of QSM in high-field applications at long echo times through the use of ASPIRE and removal of areas with excessive phase evolution.
Introduction
The accuracy of local magnetic susceptibility maps (QSM) may be influenced by several pre-processing steps, like phase-unwrapping and background removal. Different masking procedures can be used to mitigate some of these effects by removing voxels which do not meet the Itoh condition1. Here we investigate how the quality of the QSM data in terms of accuracy and precision that could be achieved with multi-echo data at 9.4T is influenced by the procedures chosen for channel combination, tissue masking and background removal.Methods and Subjects
Subjects (19-56y N=21), volunteering to participate in the ERB approved study were scanned at 9.4T (Siemens Germany) with a 16ch transmit/31ch receive array2. The transmit field was mapped with AFI3 to verify that the nominal flip angle was achieved in sub-cortical areas. Mono-polar multi-echo-GRE-images (TE=6:6:30ms; TR=35ms; nominal FA=11°; voxel=400x400x800μm; GRAPPA=2; PF=6/8; BW=240Hz) were used for QSM and MP2RAGE images (TI1/TI2=900/3500ms; FA=4/6°; TRGRE=6ms; TR=8894ms, 0.8mm isotropic voxels) were used for tissue segmentation and DARTEL–based adaptation (SPM12) of the Harvard-Oxford region-of-interest atlases in MNI space brought to native space images. Three phase-data sets were generated based on different strategies for channel combination that all assured complete removal of phase singularities. Single-channel GRE-phase images of the third echo were phase offset corrected by direct subtraction of the phase difference between the first two echoes4 followed by channel combination using Roemer’s method (MPI) or by ASPIRE5, (ASP). A third data set was generated using the multifit approach including all 5 echoes in the MEDI toolbox6 (MED). Each data set was further processed using the STI-toolbox7. After Laplacian phase unwrapping background correction was performed using RESHARP (Tikhonov regularization: 10-12) or by V-SHARP (kernel size: 12 mm). Background correction was performed based on two different masks, either based on the signal in magnitude images only (MM); or after additionally removing all voxels with excessive phase wrapping exceeding the Itoh condition (PB). MM was obtained using BET in FSL, cut-off=0.1 followed by smoothing with a Gaussian filter with a FWHM 4 times the voxel-size. For PB, the absolute value of the Laplacian of the sign function was convolved with a sphere of size 5, and only voxels with values < 500 were retained. The QSM maps were generated by the iterative least squares approach. This pipeline was tested on the QSM challenge data8 set but including background correction which yielded RSME values of 80.5 (Tk-12, MM) 80.4 (Tk-12, PB), and 82.6 (SMV12, MM) and HFEN of 74.9, 75.0, and 74.8, respectively. QSM values in different Harvard-Oxford atlas regions were extracted from cortical voxels with a GM probability >98% while no such additional condition was used for the subcortical regions. All tabulated values were referenced to the QSM value in the CSF. Expected iron concentrations were calculated from Ref. 9. Transformation of the QSM images into MNI-space was performed prior to voxel-wise averaging across subjects and calculation of the standard deviation of the absolute QSM values.Results and Discussion
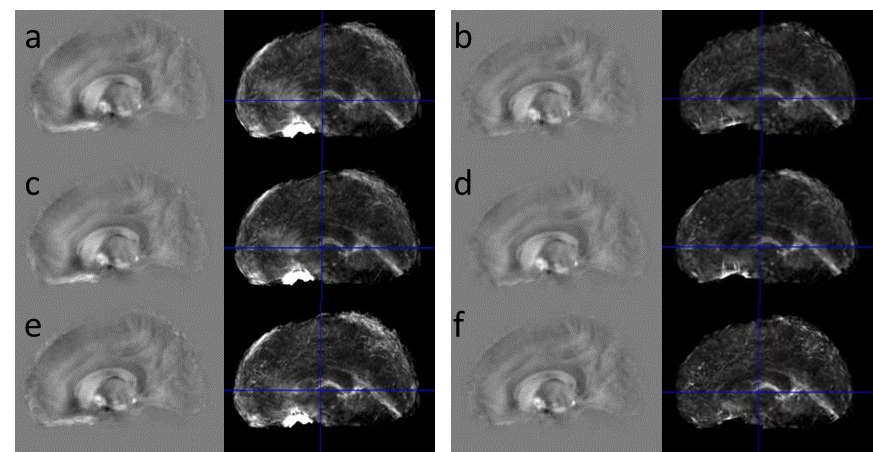
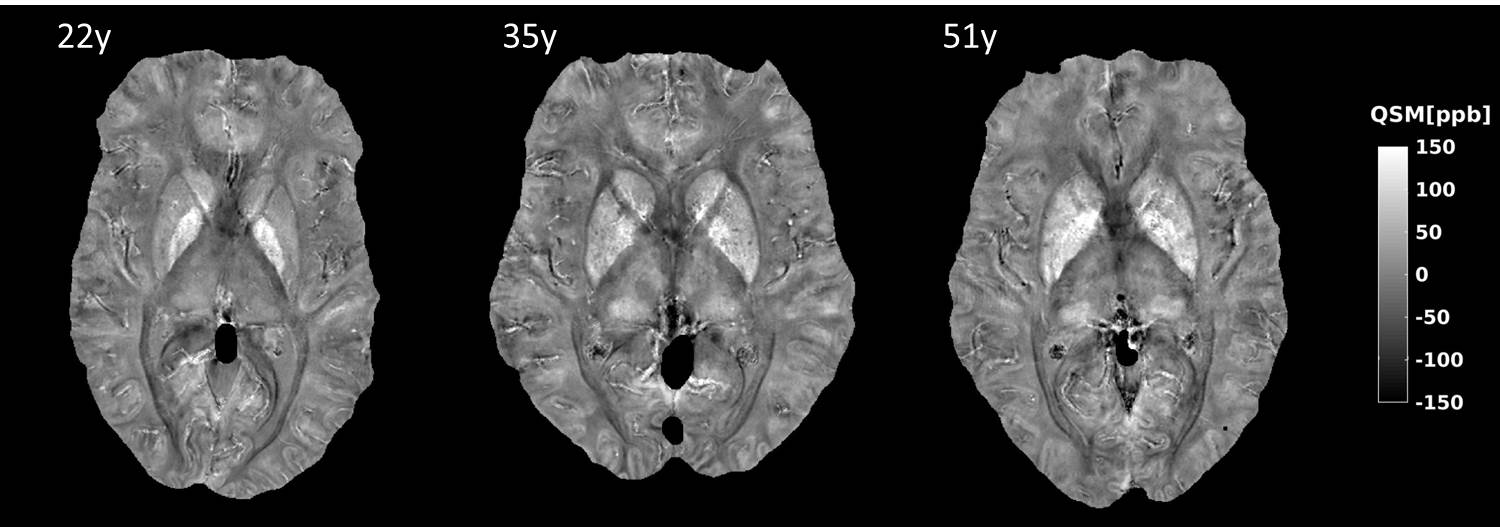
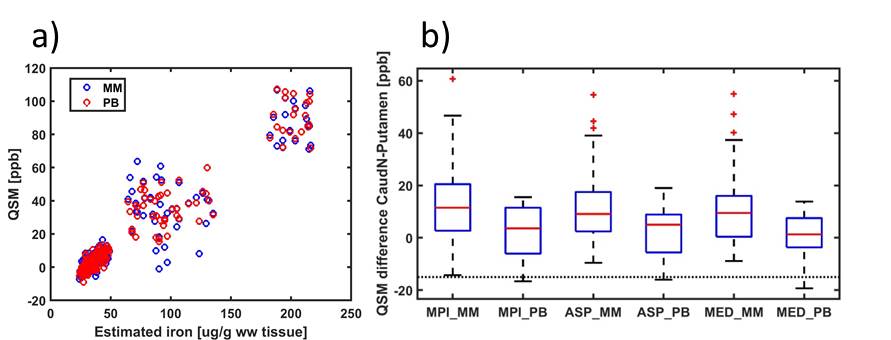
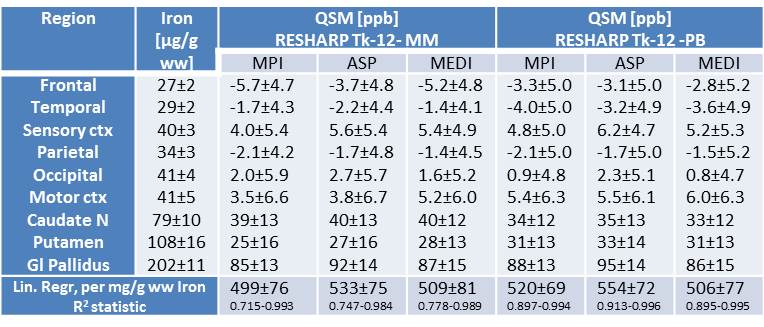
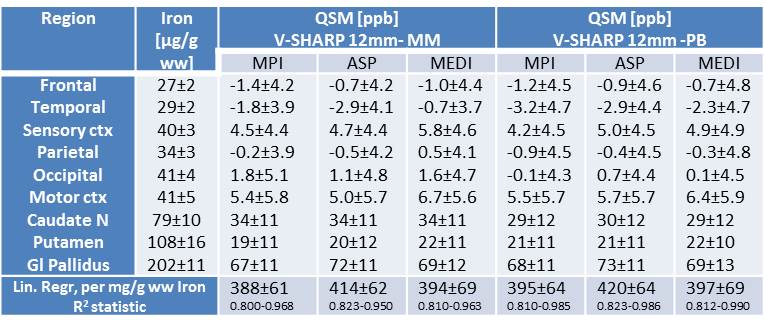
The strong field-gradients close to air-tissue borders hampered proper QSM calculation in the anterior brain, and lead to image artefacts and increased standard deviations across subjects (Fig 1 a, c, e), regardless of which channel combination that was used. Removal of voxels not meeting the Itoh condition improved the quality of the average QSM-maps (Fig 1 b, d, f). Background removal using V-SHARP was slightly less influenced by these voxels, but lead to smaller QSM differences across different brain regions (Table 2) than RESHARP (Table 1). The PB-mask yielded QSM values which were more similar across the three channel-combination techniques than MM. Clear age-related changes in the QSM –values be observed in subcortical areas reflecting the expected age-related increase in local iron concentrations (Fig 2). The relation between estimated iron and QSM values came close to previously reported values10 for the ASPIRE data, RESHARP and PB, yielding 0.554 ppb per µg/kg wet weight tissue. This increase in accuracy could be achieved by mitigating the inflated QSM values in the caudate nucleus (Fig 3). On the other hand, finer details inside the sub-cortical areas could be better distinguished using MEDI. Additional measurement using adequate phantoms are required to verify this observation.Conclusions
We found a substantial improvement in accuracy and precision of QSM in high-field applications at long echo times through the use of ASPIRE and removal of areas with excessive phase evolution.Acknowledgements
We gratefully acknowledge funding by the Max Planck Society, the ministry of Science, Research and the Arts of Baden-Württemberg, Germany (Az: 32-771-8-1504.12/1/1) and the EU-LAC health program #EULACH16/T01-0118
References
1. Itoh K, Appl Opt 1982; 21(14):2470
2. Shajan G, et al., Magn Reson Med 2014; 71(2):870-9.
3. Yarnykh, V.L., Magn Reson Med 2007; 57:192-200.
4. Schweser F et al., Proc Intl Soc Mag Reson Med 2011; 19:2657
5. Eckstein K et al., Magn Reson Med 2018; 79:2996
6. Liu T, Magn Reson Med 2013; 69:467‐476.
7. https://people.eecs.berkeley.edu/~chunlei.liu/software.html
8. Langkammer C et al., Magn Reson Med 2018; 79(3):1661-1673
9. Hallgren B, Sourander P. J, Neurochem 1958; 3(1):41-51
10. Duyn JH, Schenck J., NMR Biomed. 2017; 30(4):e3546
Figures