3785
Fast, high resolution QSM of the brainstem at 7T using super-resolution 2D EPI1High Field MR Centre, Department of Biomedical Imaging and Image-guided Therapy, Medical University of Vienna, Vienna, Austria, 2Christian Doppler Laboratory for Clinical Molecular MR Imaging, Vienna, Austria, 3Department of Neurology, Medical University of Graz, Graz, Austria, 4Centre for Advanced Imaging, University of Queensland, Queensland, Australia
Synopsis
2D EPI-based Quantitative Susceptibility Mapping offers a means to localise brainstem structures very quickly. However, this comes at the price of limited achievable slice thickness, restricting the precision of the localisation. In this work, we develop a fast super-resolution reconstruction method for complex MRI data, allowing the reconstruction of high resolution magnitude and phase images, and hence also high resolution susceptibility maps. We demonstrate that the reconstructed super-resolution 2D EPI images significantly improve the visibility of small structures allowing for improved localisation of the brainstem and other small structures such as veins in the generated susceptibility maps.
Introduction
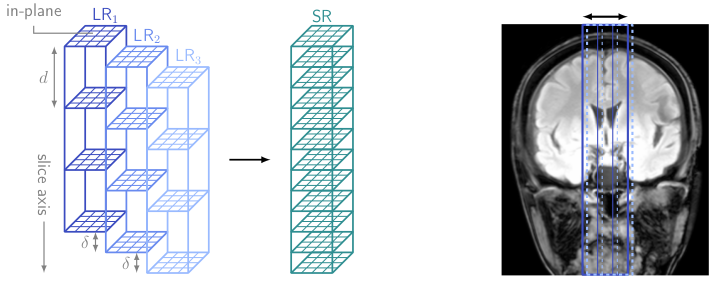
Echo-planar imaging (EPI) offers the possibility to perform Quantitative Susceptibility Mapping (QSM) rapidly [1], which can be important in clinical populations. 3D EPI is well suited for the acquisition of high resolution images with isotropic voxels for QSM [2,3], but 2D EPI can be faster if only a thin slab of slices are being imaged. We address such as case here, in the functional localisation of deep grey matter and brainstem nuclei as targets for deep brain stimulation in Parkinson’s disease. Combined with simultaneous multi-slice imaging, 2D EPI offers the possibility of additionally generating QSMs in a few seconds, but achieving thin slices with 2D imaging is problematic because of poor slice profile, cross-talk, and low signal to noise ratio (SNR). We propose the use of the super-resolution approach to improve the visibility of small structures in 2D EPI-based QSM. Geometric super-resolution (SR) methods acquire multiple low-resolution (LR) scans $$$y_k$$$, which are shifted in slice direction (see Fig. 1), in order to increase the through-plane resolution, while the in-plane resolution is unaffected. The acquisition is modelled by [4] $$y_k = \textbf{A}_kx + n_k,$$ with the acquisition matrix $$$\textbf{A}_k$$$, given by the product of a downsampling, blurring, and geometric transformation operator, the super-resolution image $$$x$$$, and noise $$$n_k$$$. The super-resolution image can be reconstructed by regularisation inversion [4] $$x = \text{argmin}_x \sum_{k=1}^N\|\textbf{A}_kx-y_k\|^2 + \lambda R(x),$$ with the regularisation function $$$R(x)$$$ and the regularisation parameter $$$\lambda$$$. Although super-resolution is well-known in image reconstruction and has been applied to Magnetic Resonance Imaging (MRI) [5,6], Diffusion Tensor Imaging [7], and functional MRI [8], it has not, to date, been used for QSM.Methods
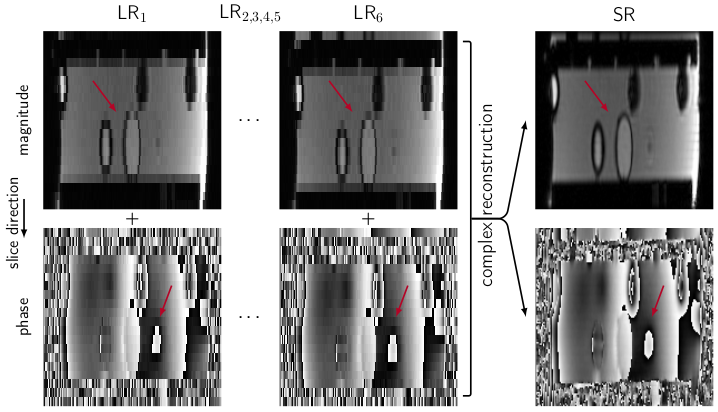
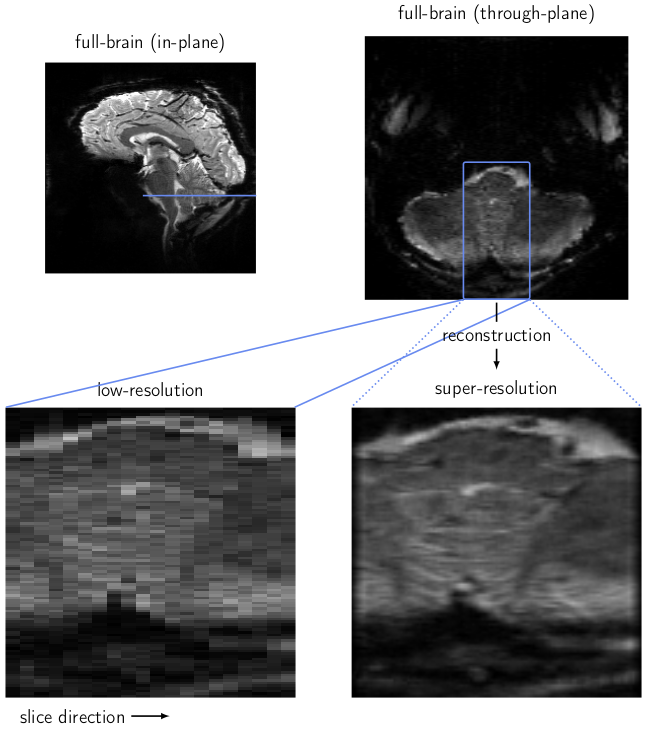
We applied the super-resolution reconstruction in MATLAB by solving Eq. (2) for the real and imaginary part of the combined magnitude and phase data independently, if not stated otherwise, and used Tikhonov regularisation [4]. For Quantitative Susceptibility Mapping, we used Laplacian phase unwrapping [9], PDF background field removal [10], and STAR-QSM [13] with the SEPIA toolbox [12].A NIST phantom [13] was measured using a 3T Siemens PRISMA scanner and a 64-channel head/neck coil. We acquired six multi-echo gradient-echo (MGE) scans shifted by 0.4mm, each scan consisting of 20 slices of 2.0mm thickness and 20% gap, acquired sagittally and interleaved, with a matrix size of 160x160, 200x200mm2 FoV, TE=[15,30]ms, TR=710ms, FA=50°, rBW=260Hz/pixel, parallel imaging acceleration R=3, PF encoding of 6/8, sinc-pulse, and a TBWP of 12. One volunteer was measured using a 7T Siemens Magnetom scanner and a 1TX/32RX-channel head coil. We acquired six echo-planar-imaging (EPI) scans shifted by 0.3mm, each scan consisting of 20 slices of 1.5mm thickness and 20% gap, sagittally and interleaved, with a matrix size of 208x208, 230x230mm2 FoV, TE/TR=22/1260ms, FA=58°, rBW=1414Hz/pixel, R=3, and PF=6/8. ASPIRE was used to combine phase images from the multi-channel coil [14].Results
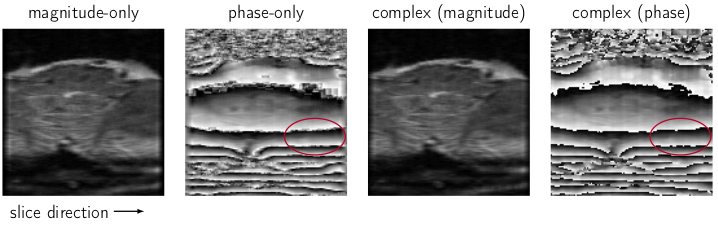
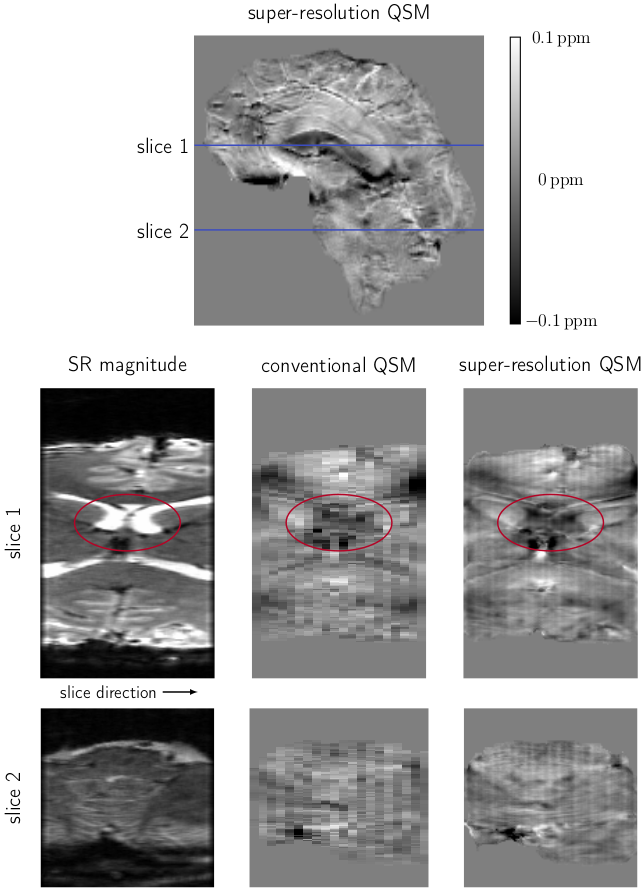
The low-resolution images of a NIST phantom acquired at 3T are compared with the super-resolution images in Fig. 2. A significant improvement in the resolution in slice-direction can be observed for both magnitude and phase data. The super-resolution result for a healthy volunteer at 7T is compared with a low-resolution image in Fig. 3, where the blue regions in the full-brain images indicate the positions of the low-resolution and super-resolution images. A significant improvement in the resolution in slice-direction can be identified for the super-resolution image.Different super-resolution reconstruction methods are compared in Fig. 4. The magnitude-only and phase-only reconstruction used only the magnitude or phase data respectively, whereas the complex reconstruction used both real and imaginary information, from which the magnitude and phase were extracted after SR reconstruction. For magnitude images, there was no difference between the magnitude-only and complex reconstruction. For phase, however, the complex super-resolution reconstruction overcame smoothing artefacts which were apparent in the phase-only reconstruction, especially in areas between phase wraps. The complex super-resolution reconstruction yielded good results for both magnitude and phase images, which were used to generate the QSMs shown in Fig. 5. Basal ganglia nuclei can be resolved in the super-resolution magnitude and QSM which are not apparent in low-resolution QSM. This indicates that QSM of small structures such as the brainstem is possible with the 2D EPI approaches used here, which benefit significantly from super-resolution reconstruction.Discussion and conclusion
In this study, we developed a fast, 2D EPI-based super-resolution reconstruction method in order to generate thin slices of a restricted region in a shorter time than would be possible with 3D approaches. Our method leads to an extensive increase in through-plane resolution both for magnitude and phase data. We demonstrate that QSM of small structures benefit significantly from super-resolution reconstruction, which has the potential to dramatically improve the localisation of brainstem structures for targeting with deep brain stimulation. In future work, we aim to reduce slice-to-slice discontinuities, which occur due to the excitation process. Other promising possibilities are to use the natural motion of the patient during fMRI [15] or shifted slab acquisitions in of dummy scans to generate super-resolution QSMs with no additional acquisition time.Acknowledgements
This study was funded by the Austrian Science Fund project FWF31452. SDR is supported by Marie Sklodowska-Curie Action MS-fMRI-QSM 794298.References
[1] H. Sun and A.H. Wilman, Quantitative Susceptibility Mapping Using Single-Shot Echo-Planar Imaging, Magn. Res. Med. 73, 5, 1932–1938 (2015).
[2] B.A. Poser, P.J. Koopmans, T. Witzel, L.L. Wald, M. Barth. Three dimensional echo-planar imaging at 7 Tesla. Neuroimage. 15;51(1):261-6. (2010)
[3] C. Langkammer, K. Bredies, B.A. Poser, M. Barth, G. Reishofer, A.P. Fan, B. Bilgic, F. Fazekas, C. Mainero, S. Ropele. Fast quantitative susceptibility mapping using 3D EPI and total generalized variation. Neuroimage. 111:622-30 (2015)
[4] E. Plenge et al., Super-resolution methods in MRI: Can they improve the trade-off between resolution, signal-to-noise ratio, and acquisition time?, Magn. Res. Med. 68, 6, 1983–1993 (2012).
[5] D. Fiat, Method of enhancing an MRI signal, US patent US 6,294,914 B1 (2001).
[6] H. Greenspan, G. Oz, N. Kiryati, and S. Peled, MRI inter-slice reconstruction using super-resolution, Magn. Res. Imag. 20, 437–446 (2002).
[7] S. Peled and Y. Yeshurun, Superresolution in MRI: Application to human white matter fiber tract visualization by diffusion tensor imaging, Magn. Res. Med. 45, 1, 29–35 (2001).
[8] R.R. Peeters et al., The use of super-resolution techniques to reduce slice thickness in functional MRI, Int. J. Imaging Syst. Technol. 14, 3, 131–138 (2004).
[9] M.A. Schofield and Y. Zhu, Fast phase unwrapping algorithm for interferometric applications, Opt. Lett. 28, 1194–1196 (2003).
[10] T. Liu et al., A novel background field removal method for MRI using projection onto dipole fields (PDF), NMR Biomed. 24, 1129–1136 (2011).
[11] H. Wei et al., Streaking artifact reduction for quantitative susceptibility mapping of sources with large dynamic range, NMR Biomed. 28, 1294–1303 (2015).
[12] K. Chan and J.P. Marques, SEPIA - SuscEptibility mapping PIpeline tool for phAse images, Proc. 27th Annual Meeting of the ISMRM, Montreal, Canada, (2019).
[13] K.E. Keenan et al., Comparison of T1 measurement using ISMRM/NIST system phantom, Proc. 24th Annual Meeting of the ISMRM, Singapore, (2016).
[14] K. Eckstein et al., Computationally Efficient Combination of Multi-channel Phase DataFrom Multi-echo Acquisitions (ASPIRE): Combination of Multi-Channel Phase Data fromMulti-Echo Acquisitions (ASPIRE), Magn. Res. Med. 79, 6, 2996–3006 (2018).
[15] S. Bollmann, S. Bollmann, A. Puckett, A. Janke, M. Barth. Non-linear Realignment Using Minimum Deformation Averaging for Single-subject fMRI at Ultra-high Field. Proc ISMRM #5338 (2017)
Figures