3784
Initial Experience with Inline Evaluation of Liver Stiffness using Magnetic Resonance Elastography in Hemochromatosis Patients1MR Application Predevelopment, Siemens Healthcare GmbH, Erlangen, Germany, 2Department of Radiology, CHRU Nancy, Brabois Adults Hospital, Vandoeuvre-lès-Nancy, France, 3Siemens Healthcare SAS, Saint Denis, France, 4IADI, U1254, INSERM, Université de Lorraine, CHRU de Nancy Brabois, Vandoeuvre-lès-Nancy, France
Synopsis
A simple prototype inline mean stiffness evaluation approach for MR Elastography based on anatomical liver segmentation and the confidence map was evaluated in 25 hemochromatosis patients, and compared with manual evaluation by two readers according to QIBA guidelines. Pairwise comparisons were found to be of similar statistics: mean±std relative difference -3.40±5.10% and -0.69±6.72% for reader1 vs. reader2 and manual (average of readers) vs. inline. The presented approach is promising given the particular patient cohort and limited stiffness range, but further evaluation is needed.
INTRODUCTION
Hemochromatosis (HC) is a common liver disease characterized by an overload of iron. Liver fibrosis is frequent in HC 1, and it is accompanied by a change in the in-vivo mechanical properties of the liver parenchyma, i.e. its stiffness. Magnetic resonance elastography (MRE) allows assessing liver stiffness non-invasively. MRE based on SE-EPI is preferable in HC patients due to its lower sensitivity to transverse relaxation effects compared with the original GRE sequence, which is sensitive to T2* 2.One practical difficulty with the MRE technique is the stiffness evaluation step which requires manual drawing of specified regions of interests (ROIs) while considering multiple criteria, e.g. the confidence parameter and wave quality, as described by the corresponding QIBA profile 3. This is a laborious and time-consuming task which can lead to measurement errors, especially if performed by inexperienced operators. A rapid automated inline evaluation would be desirable.
In this work, an existing anatomical liver segmentation based on 3D VIBE Dixon data was applied inline to SE-EPI MRE results and compared with manual stiffness evaluation in HC patients.
METHODS
PatientsAll patients included in this study were followed up for liver HC or suspicion of HC and/or liver fibrosis. All patients gave their informed consent for MRE examination. Twenty-five patients were included (age range from 24 to 84 years, 7 females).
MRI Acquisition and MRE
All scans were performed on a 1.5T clinical whole-body system (MAGNETOM Avantofit, Siemens Healthcare, Erlangen, Germany), equipped with the MRE option and the standard pneumatic active driver system (Resoundant, Rochester, MN, USA); the frequency of the vibration was 60Hz. A prototype multi-slice 2D SE-EPI-based MRE acquisition (13 s single breath-hold, 4 slices, 8mm ST; TR/TE=1200/45ms) with through-slice motion encoding was reconstructed with the regular inline inversion. Whole-liver segmentation was performed on T1-weighted high-resolution 3D VIBE 2-point Dixon images (18 s single breath-hold, 72 slices, 3mm ST; TR/TE1/TE2=6.68/2.39/4.77ms) 4. Liver iron concentration (LIC) was assessed using a multiple breath-hold GRE acquisition with 5 different TEs (2, 4, 9, 14 and 18ms) with constant TR/FA=120ms/20°. The signal-intensity-ratio method was applied to compute LIC 5.
Images Analysis
The liver segmentation result was projected onto the MRE series by an inline prototype implementation, similar to previously described fat fraction and R2* evaluation 4. Only stiffness values from samples inside the liver volume, which also had an associated MRE confidence value above the regular threshold of 95%, were counted towards the mean liver stiffness result, which was output as an additional image series with report information along with the other inline results (figure 1).
Mean liver stiffness values from this automated approach (LSaut) were recorded and compared to manual liver stiffness performed by 2 readers (LSr1 and LSr2) with more than 10 years experience as MR clinical technicians. Manual ROI selection was done using the magnitude images, stiffness maps and wave series according to the QIBA guidelines 3. The manual analysis was performed offline using a syngo.via VB20 workstation, and it took between 5 and 10 minutes per patient. Both readers were blinded to both the ROI choice/results of the other reader as well as to the automated inline results. The average manual liver stiffness from both readers was considered as the reference result to evaluate the automated inline method.
Statistics
Linear regression analysis and Bland-Altman plots were used to assess the agreement between results. Differences between the mean LS measured by the manual reference and the inline method were assessed using a paired t-test; p<0.05 was considered statistically significant.
RESULTS
One patient was excluded due to abnormal liver shape and contrast on the 3D VIBE images.The mean and standard deviation of the liver stiffness using the manual and the inline method were 2.25±0.40 kPa and 2.25±0.33 kPa, respectively. No significant difference was observed between the two (p=0.88).
The mean and standard deviation of the percentage errors were -2.43±8.2%, +0.96±6.10%, -3.40±5.10% and -0.69±6.72% for reader1/inline; reader2/inline; reader1/reader2 and manual/inline, respectively. Figures 2 and 3 show the linear regression and the Bland-Altman plots for inline and manual liver stiffness, respectively.
LIC was 80±42µmol/g (mean±SD), and a moderate significant correlation was found between LIC and absolute percentage error in LS manual/inline (R=0.5, p<0.05).
DISCUSSION and CONCLUSION
Good agreement was observed between the manual and automated inline liver stiffness values. The 95% confidence interval of the percentage errors between manual and inline values, as well as between the readers, was comparable to the 19% difference quoted by the QIBA profile to indicate a true change in stiffness. This is despite the fact that the automated procedure does not implement all analysis criteria prescribed by the QIBA profile, or those used by other (offline) tools like 6. This suggest that the presented approach may be valuable for assessing liver stiffness. However, the current study was confined to HC patients which had a limited range of liver stiffness. No further analysis was performed concerning the potential influence of changing confidence region size with scan parameters, or potential failures of the underlying liver segmentation with higher iron overload or liver abnormalities as in 4.In summary, the simple inline mean stiffness evaluation approach presented here is promising, but further evaluation is needed.
Acknowledgements
No acknowledgement found.References
Salgia RJ and Brown K. Diagnosis and Management of Hereditary Hemochromatosis. Clin Liver Dis. 2015; 19(1):187-98
Serai SD, Trout AT. Can MR elastography be used to measure liver stiffness in patients with iron overload? Abdom Radiol (NY). 2019; 44(1):104-109.
QIBA Profile: Magnetic Resonance Elastography of the Liver. Quantitative Imaging Biomarker Alliance. 2018; https://qibawiki.rsna.org/images/a/a5/MRE-QIBAProfile-2018-05-02-CONSENSUS.pdf
Stocker D, Bashir MR, Kannengiesser SAR, et al. Accuracy of Automated Liver Contouring, Fat Fraction, and R2* Measurement on Gradient Multiecho Magnetic Resonance Images. J Comput Assist Tomogr. 2018; 42(5):697-706.
Gandon Y., Olivié D., Guyader D, et al. Non-invasive assessment of hepatic iron stores by MRI. Lancet 2004; 363 (9406):357-362.
Dzyubak B, Venkatesh SK, Manduca A, et al. Automated liver elasticity calculation for MR elastography. J Magn Reson Imaging 2016; 43(5):1055-63.
Figures
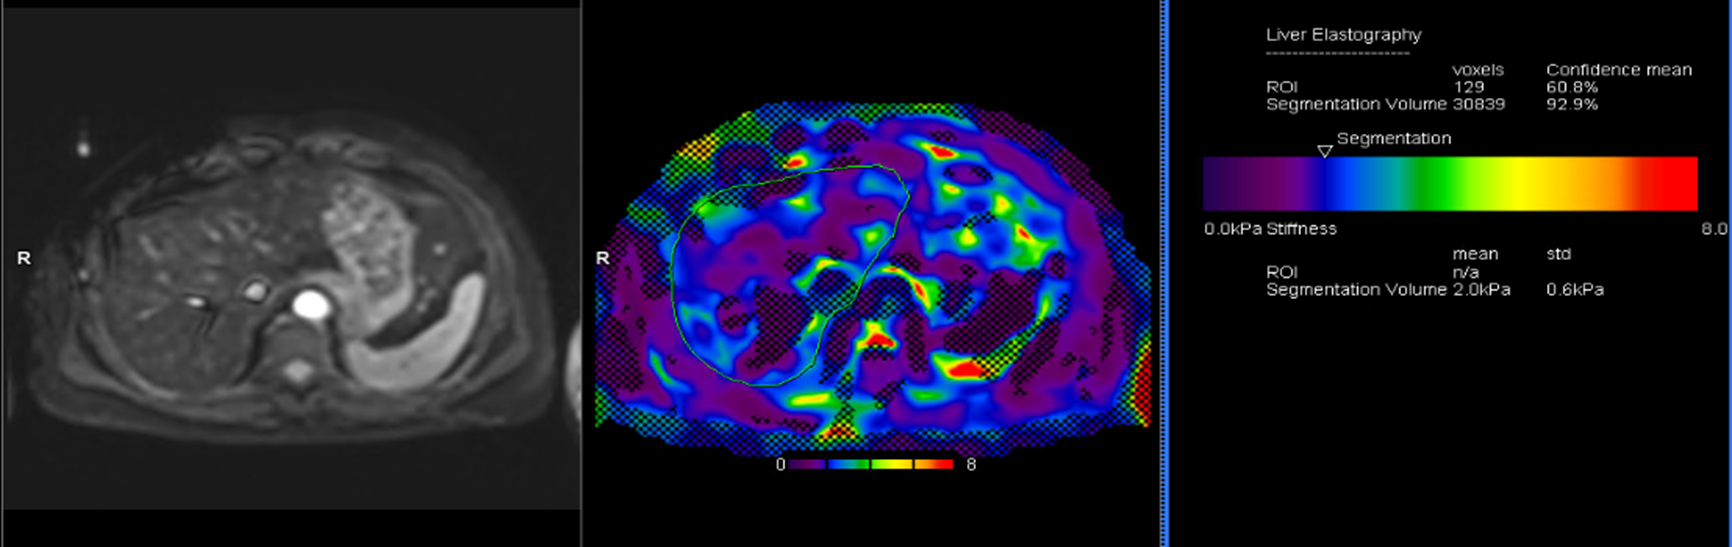
Figure 1: Liver magnetic resonance elastography of a hemochromatosis patient (LIC=127 µmol/g). Left: Magnitude image; center: stiffness map with the 95% confidence mask and the automated liver delineation; right: inline report with the mean liver stiffness result.
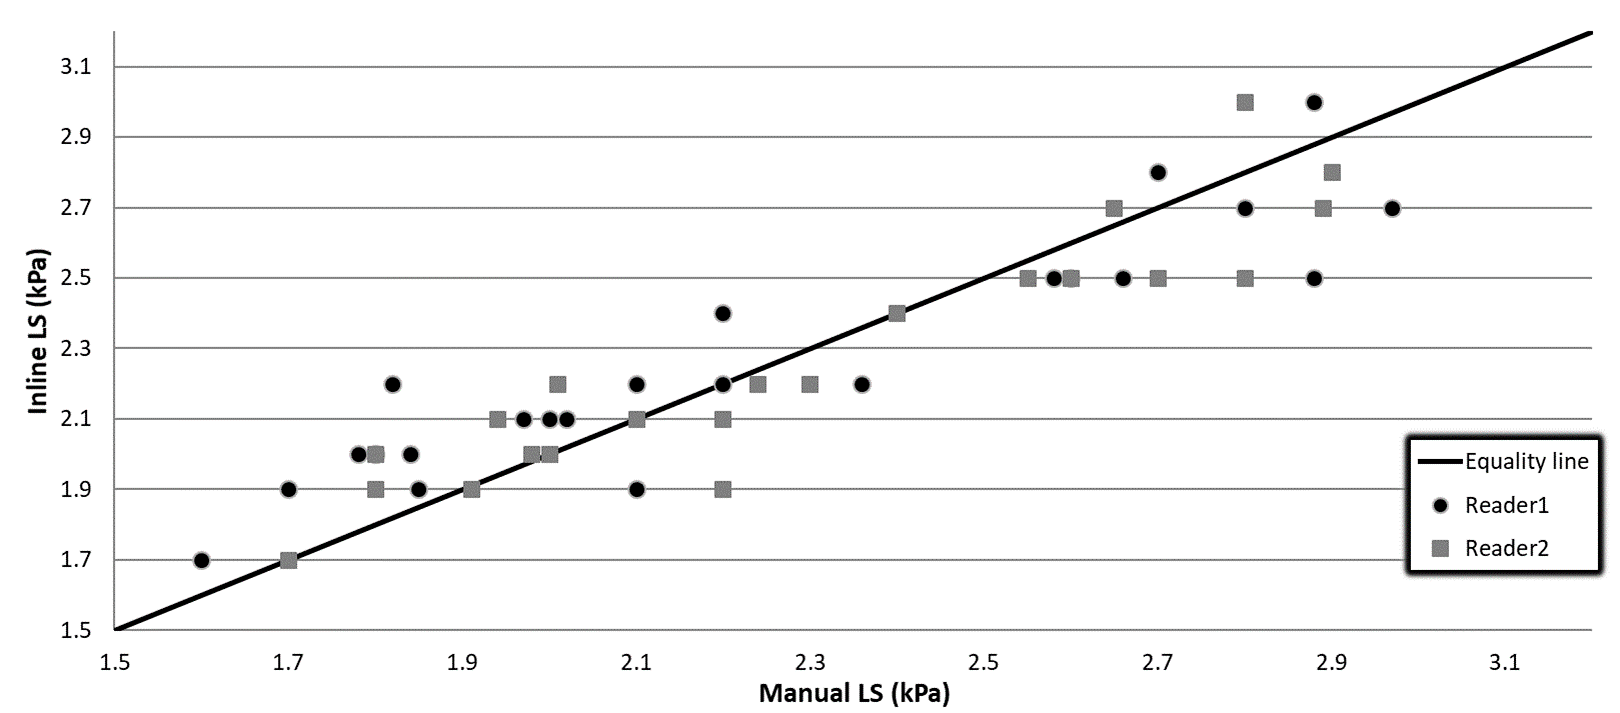
Figure 2: Inline versus manual liver stiffness (LS) measured by reader1 and reader2.
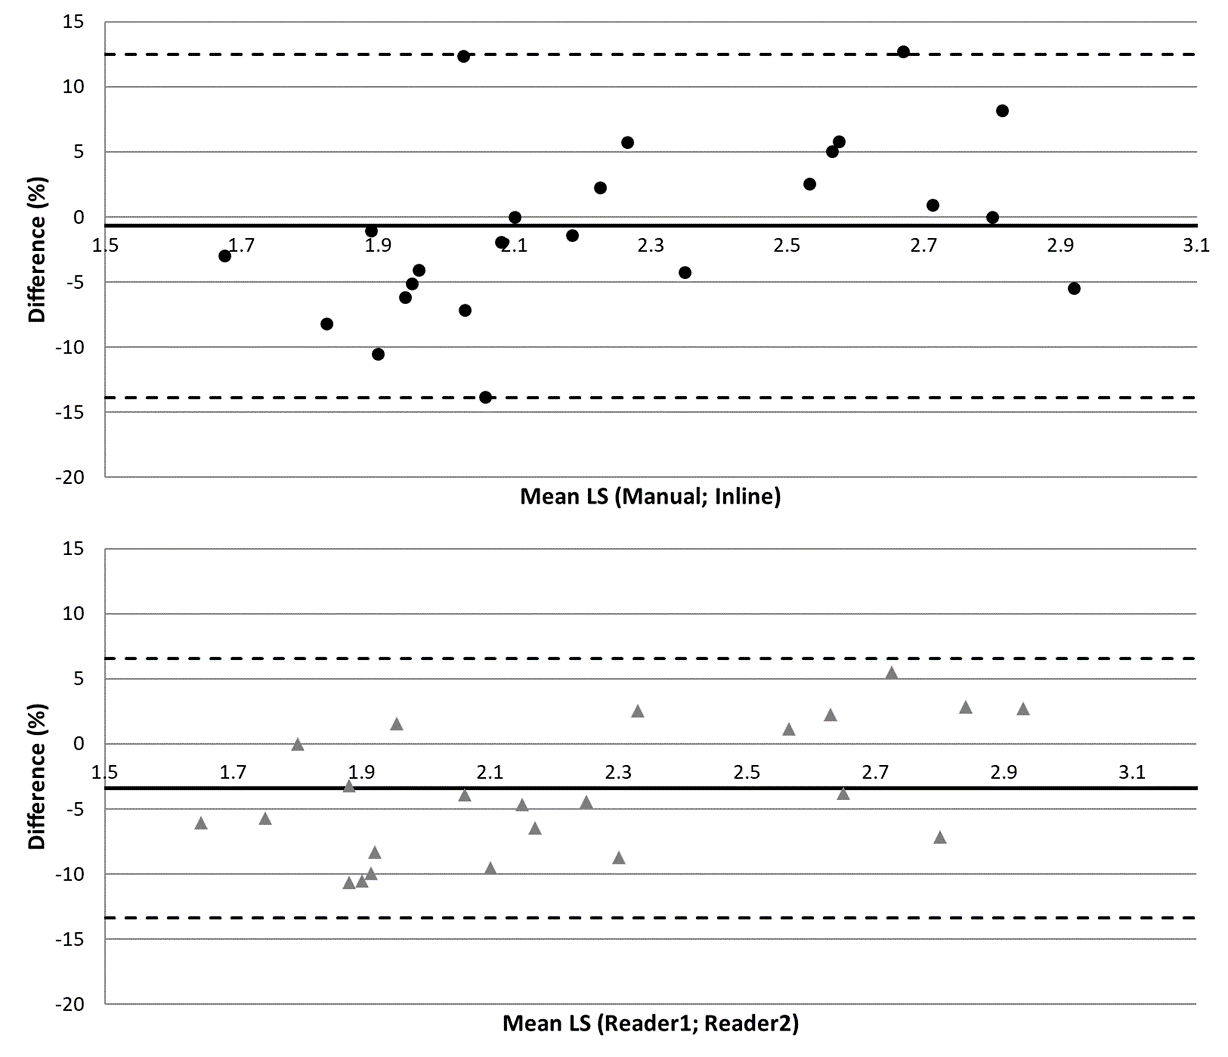
Figure 3: Bland-Altman plots comparing manual versus inline and reader1 versus reader2 liver stiffness (LS). The horizontal dashed lines are the 95% confidence interval. x-axis values are in kPa. On the y-axis, the percent (relative) difference calculation was based on (manual-inline) and (reader1-reader2), respectively.