3783
In Vivo Validation of MRS- and MRI-Based Fatty Acid Composition Quantification against Gas Chromatography in Adipose Tissue1Medical Radiation Physics, Department of Translational Medicine, Lund University, Malmö, Sweden, 2Medical Imaging and Physiology, Skåne University Hospital, Lund, Sweden, 3Department of Plastic and Reconstructive Surgery, Skåne University Hospital, Malmö, Sweden, 4Radiation Physics, Skåne University Hospital, Malmö, Sweden
Synopsis
Non-invasive estimation of the fatty acid composition of adipose tissue using MRI or MRS may be valuable in a number of disease scenarios. However, in vivo validation against an independent gold standard is still needed. In this work, we find that especially MRI estimation of the fraction of saturated fatty acids is strongly associated to gas chromatography analysis in the adipose tissue of lymphedema patients. The reliability of the estimated mono- and polyunsaturated fractions are reliant on the used signal model. Also MRS provided results which are associated to GC analysis, but with a lower agreement compared to MRI.
Introduction
Adipose tissue is increasingly being recognized as an active contributor to human health, and the fatty acid chemical composition (FAC) of the stored triglycerides have been linked to several disease scenarios1-3, including cancer4 and inflammatory conditions5.Estimation of the FAC has previously only been possible using gas chromatography (GC) analysis of biopsy samples. As non-invasive alternatives, MRS and, more recently, MRI have been suggested to assess the fractions of saturated (SFA), monounsaturated (MUFA) and polyunsaturated (PUFA) fatty acids via separation of the signal from the number of double bonds (CH=CH, ndb), the number of methylene-interrupted double bonds (=CH-CH2-CH=, nmidb), and the chain length (cl) of the triglyceride molecule.5-8 Given the amount of parameters to be estimated, it has been suggested that restricting the nmidb and cl to empirically derived functions of ndb may improve robustness, but the impact on estimation accuracy has not been systematically investigated.7
Validation of the MRI methods have mainly been performed using phantom experiments3,8-10 or against MRS8,10, but in vivo comparisons to an independent gold standard are important before they are generally used.
In this study, we aim to compare in vivo MRS and MRI estimations of the SFA, MUFA and PUFA against GC analysis of biopsy samples in human adipose tissue. In addition, free estimation of both ndb and nmidb was compared to a model with nmidb expressed as a function of ndb.
Methods
13 lymphedema patients scheduled for liposuction of their affected leg gave informed consent to participate in this ethical review board approved study. MR data and biopsy samples were acquired from the medial subcutaneous adipose tissue of both the edematous and healthy leg, 20 cm above the femoral condyles.MR experiment
Both legs were imaged simultaneously in a 3-T MR scanner (TIM Trio, Siemens Healthineers) using a 32-channel flex coil and an axial 2D multi-echo gradient echo sequence with the following parameters: 12 echoes, TE1/ΔTE = 1.31/1.56 ms, TR = 250 ms, flip angle = 30°, matrix = 128x128, FOV = 285x480x5 mm3, and bandwidth = 1953 Hz/pixel. Six STEAM spectra were collected from each thigh with TE = 20 ms-100 ms, TR = 2500 ms, TM = 10 ms, and voxel size = 12x12x20 mm3.
FAC reconstruction
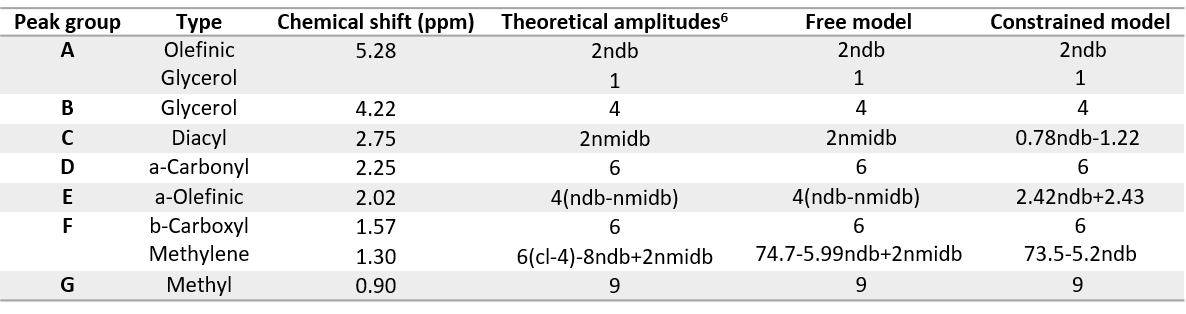
Two FAC reconstructions using iterative least-squares fitting to the complex data on a voxel-by-voxel basis9 were conducted with: 1) Free - Free estimation of both ndb and nmidb, and 2) Constrained - free estimation of ndb using the relation nmidb = 0.39ndb-0.61 based on the GC data. Both methods used the relation cl = 0.33ndb+16, also from the GC data (Table 1). For MRS, each fat peak A-G was modeled as Gaussian shapes using the jMRUI/AMARES software. From the T2-corrected amplitudes, ndb and nmidb were estimated using the same two models used for MRI.6 For both MRI and MRS, SFA, MUFA and PUFA were calculated from the estimated ndb and nmidb.
Biopsy
Following MRI, 20-mL biopsy samples were collected from the medial subcutaneous adipose tissue of both legs during liposuction surgery. Samples were sent for GC analysis of the relative abundance of each fatty acid (Eurofins Food and Feed Testing Sweden AB, Lidköping).
Statistics
A region-of-interest covering the medial part of the subcutaneous adipose tissue was defined in both legs, and mean FAC values were estimated from FAC maps. Agreement between methods was assessed using regression analysis and correlation using Pearson's r.
Results
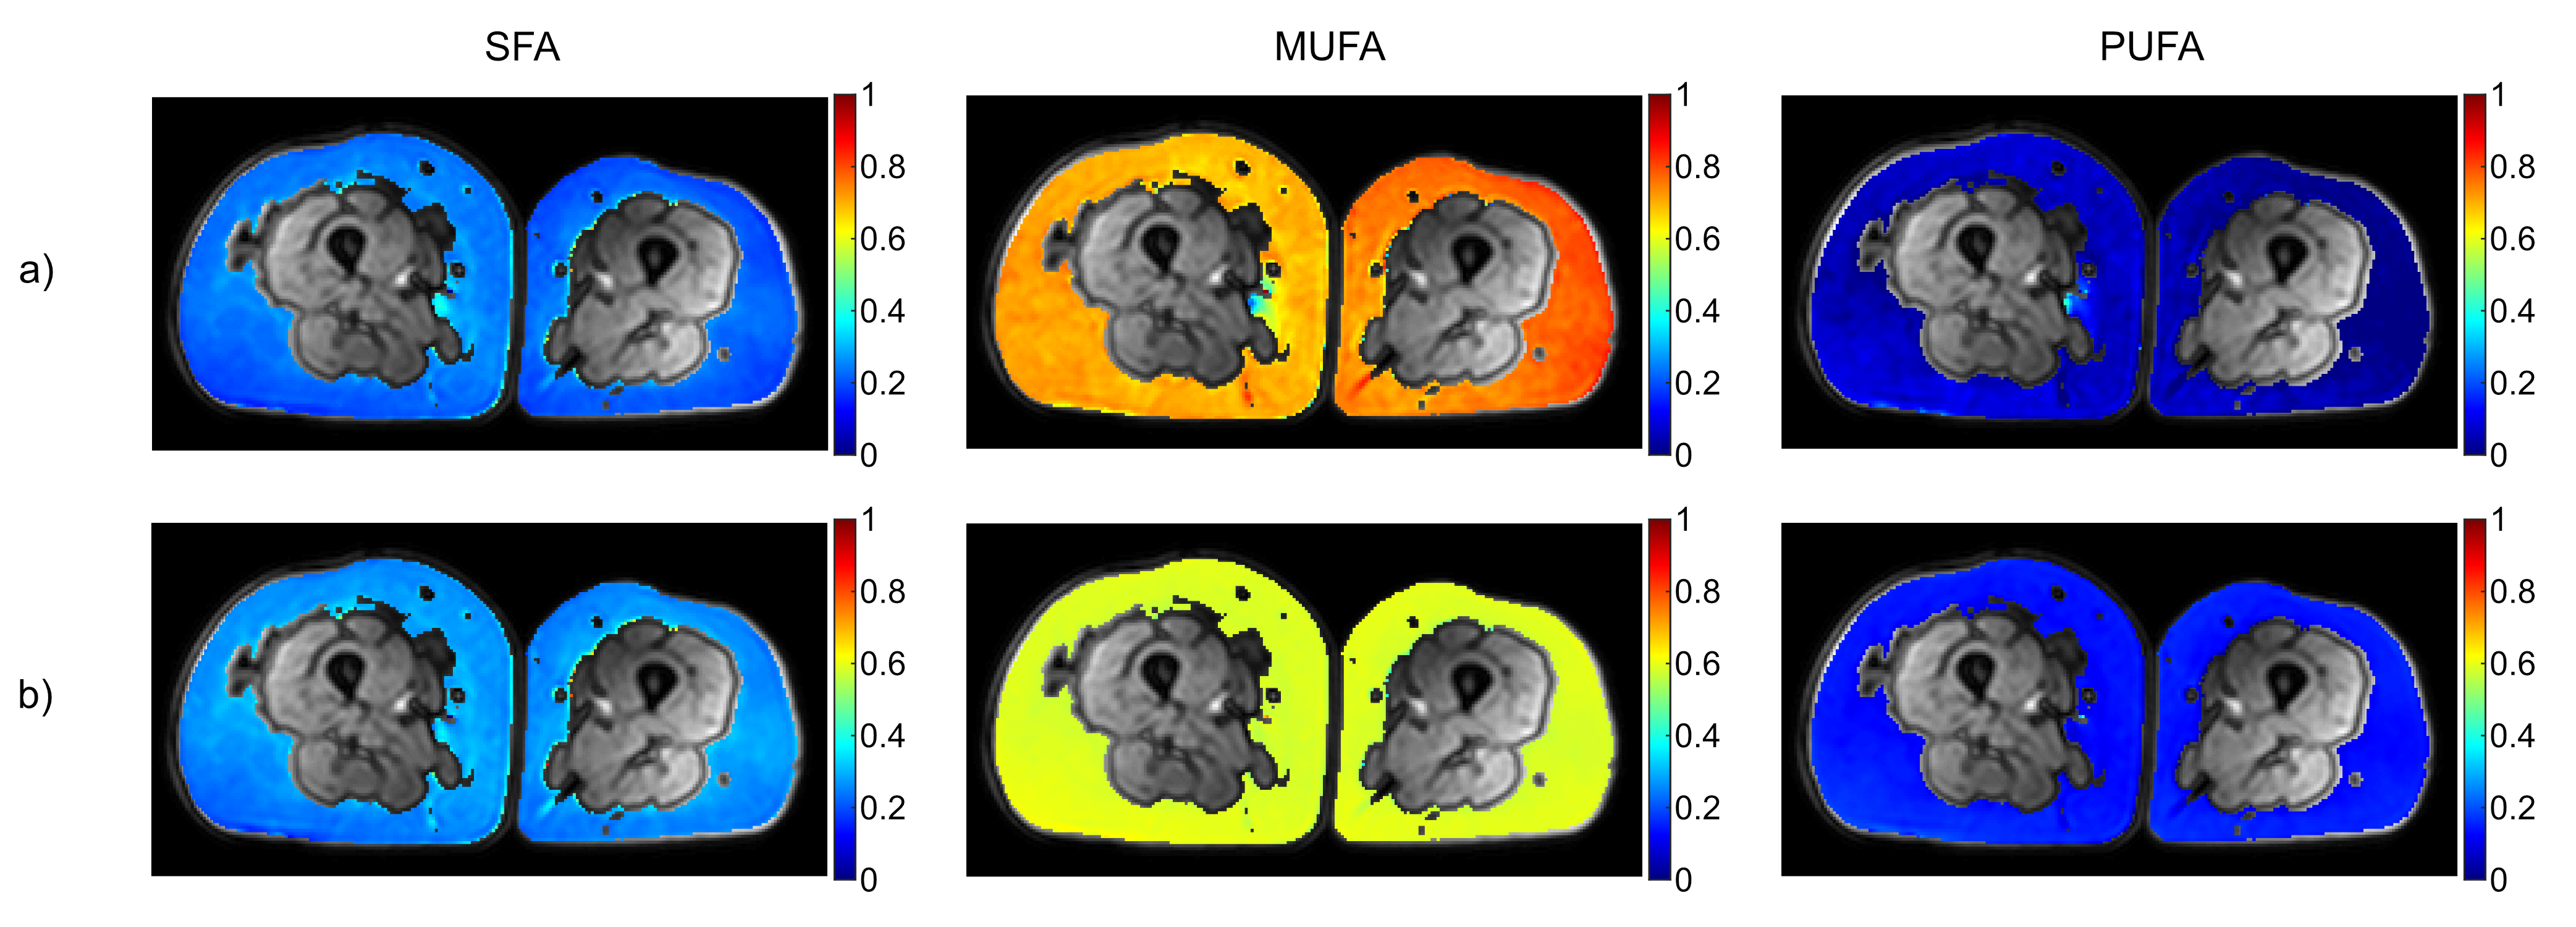
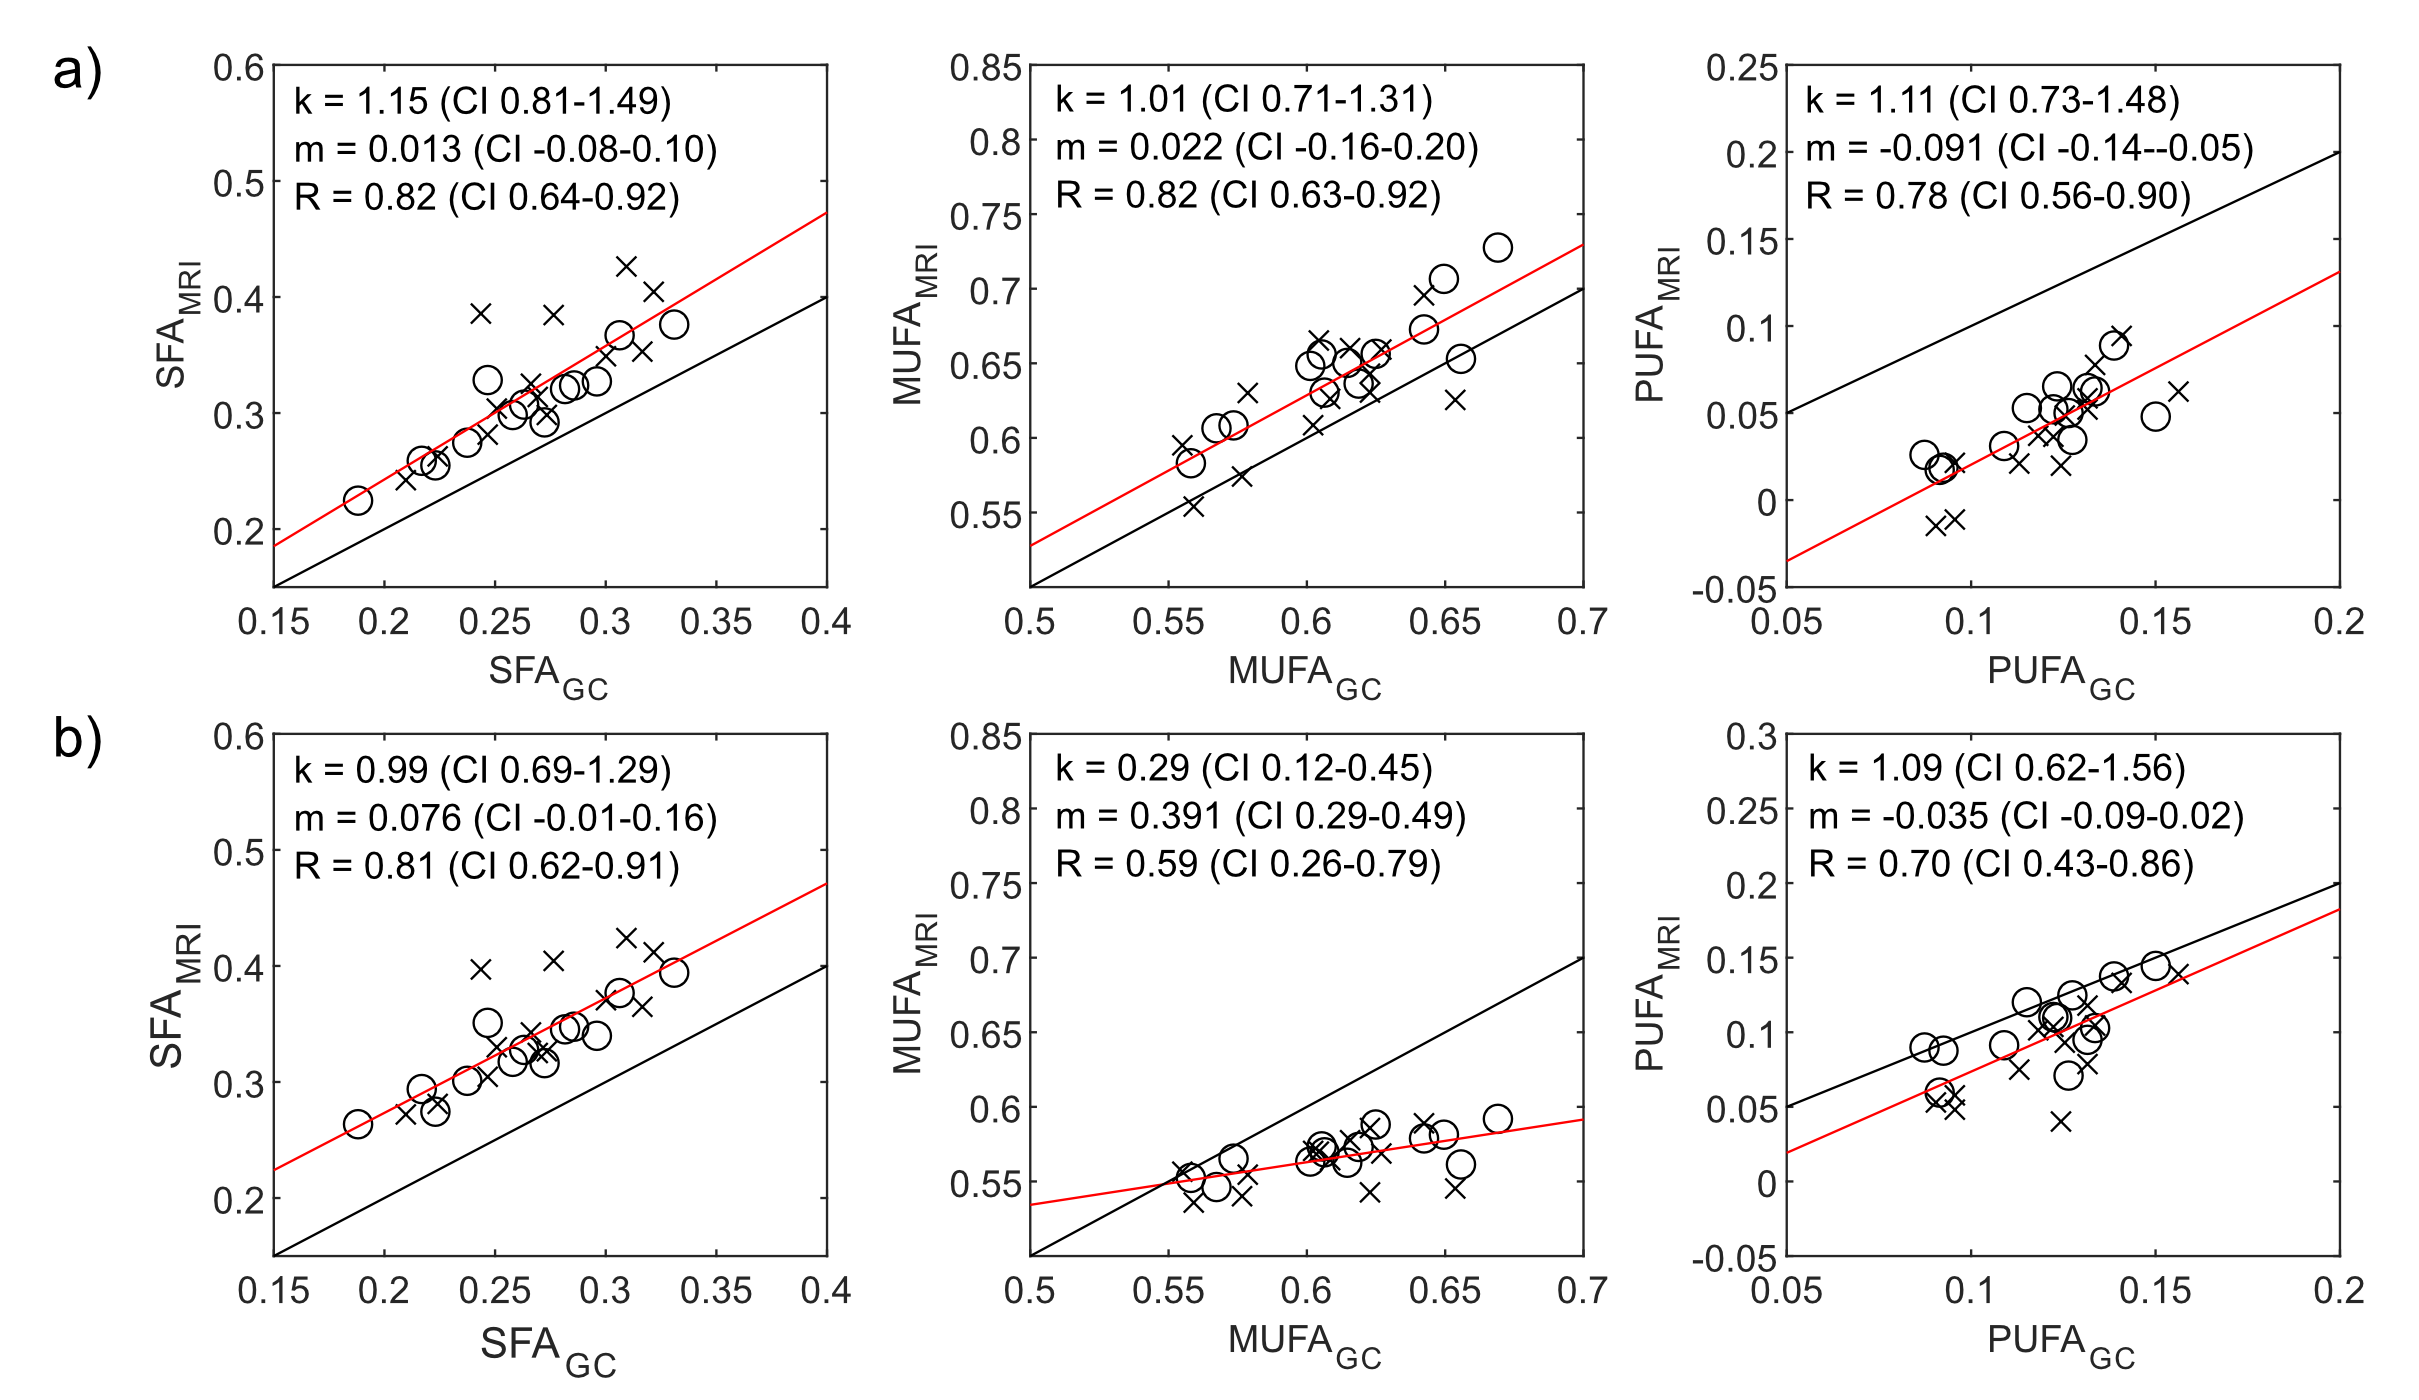
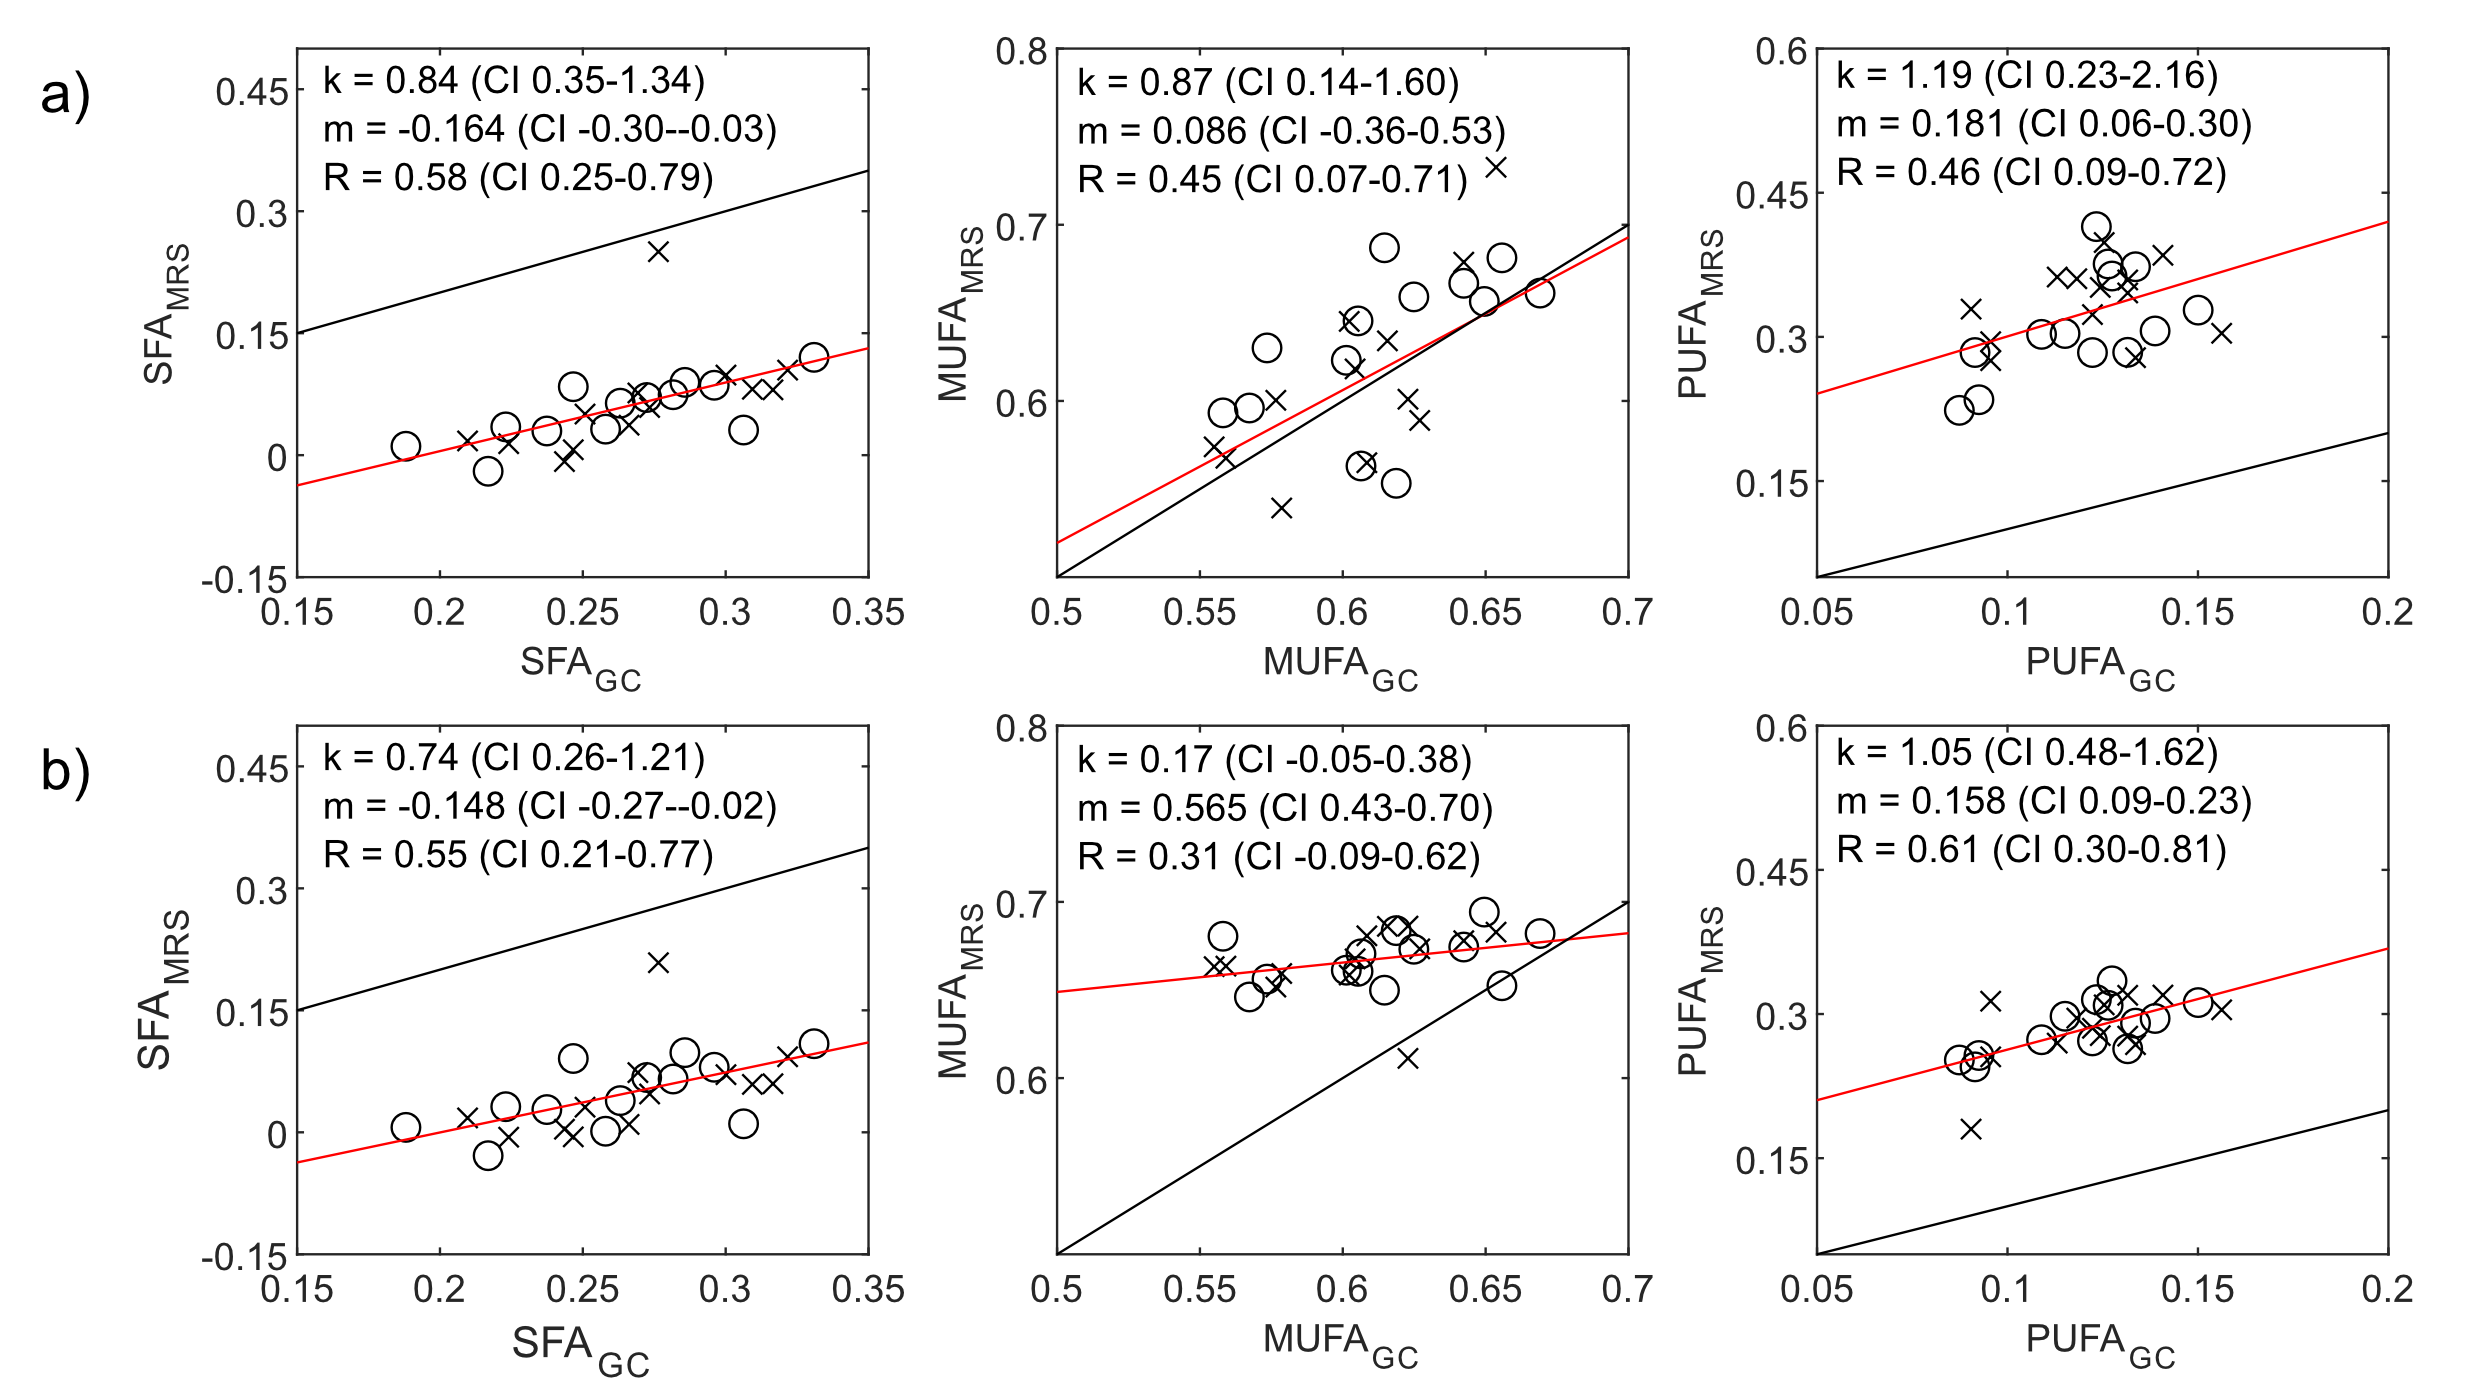
Robust estimation of the SFA and MUFA were achieved using both free and constrained estimation models (Figure 1). The mean±SD of SFA/MUFA/PUFA were 0.23/0.72/0.07 ± 0.039/0.061/0.059 and 0.27/0.59/0.14 ± 0.035/0.012/0.019, for free and restricted estimations, respectively. The much higher spatial variations of MUFA and PUFA using the free estimation is likely artefactual. A convincing correlation between MRI and GC estimation of the SFA using both models was detected, with a slight systematic overestimation using MRI (Figure 2). The correlation between methods was slightly lower for the MUFA and PUFA estimations. The PUFA agreement was better for constrained nmidb estimation compared to the free model, but a lower correlation and agreement was seen for the MUFA estimation. In comparison to MRI, MRS demonstrated lower agreement with GC with systematically biased results (Figure 3). Especially for SFA, an outlier results in lower correlation with GC compared to MRI, whereas remaining data points indicate a higher correlation.Discussion
In agreement with previous works, we found that introducing restrictions for nmidb and cl improves the robustness of the FAC estimation.3,7-8 Previously suggested constrained signal models have largely been based on vegetable oil data.7 In this work, we used linear models based on GC data from the investigated patients. A limitation of the study is that these models are based on a small sample and the validity of these models in a larger population and in other adipose tissues needs to be further investigated.Conclusion
We conclude that SFA may be reliably estimated by MRI using both free and restricted signal models. The robustness of the MUFA and PUFA estimations are substantially improved by the restricted signal model, albeit the agreement with GC depends on the choise of signal model. Nevertheless, the agreement with GC was better for MRI than for MRS.Acknowledgements
No acknowledgement found.References
1. Yeung DK, Griffith JF, Antonio GE, et al. Osteoporosis is associated with increased marrow fat content and decreased marrow fat unsaturation: a proton MR spectroscopy study. J Magn Reson Med. 2005;22(2):279-285.
2. Machann, J, Stefan N, Schabel C, et al. Fraction of unsaturated fatty acids in visceral adipose tissue (VAT) is lower in subjects with high total VAT volume - a combined 1 H MRS and volumetric MRI study in male subjects. NMR Biomed. 2013;26(2):232-236.
3. Leporq B, Lambert S.A, Ronot M, et al. Simultaneous MR quantification of hepatic fat content, fatty acid composition, transverse relaxation time and magnetic susceptibility for the diagnosis of non-alcoholic steatohepatitis. NMR Biomed. 2017;30(10):e3766
4. Thakur SB, Horvat JV, Hancu I, et al. Quantitative in vivo Proton MR Spectroscopic Assessment of Lipid Metabolism: Value for Breast Cancer Diagnosis and Prognosis. J Magn Reson Imaging 2019;50:239–249.
5. Pond CM. Adipose tissue and the immune system. Prostaglandins Leukot Essent Fatty Acids. 2005;73(1):17-30.
6. Hamilton G, Yokoo T, Bydder M, et al. In vivo characterization of the liver fat (1)H MR spectrum. NMR Biomed. 2011;24(7):784-790.
7. Bydder M, Girard O, Hamilton G. Mapping the double bonds in triglycerides. Magn Reson Imaging. 2011;29(8):1041-1046.
8. Berglund J, Ahlström H, and Kullberg J. Model-Based Mapping of Fat Unsaturation and Chain Length by Chemical Shift Imaging—Phantom Validation and In Vivo Feasibility. Magn Reson Med. 2012;68:1815–1827.
9. Peterson P and Månsson S. Simultaneous Quantification of Fat Content and Fatty Acid Composition Using MR Imaging. Magn Reson Med. 2013;69:688–697.
10. Schneider M, Janas G, Lugauer F, et al. Accurate fatty acid composition estimation of adipose tissue in the abdomen based on bipolar multi-echo MRI. Magn Reson Med. 2019;81(4):2330-2346.
Figures