3780
T1ρ could be a complementary tool for T2* in the assessment of rat liver iron overload
Qianfeng Wang1, Hong Xiao2, He Wang1, Xuchen Yu1, and Fuhua Yan2
1Institute of Science and Technology for Brain-Inspired Intelligence, Fudan University, Shanghai, China, 2Department of Radiology, Ruijin Hospital, Shanghai Jiao Tong University School of Medicine, Shanghai, China
1Institute of Science and Technology for Brain-Inspired Intelligence, Fudan University, Shanghai, China, 2Department of Radiology, Ruijin Hospital, Shanghai Jiao Tong University School of Medicine, Shanghai, China
Synopsis
In this study, spin-lock and 2D UTE pulse sequences were developed to quantify T1ρ and T2* of 32 rat livers with iron overload at 11.7T MR system. Moreover, T2 was also acquired to compare with T1ρ and T2*. Pearson correlation analyses (two-tailed) illustrated that T1ρ were significantly associated with T2 (all p ≤ 0.002), but insignificantly related with T2* (all p > 0.05). No significant association was found between T2 and T2*.
Introduction
A large body of studies have stated that T2* magnetic resonance imaging could quantify hepatic iron content. Despite the previous study reported that changes of T1ρ were highly linear with iron concentration and more sensitive than T2 1, but the association between T2* and T1ρ has not be fully investigated. This study aims to explore the correlation between T1ρ, T2*, and T2 relaxation times in the assessment of rat liver iron overload.Method
Iron dextran (at a dosage of 25-200 mg/kg) was injected into 32 male rats on day0 and day8 to increase liver iron stores. On day15, liver was removed and stored in 4% buffered paraformaldehyde for 24 hours before MRI.MRI was performed on an 11.7T Bruker Biospec with a Tx/Rx quadrature coil. spin-lock preparation with RARE readout and 2D multiecho UTE pulses were developed to quantify T1ρ and T2* 2,3. For T1ρ sequence, TR/TE=5000/9.2 ms, rarefactor=4, 9 different spin lock times (TSL=0, 10,20,30,40,50,60,70,80 ms) and 7 different spin lock frequencies (FSL=500,1000,1250,1500,2000,2500,3000 Hz). The sequence parameters used for acquisition of UTE images as follows: TR=100 ms, 20 different TE form 0.47-4.27 ms. For comparison with T1ρ and T2*, T2 was acquired using the Carr-Purcell-Meiboom-Gill (CPMG) sequence (TR/TE1=4000/6.5 ms, echo spacing 6.5 ms, 20 echoes). To guarantee the same in-plane and out-of-plane resolution for better comparability between the T1ρ, T2* and T2 sequences, all images were acquired with FOV=45×45 mm2, matrix=128×128, slice thickness=0.5 mm on a single slice.
To calculate T1ρ, T2* and T2, a regions of interest (ROI) was chosen as bigger as possible in the liver, avoiding all visible vessels. The ROIs were drawn using MRIcro software. The mean intensity within the ROI was evaluated for each image. In case of rapid signal decay, the data were truncated at the point where the mean intensity fell below about twice the noise level4. The mono-exponential fitting of the signal intensities algorithm at different TSL (or TE) was performed using Matlab (MathWorks, Natick, MA).
All statistical evaluations were performed using SPSS Statistics software (19.0, Chicago, IL, USA). A P< 0.05 was considered statistically significant.
Results and discussions
The mean value of T2 and T2* is 10.674 ms and 1.886 ms. Mean T1ρ displayed a dispersion, with increasing T1ρ toward higher spin lock (Fig. 1), which is in agreement with previous reports1,3. T1ρ values were significantly associated with T2 values (r = 0.518-0.788, all p ≤ 0.002, Fig. 2) but insignificantly associated with T2* values (all p > 0.05, Fig. 3). No significant correlation was found between T2 values and T2* values (r = 0.043, p = 0.814).By definition, T1ρ relaxation time is sensitive to the low-frequency motional processes around or at spin-lock frequency3. Previous study compared the detection sensitivity of quantitative T1ρ with T2 for detecting liver iron, revealing that spin-lock MR is a promising technique for the sensitive detection of iron1. The current study was limited at comparing the sensitivity between T2 and T1ρ. T2* relaxation embraces the intrinsic “true” T2 relaxation and additional relaxation because of magnetic inhomogeneities, and it sensitived to the spatial macromolecule architecture. The findings of insignificant association between T1ρ and T2*, indicating the underlying mechanism of T1ρ is more approach the T2 decay.
It wroth mentioned that there has weakly negative correlation between T1ρ and T2* at the spin-lock frequency of 1000-2500Hz, but it does not achieve to a significantly level. Further study could increase the size of sampling to investigate the association between T1ρ and T2*. liver biopsy could be performed for further analysis in the future study.
Conclusions
The current study represents a strong association between T1ρ and T2, but no significant correlation was found between T1ρ and T2* extends previous findings. The results indicated that T1ρ could be a complementary tool for T2* in the assessment of rat liver iron overload.Acknowledgements
This work was supported by Shanghai Municipal Science and Technology Major Project (No.2017SHZDZX01), Shanghai Municipal Science and Technology Major Project (No.2018SHZDZX01) and ZJLab, Shanghai Natural Science Foundation (No. 17ZR1401600) and the National Natural Science Foundation of China (No. 81971583). The authors thank Yinghua Zhu for helpful discussion.References
- Moonen RP, van der Tol P, Hectors SJ et al. Spin-lock MR enhances the detection sensitivity of superparamagnetic iron oxide particles. Magn Reson Med 2015;74(6):1740–9.
- Wang YX, Zhang Q, Li X et al. T1ρ magnetic resonance: basic physics principles and applications in knee and intervertebral disc imaging. Quant Imaging Med Surg 2015; 5(6):858-85.
- Storey P, Thompson AA, Carqueville CL et al. R2* imaging of transfusional iron burden at 3T and comparison with 1.5T. J Magn Reson Imaging 2007; 25(3): 540–7.
- Gudbjartsson H, Patz S. The Rician distribution of noisy MRI data. Magn Reson Med 1995; 34(6):910–4.
Figures
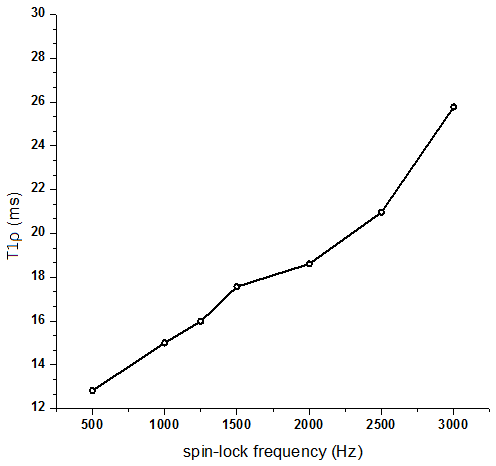
Figure 1, Mean T1ρ decreased with increasing spin-lock frequency
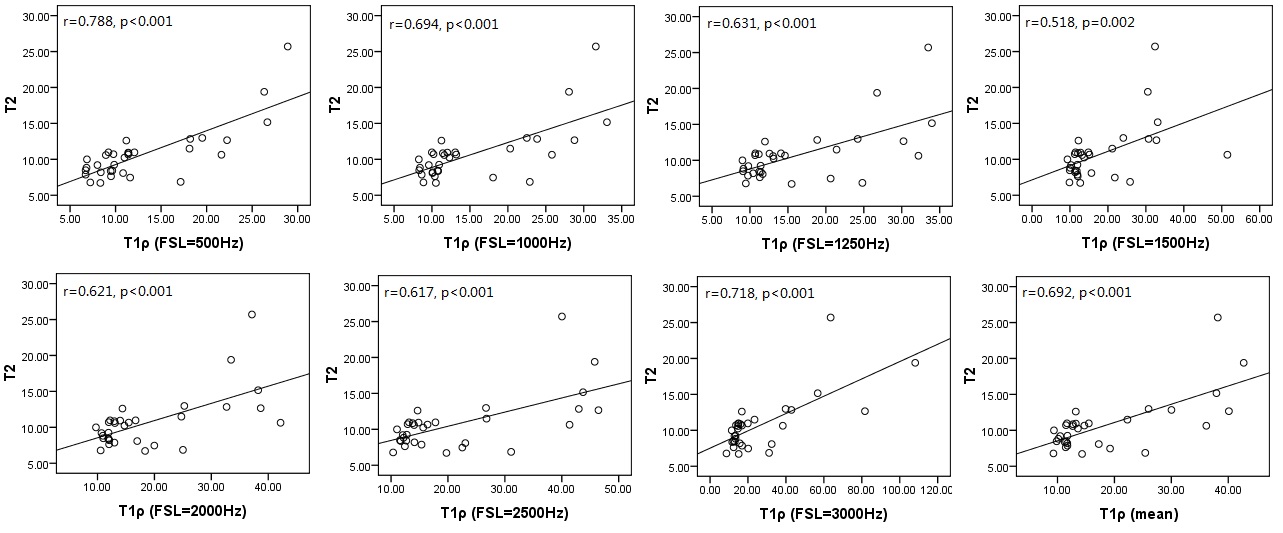
Figure 2, The association between T1ρ and T2 at different spin-lock frequency
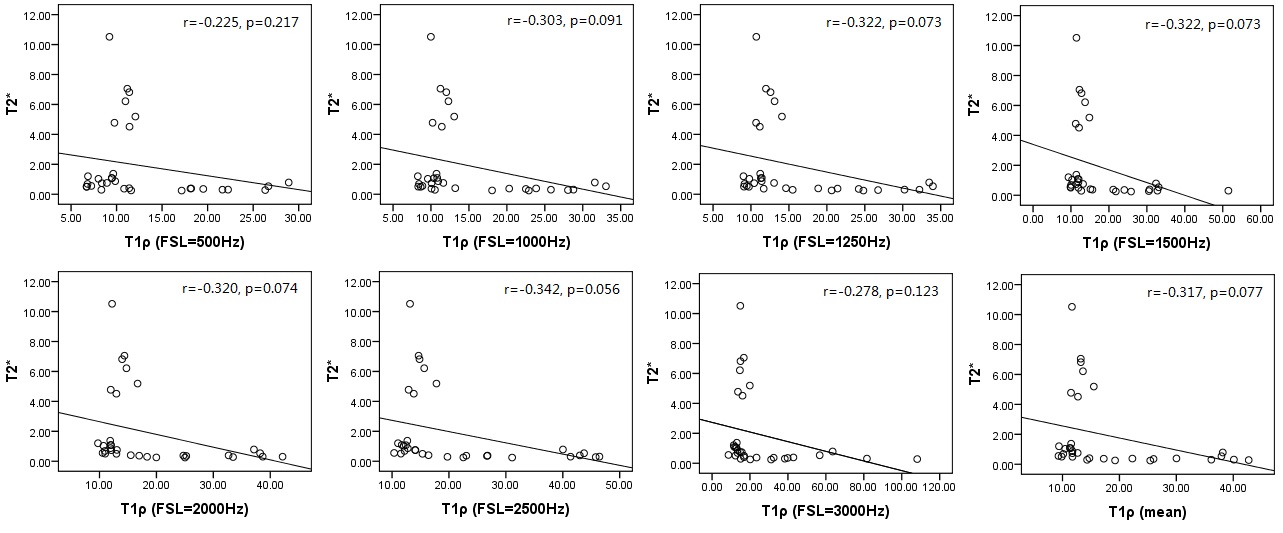
Figure 3, The association between T1ρ and T2* at different spin-lock frequency