3779
Accuracy assessment of high-spatial resolution whole-brain tracer-kinetic parameter maps generated using dual-temporal resolution DCE-MRI1Division of Informatics, Imaging and Data Sciences, The University of Manchester, Manchester, United Kingdom, 2Manchester Centre for Clinical Neurosciences, Salford Royal NHS Foundation Trust, Manchester, United Kingdom
Synopsis
Accurate, high-spatial resolution whole-brain pharmacokinetic maps are highly desirable in clinical neuro-oncology practice. A new dual-temporal resolution based kinetic mapping technique for this purpose, termed LEGATOS, was recently described and tested with in-vivo patient data. In this study, quantitative assessment of the accuracy of parameter estimates derived using the LEGATOS analysis procedure was evaluated through computer simulation. Structural similarity and percentage deviation of the “measured” values from the known “true” values were used for evaluation and demonstrated that the LEGATOS technique offered superior accuracy compared to the use of unreconstructed composite HT and HS curves alone.
INTRODUCTION
A novel dual-temporal resolution (DTR) based kinetic mapping method for providing pharmacokinetic maps with both high-spatial resolution and accurate kinetic parameter estimates, has been described recently1. This technique, known as LEGATOS (LEvel and rescale the Gadolinium contrast concentrations curves of high-temporal TO high-Spatial DCE-MRI), was tested through in-vivo application to patients with neurofibromatosis type-2 related vestibular schwannoma.1 Parametric maps derived using the LEGATOS method permitted superior visualization of small lesions and intra-tumoral heterogeneity compared to the use of high-temporal resolution data alone. Furthermore, compared to other high-spatial resolution approaches the LEGATOS method provided better separation of perfusion- and permeability-based changes in the tissue concentration-time course. Quantitative assessment of the accuracy of parameter estimates derived using this LEGATOS analysis procedure has not, however, been reported. The objective of the current study was to therefore use computer simulations to address this.METHODS
In-vivo data used as the base for computer simulationA patient with a sporadic vestibular schwannoma was imaged on a Philips 3T scanner using a dual temporal resolution, dual Injection dynamic contrast-enhanced (DICE) MRI2, in which a low dose (3mls), high-temporal resolution (1 s) sequence (LDHT) is followed by a full-dose high-spatial resolution acquisition (FDHS). The acquired dual-injection DTR data were then analyzed using the LEGATOS method.
Simulating a 4D FDHS tracer concentration volume
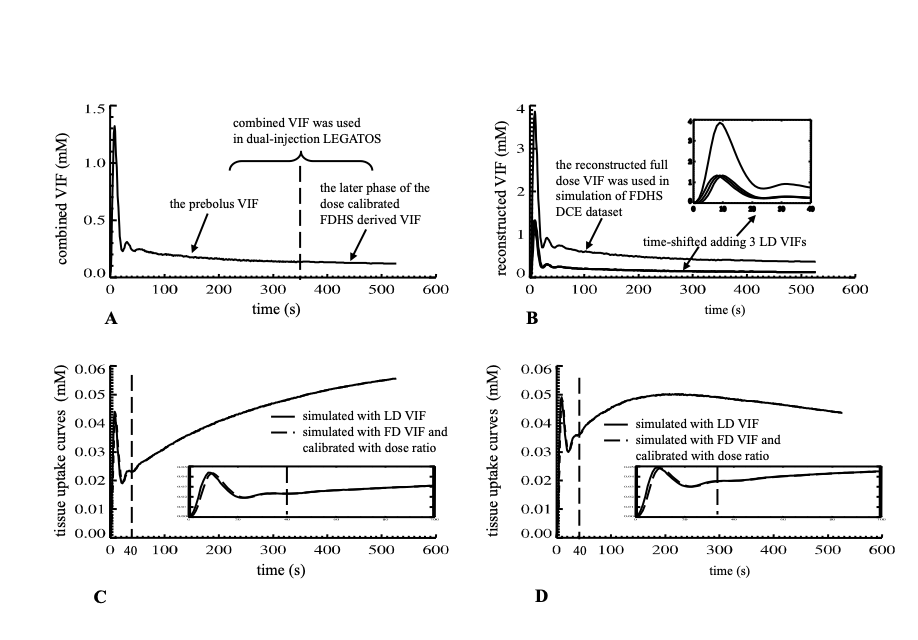
The derived high-spatial resolution parameter estimates, Ktrans, vp, ve, and bolus arrival time (t0), were used as the known “true” kinetic parameter values, for simulation of a 4D FDHS tracer concentration volume with the extended Tofts model (ETM).3 The LDHT-Cp(t) curve used for the in-vivo LEGATOS analysis was time-shifted and integrated to generate a full-dose high-temporal resolution AIF for use in the simulation.4,2 The simulated tissue voxel concentration-time curves were then resampled with a temporal interval of 10 s to resemble the in-vivo FDHS-DCE dataset.
Similarity assessment
Quantitative image comparisons between the in-vivo and the simulated 4D FDHS concentration volumes were performed using structural similarity (SSIM)5 and the mean SSIM index values between two images extracted from the same slice level within the two volumes were calculated.
Kinetic analysis of the simulated data
The simulated FDHS-DCE dataset was combined with the in-vivo LDHT dataset to construct an HTHS-merged 4D concentration volume. The tissue concentration-time curves of this 4D HTHS-merged concentration volume were then either directly fitted to the extended Tofts model (the HTHS-merged method), or underwent fitting with the LEGATOS approach, yielding ‘measured’ Ktrans, vp, ve and t0 maps.
Statistical analysis
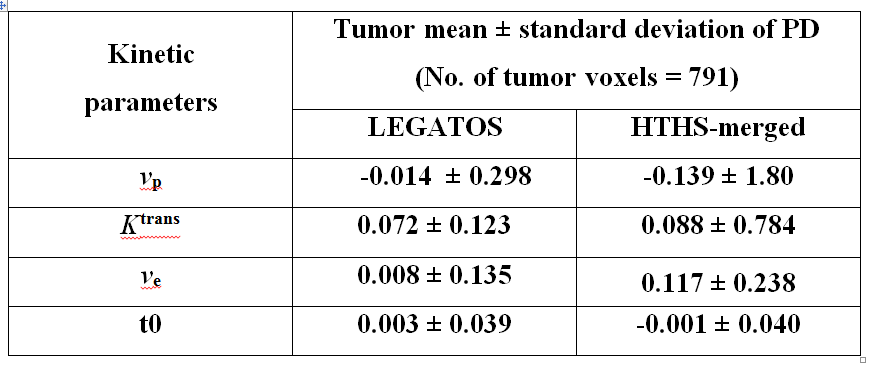
Pixel-by-pixel calculation of the percentage deviation (PD) within the 3D tumor region-of-interest for the patient was applied to each of the four parametric maps derived using either the LEGATOS or the HTHS-merged method. Tumor mean and standard deviation of the PD values were generated, and compared between the two analysis approaches.
RESULTS
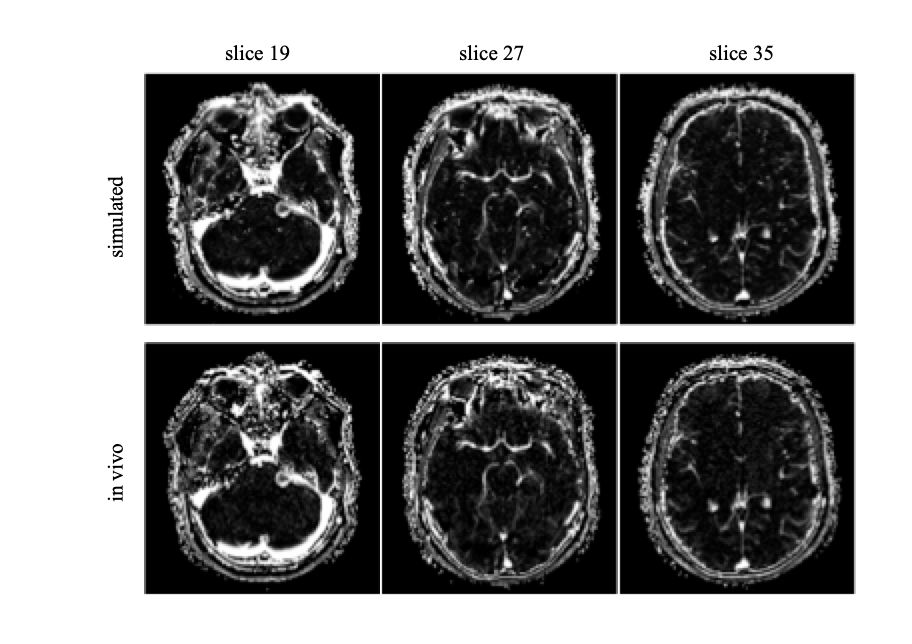
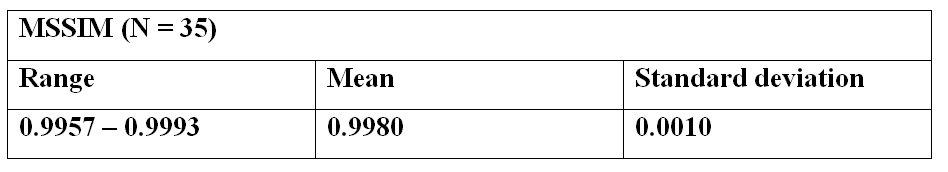
Figures 1a-1b illustrate derivation of the vascular input function (VIF) used for the simulation of a 4D FDHS tracer concentration volume. Figures 1c-1d demonstrate the strong similarity between the parenchymal tissue phase (t > 40 s) of the simulated low dose concentration curves and that of the full dose curves rescaled by the dose ratio. This supports our assumption that merging of the LDHT and FDHS 4D concentration volumes can be done through concatenation of the LDHT initial phase with the later phases of the dose-calibrated FDHS 4D concentration volume.Table 1 shows the mean SSIM index measured at 35 consecutive slices and demonstrates the great similarity between the in-vivo and the simulated 4D FDHS concentration volumes. This high similarity between the simulated and the acquired 4D FDHS images is also shown in Figure 2.
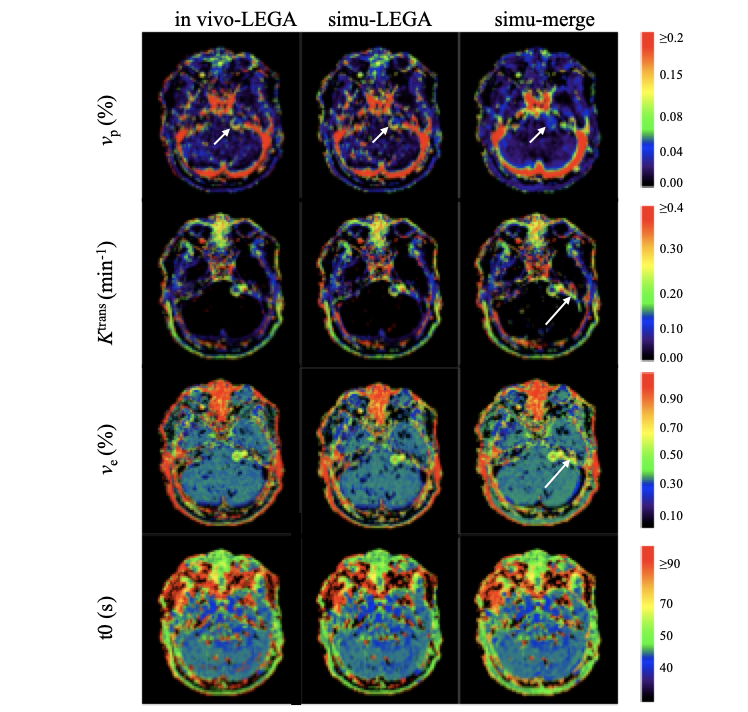
Figure 3 demonstrates that kinetic parameter maps derived from LEGATOS analysis of the computer-simulated data (middle column) displayed high similarity with kinetic maps derived from the LEGATOS analysis of the in-vivo dataset (left column). Whilst the LEGATOS derived vp maps demonstrate intratumoural vascular heterogeneity (small arrow), direct fitting of the simulated HTHS-merged data alone (right column), without prior LEGATOS reconstruction produced a vp map with comparatively less spatial detail. Furthermore, whilst the Ktrans and ve maps derived from the HTHS-merged method demonstrate vessel contamination adjacent to the vestibular schwannoma on the left side (long arrow), this contamination is not seen in the LEGATOS derived maps. Compared to the HTHS-merged method the LEGATOS method provided more accurate vp, ve and Ktrans estimates (Table 2).
DISCUSSION
Computer simulations evaluated quantitative accuracy of LEGATOS-derived parameter estimates. Concatenation of the HT and HS concentration volumes allows high temporal sampling of the beginning part of the tissue uptake curves, overcoming fitting errors induced by uncertainty in time alignment of the AIF and tissue uptake curves.6 The LEGATOS method, through subsequent rescaling the HT arterial phase curves within the HTHS-merged concentration volume, allows generating high-spatial resolution vp maps and further improving the accuracy of the parameter estimates.CONCLUSION
DCE-MRI derived microvascular kinetic parameters with both high-spatial resolution and comparable high-temporal acquisition accuracy are highly desirable in clinical practice. In this computer simulation study we have demonstrated that the LEGATOS technique permits the generation of accurate high-spatial resolution pharmacokinetic maps, outperforming the accuracy of kinetic parameters derived using composite HT and HS curves alone.Acknowledgements
No acknowledgement found.References
1. Li KL, Lewis D, Jackson A, et al. Improving quantification accuracy in whole brain high spatial resolution 3D kinetic mapping: Development of a novel dual temporal resolution DCE-MRI technique. In: Proceedings of the 27th Scientific Meeting of the International Society for Magnetic Resonance in Medicine, Montreal, Canada, 11-16 May 2019; 4409.
2. Li KL, Buonaccorsi G, Thompson G, et al. An improved coverage and spatial resolution--using dual injection dynamic contrast-enhanced (ICE-DICE) MRI: a novel dynamic contrast-enhanced technique for cerebral tumors. Magn Reson Med 2012; 68:452-462.
3. Tofts PS. Modeling tracer kinetics in dynamic Gd-DTPA MR imaging. J Magn Reson Imaging 1997;7(1):91-101.
4. Kostler H, Ritter C, Lipp M, Beer M, Hahn D, Sandstede J. Prebolus quantitative MR heart perfusion imaging. Magn Reson Med 2004;52: 296–299.
5. Wang Z, Bovik AC, Sheikh HR, Simoncelli EP. Image quality assessment: from error visibility to structural similarity. IEEE Trans Image Process 2004; 13:600-612.
6. Henderson E, Rutt BK, Lee TY. Temporal sampling requirements for the tracer kinetics modeling of breast disease. Magn Reson Imaging 1998;16(9):1057-1073.
Figures