3776
Evaluating Compressed SENSE acceleration for multi-parametric quantitative mapping of R1, R2*, PD, and MTsat with the hMRI toolbox
Ronja Berg1, Tobias Leutritz2, Stephan Kaczmarz1, Claus Zimmer1, Nikolaus Weiskopf2, and Christine Preibisch1
1School of Medicine, Department of Neuroradiology, Technical University of Munich, Munich, Germany, 2Max Planck Institute for Human Cognitive and Brain Sciences, Department of Neurophysics, Leipzig, Germany
1School of Medicine, Department of Neuroradiology, Technical University of Munich, Munich, Germany, 2Max Planck Institute for Human Cognitive and Brain Sciences, Department of Neurophysics, Leipzig, Germany
Synopsis
Measuring physical parameters quantitatively by magnetic resonance imaging (MRI) has a high value for diagnostic applications as it allows the detection of disease related systemic changes. However, quantitative MRI mapping methods increase the scan time significantly compared to conventional imaging. Therefore, we investigated the applicability of Compressed SENSE (CS) acceleration in a multi-parametric mapping protocol for R1, R2*, PD, and MTsat imaging. Our results demonstrate that absolute parameter values remained constant in all evaluated regions-of-interest when applying CS. Thus, CS can be used to almost halve the scan for R1, R2*, PD, and MTsat mapping without loss of fidelity.
Introduction
Quantitative magnetic resonance imaging (MRI) mapping techniques are highly promising for clinical applications,1-3 as they provide absolute values of physical quantities, which can function as biomarkers. Measured values are supposed to be sequence and hardware independent,1-2 and are, thus, highly promising for multi-center studies and for improving diagnosis and prediction of disease development. The variable flip angle approach1-2 in combination with multiple gradient echoes, can be used to map the longitudinal and transverse relaxation rates R1 (=1/T1) and R2* (=1/T2*) as well as the proton density (PD). With an additional magnetization transfer (MT) weighted sequence, MT saturation (MTsat) can be obtained as a supplementary parameter. However, such multi-parametric mapping increases the protocol duration significantly compared to conventional MRI. State-of-the-art acceleration techniques such as Compressed SENSE4 (CS) can speed up acquisition, but might compromise precision. Therefore, the aim of our study was to investigate the effect of CS acceleration on the fidelity of quantitative multi-parametric mapping of R1, R2*, PD, and MTsat.Methods
Five healthy subjects (aged 23-49) were scanned on a Philips 3T Ingenia Elition using a 32-channel head-coil. For multi-parametric mapping, three 3D multi-echo gradient-echo (FFE) acquisitions were acquired, two at TR=18ms with two different flip-angles α1=4° and α2=25° and the third for MT-weighted data with α=6° and TR=48ms. Common imaging parameters were voxel size 1x1x1mm³, 6 echoes, TE1/ΔTE = 2.4ms/2.4ms. B1-mapping was performed with voxel size 3.5x3.5x5mm³, α=60°, TE/TR1/TR2 = 2.3ms/30ms/150ms and the actual flip angle imaging (AFI) method.6 Three sets of measurements were performed in each subject, comparing standard SENSE (S=2.5) and two different compressed SENSE accelerations with factors CS=4 and CS=6. Total scan time for all three FFE sequences and B1-mapping was 20min for SENSE, 15:40min for CS=4, and 10:30min for CS=6. Quantitative parameter maps were computed using the histology MRI (hMRI) toolbox,3,7 correcting for B1-inhomogeneities and insufficient RF spoiling.1-2 Gray matter (GM) and white matter (WM) probability maps were obtained from segmentation of R1 data using SPM12.8 All voxels with a probability of at least 0.75 in the GM or WM probability map were included in the respective masks. Areas with major susceptibility artefacts in GM were excluded by the additional constraint R2*<40s-1 (T2*>25ms). Parameter maps from different accelerations were compared visually and quantitatively by extracting average parameter values from whole-brain GM, WM, and manually defined volumes-of-interest (VOI)s using Vinci4.439 (Fig.2).Results
For all subjects, parameter maps obtained with different accelerations appeared visually very comparable (Fig.1). At the group level, quantitative values of R1, R2*, PD, and MTsat in automatically segmented whole-brain GM and WM agreed well between scan protocols and depend neither on acceleration technique nor factor (Fig.3). Similar results were found by comparing average R1, R2*, PD, and MTsat in manually selected VOIs in GM and WM (Fig.4). Generally, the largest standard deviation of VOI-average parameter values across subjects, $$$σ$$$, was found with SENSE, especially in the manually drawn VOIs ($$$σ_{GM}$$$(R1) = 0.065s-1 (9%), $$$σ_{WM}$$$(R1) = 0.109s-1 (10%), $$$σ_{GM}$$$(R2*) = 2.14s-1 (10%), $$$σ_{WM}$$$(R2*) = 1.00s-1 (4%), $$$σ_{GM}$$$(PD) = 2.12p.u. (3%), $$$σ_{WM}$$$(PD) = 0.81p.u. (1%), $$$σ_{GM}$$$(MTsat) = 0.37p.u. (9%), $$$σ_{WM}$$$(MTsat) = 0.56p.u. (11%), Fig.4). CS reduced the VOI-average standard deviation across subjects, especially for R1 (51% in GM, 81% in WM) and MTsat values (60% in GM, 76% in WM) in whole-brain segmentation with CS=6 (Fig.3a,d) as well as in manually drawn VOIs (R1: 83% in GM and 75% in WM, MTsat: 60% in GM and 56% in WM, Fig.4a,d). Overall, the standard deviations of parameter values within whole-brain GM and WM segmentations were very similar across accelerations (Fig.5).Discussion
Generally, our quantitative MRI protocols with different accelerations reveal comparable, high quality parameter maps. The measured physical parameter values depend neither on acceleration technique (SENSE vs. CS) nor factor (CS=4 vs. CS=6) and agree well with the literature.1,10-13 Our results suggest that compressed SENSE, with acceleration factors up to at least 6, can be used for quantitative mapping of R1, R2*, PD, and MTsat without loss of fidelity but with the advantage of clearly reduced scan times. These findings are in good accordance with studies investigating the impact of CS acceleration on other imaging sequences.14-16 The larger inter-subject variability in data accelerated with standard SENSE, especially in the manually drawn VOIs (Fig.4), can be caused by differences in the placement and size of the elliptical volumes-of-interest as they were not co-registered across different accelerations. Another factor could be residual unfolding artifacts in standard SENSE, which are generally more prominent than the CS artifacts, which are distributed more incoherently over the whole image.4 This also matches the increased variations in the standard deviations with standard SENSE acceleration (Fig.5). However, a larger subject cohort is needed to further determine if SENSE and CS actually have different effects on the inter-subject variability and how such differences are caused.Conclusion
Compressed SENSE with acceleration factors up to at least 6, is highly promising for quantitative R1, R2*, PD, and MTsat parameter mapping within clinically feasible scan times. Differences in inter-subject variability require future comparisons with non-accelerated sequences in a larger subject cohort. Furthermore, we will investigate the CS fidelity for studying quantitative parameter changes of pathologies in diseases such as multiple sclerosis.Acknowledgements
This project was supported by the Friedrich-Ebert-Stiftung and has received funding from European Union’s Horizon 2020 research and innovation program and from the European Research Council under the Grant Agreement No 681094.References
- Preibisch, C., & Deichmann, R. (2009). Influence of RF spoiling on the stability and accuracy of T1 mapping based on spoiled FLASH with varying flip angles. Magnetic Resonance in Medicine: An Official Journal of the International Society for Magnetic Resonance in Medicine, 61(1), 125-135.
- Baudrexel, S., Nöth, U., Schüre, J. R., & Deichmann, R. (2018). T1 mapping with the variable flip angle technique: A simple correction for insufficient spoiling of transverse magnetization. Magnetic resonance in medicine, 79(6), 3082-3092.
- Weiskopf, N., Mohammadi, S., Lutti, A., & Callaghan, M. F. (2015). Advances in MRI-based computational neuroanatomy: from morphometry to in-vivo histology. Current opinion in neurology, 28(4), 313-322.
- Geerts-Ossevoort, L., de Weerdt, E., Duijndam, A., van IJperen, G., Peeters, H., Doneva, M., ... & Huang, A. (2018). Compressed SENSE speed done right. every time.
- Helms, G., Dathe, H., Kallenberg, K., & Dechent, P. (2008). High‐resolution maps of magnetization transfer with inherent correction for RF inhomogeneity and T1 relaxation obtained from 3D FLASH MRI. Magnetic Resonance in Medicine: An Official Journal of the International Society for Magnetic Resonance in Medicine, 60(6), 1396-1407.
- Yarnykh, V. L. (2007). Actual flip‐angle imaging in the pulsed steady state: a method for rapid three‐dimensional mapping of the transmitted radiofrequency field. Magnetic Resonance in Medicine: An Official Journal of the International Society for Magnetic Resonance in Medicine, 57(1), 192-200.
- Tabelow, K., Balteau, E., Ashburner, J., Callaghan, M. F., Draganski, B., Helms, G., ... & Reimer, E. (2019). hMRI–A toolbox for quantitative MRI in neuroscience and clinical research. Neuroimage, 194, 191-210.
- Statistical Parametric Mapping software: www.fil.ion.ucl.ac.uk/spm
- Volume Imaging in Neurological Research Co-Registration and ROIs Included software: http://vinci.sf.mpg.de
- Weiskopf, N., Suckling, J., Williams, G., Correia, M. M., Inkster, B., Tait, R., ... & Lutti, A. (2013). Quantitative multi-parameter mapping of R1, PD*, MT, and R2* at 3T: a multi-center validation. Frontiers in neuroscience, 7, 95.
- Wright, P. J., Mougin, O. E., Totman, J. J., Peters, A. M., Brookes, M. J., Coxon, R., ... & Gowland, P. A. (2008). Water proton T 1 measurements in brain tissue at 7, 3, and 1.5 T using IR-EPI, IR-TSE, and MPRAGE: results and optimization. Magnetic Resonance Materials in Physics, Biology and Medicine, 21(1-2), 121.
- Boto, J., Askin, N. C., Regnaud, A., Kober, T., Gkinis, G., Lazeyras, F., ... & Vargas, M. I. (2019). Cerebral Gray and White Matter Involvement in Anorexia Nervosa Evaluated by T1, T2, and T2* Mapping. Journal of neuroimaging, 29(5), 598-604.
- Tofts, P. S. (2003). PD: proton density of tissue water. Quantitative MRI of the Brain: Measuring Changes Caused by Disease. Wiley & Sons, Chichester, UK, 85-110.
- Vranic, J. E., Cross, N. M., Wang, Y., Hippe, D. S., de Weerdt, E., & Mossa-Basha, M. (2019). Compressed Sensing–Sensitivity Encoding (CS-SENSE) Accelerated Brain Imaging: Reduced Scan Time without Reduced Image Quality. American Journal of Neuroradiology, 40(1), 92-98.
- Eichinger, P., Hock, A., Schön, S., Preibisch, C., Kirschke, J. S., Mühlau, M., ... & Wiestler, B. (2019). Acceleration of double inversion recovery sequences in multiple sclerosis with compressed sensing. Investigative radiology, 54(6), 319-324.
- Nam, J. G., Lee, J. M., Lee, S. M., Kang, H. J., Lee, E. S., Hur, B. Y., ... & Doneva, M. (2019). High Acceleration Three-Dimensional T1-Weighted Dual Echo Dixon Hepatobiliary Phase Imaging Using Compressed Sensing-Sensitivity Encoding: Comparison of Image Quality and Solid Lesion Detectability with the Standard T1-Weighted Sequence. Korean journal of radiology, 20(3), 438-448.
Figures
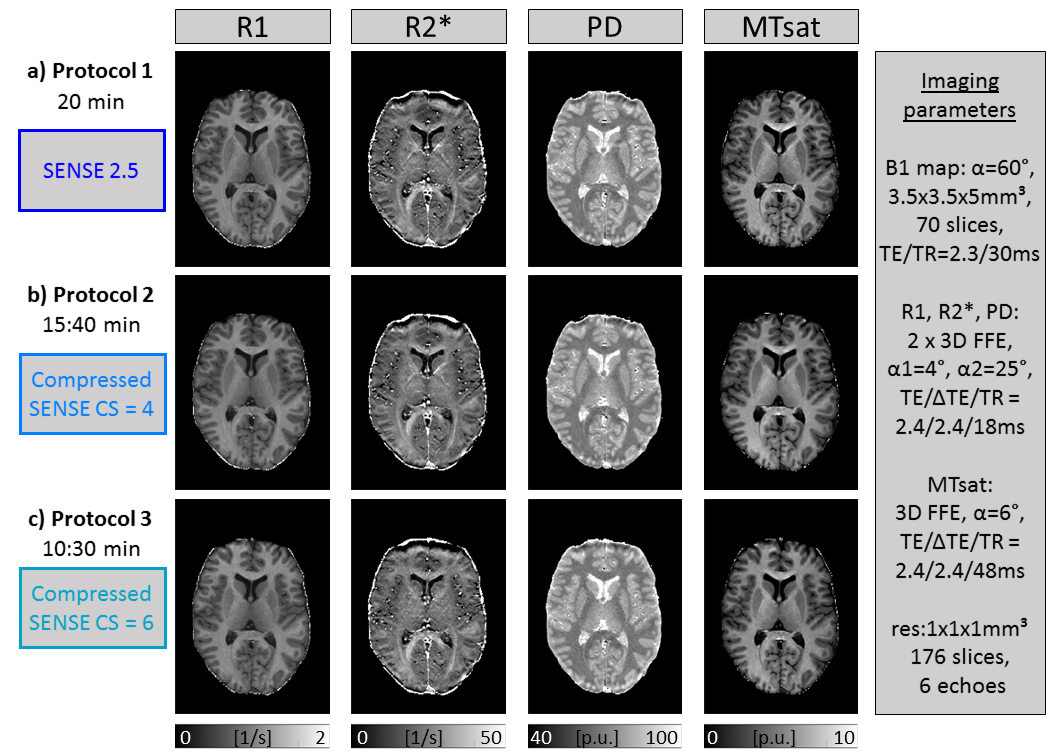
Figure
1: Quantitative R1, R2*, PD, and MTsat parameter maps for different
accelerations. Comparison of an
exemplary axial slice of one subject of R1, R2*, PD and MTsat maps for standard
SENSE acceleration (a) and for Compressed SENSE acceleration with acceleration
factors 4 (b) and 6 (c). Imaging parameters of all sequences are listed on the
right and the respective scan duration of the whole protocol on the left.
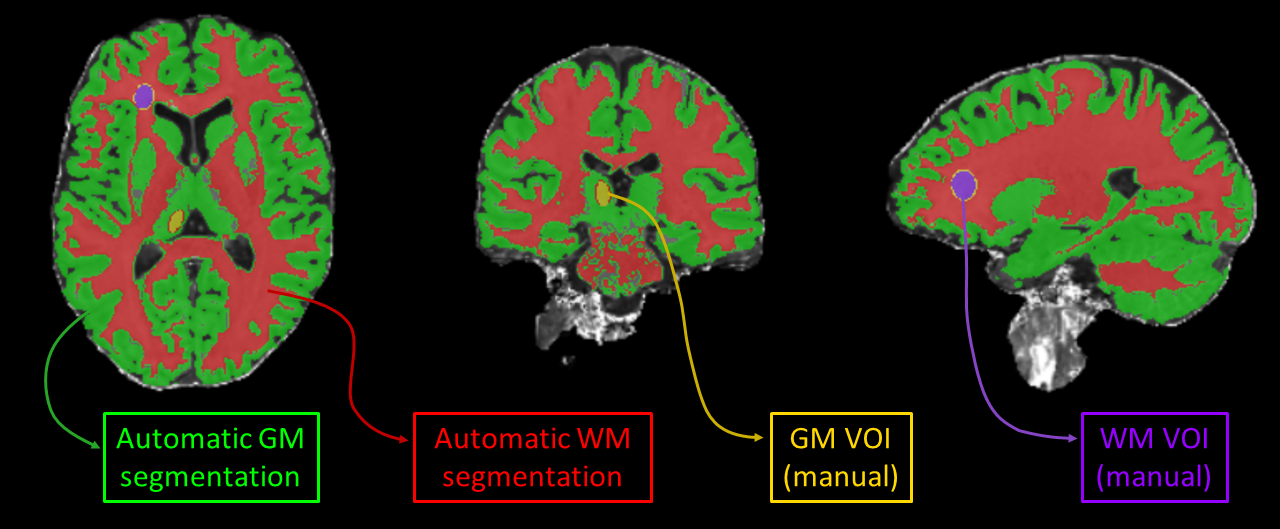
Figure
2: Exemplary delineation of GM and WM volumes-of-interest in one subject. Automatic whole-brain GM and WM were determined by
segmentation via SPM12 and selection of voxels with a respective GM or WM probability of
at least 0.75. Additionally, one smaller, elliptical, manual drawn
volume-of-interest (VOI) was selected in GM and WM. Automatic GM and WM
segmentations are shown in green and red, respectively, and manual GM and WM
VOIs in yellow and purple.
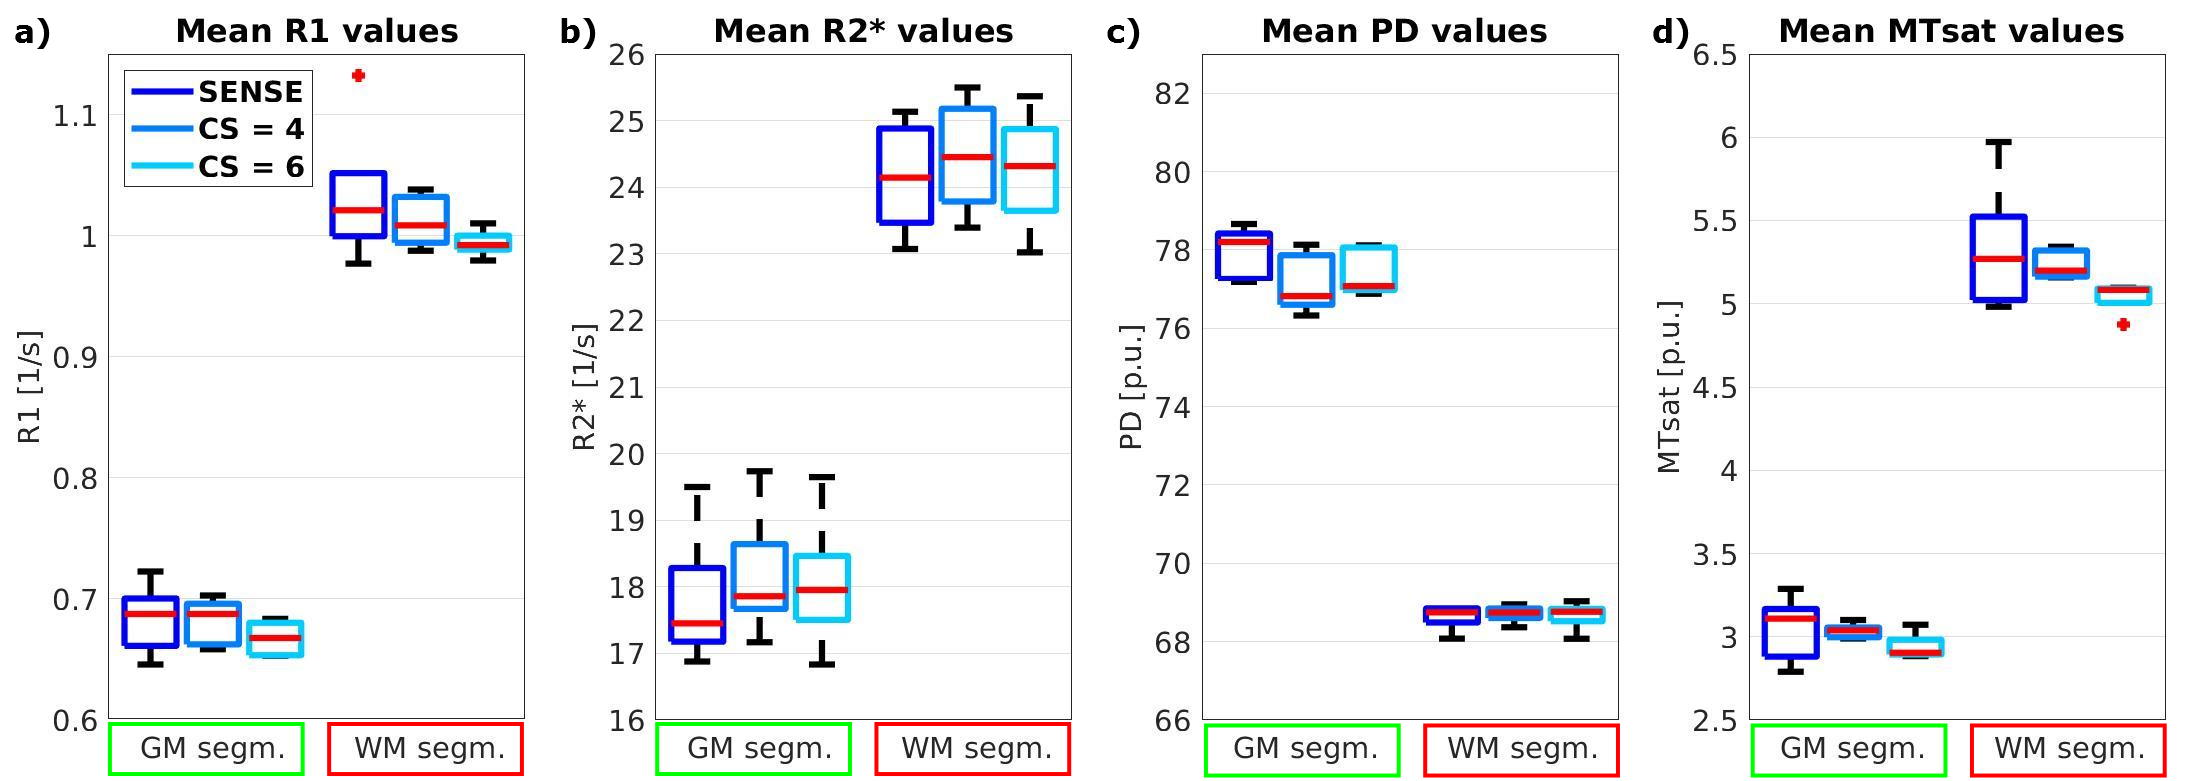
Figure
3: Box plot of average quantitative R1, R2*, PD, and MTsat values of
whole-brain GM and WM across subjects. Average parameter values within automatically
segmented GM (green box) and WM (red box) show comparable results for different
accelerations (SENSE vs. CS). Red lines indicate the median of mean values
across five subjects, boxes (25th and 75th percentiles) and whiskers indicate
standard deviation across subjects according to standard settings
(MatlabR2017b).
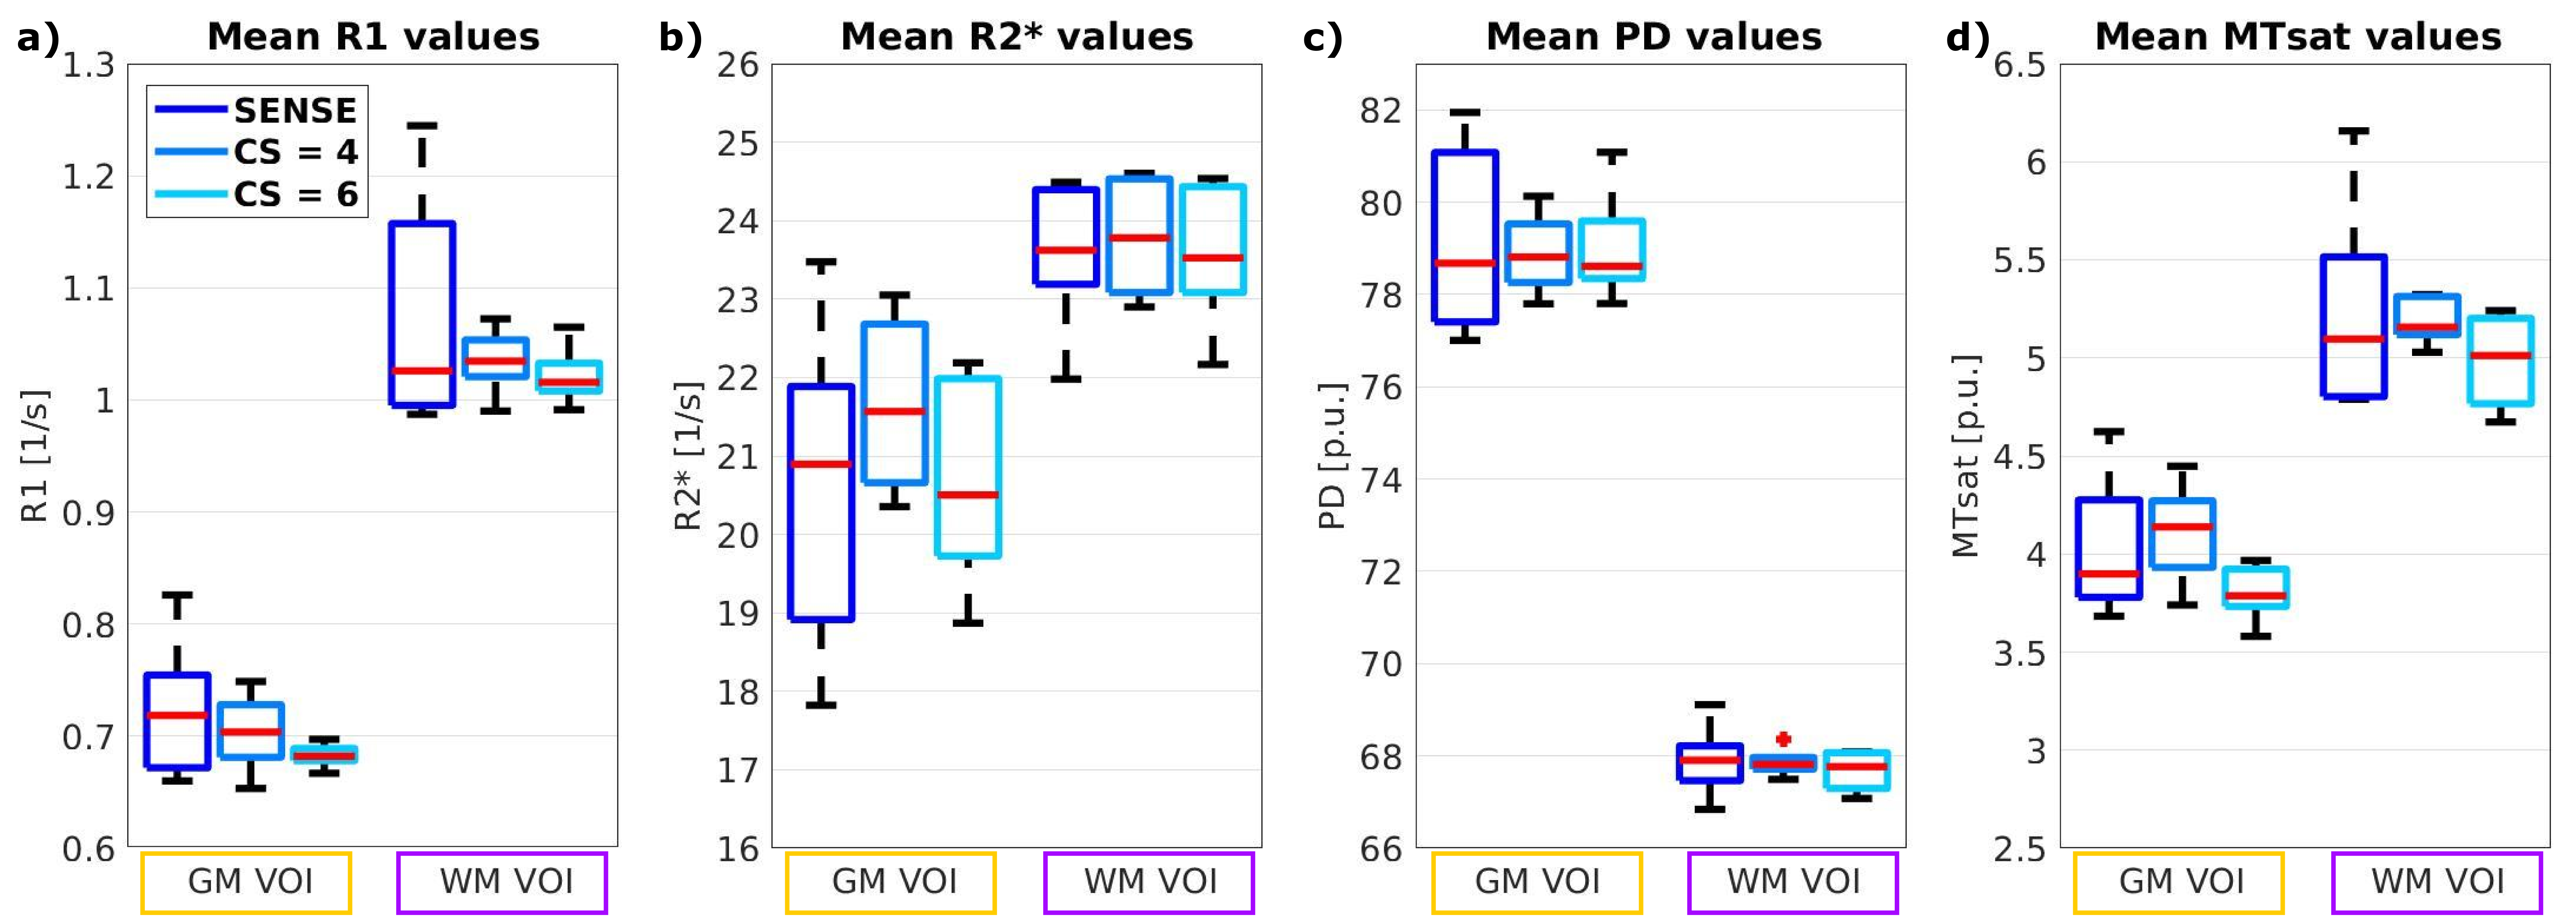
Figure
4: Box plot of average quantitative R1, R2*, PD, and MTsat values of manually
drawn volumes-of-interest (VOIs) in GM and WM across subjects. Average parameter values within manually drawn VOIs
in areas of GM (yellow box) and WM (purple box) show similar results for
different accelerations (SENSE vs. CS). Red lines indicate the median of mean
values across five subjects, boxes (25th and 75th percentiles) and whiskers
indicate standard deviation across subjects according to standard settings
(MatlabR2017b).
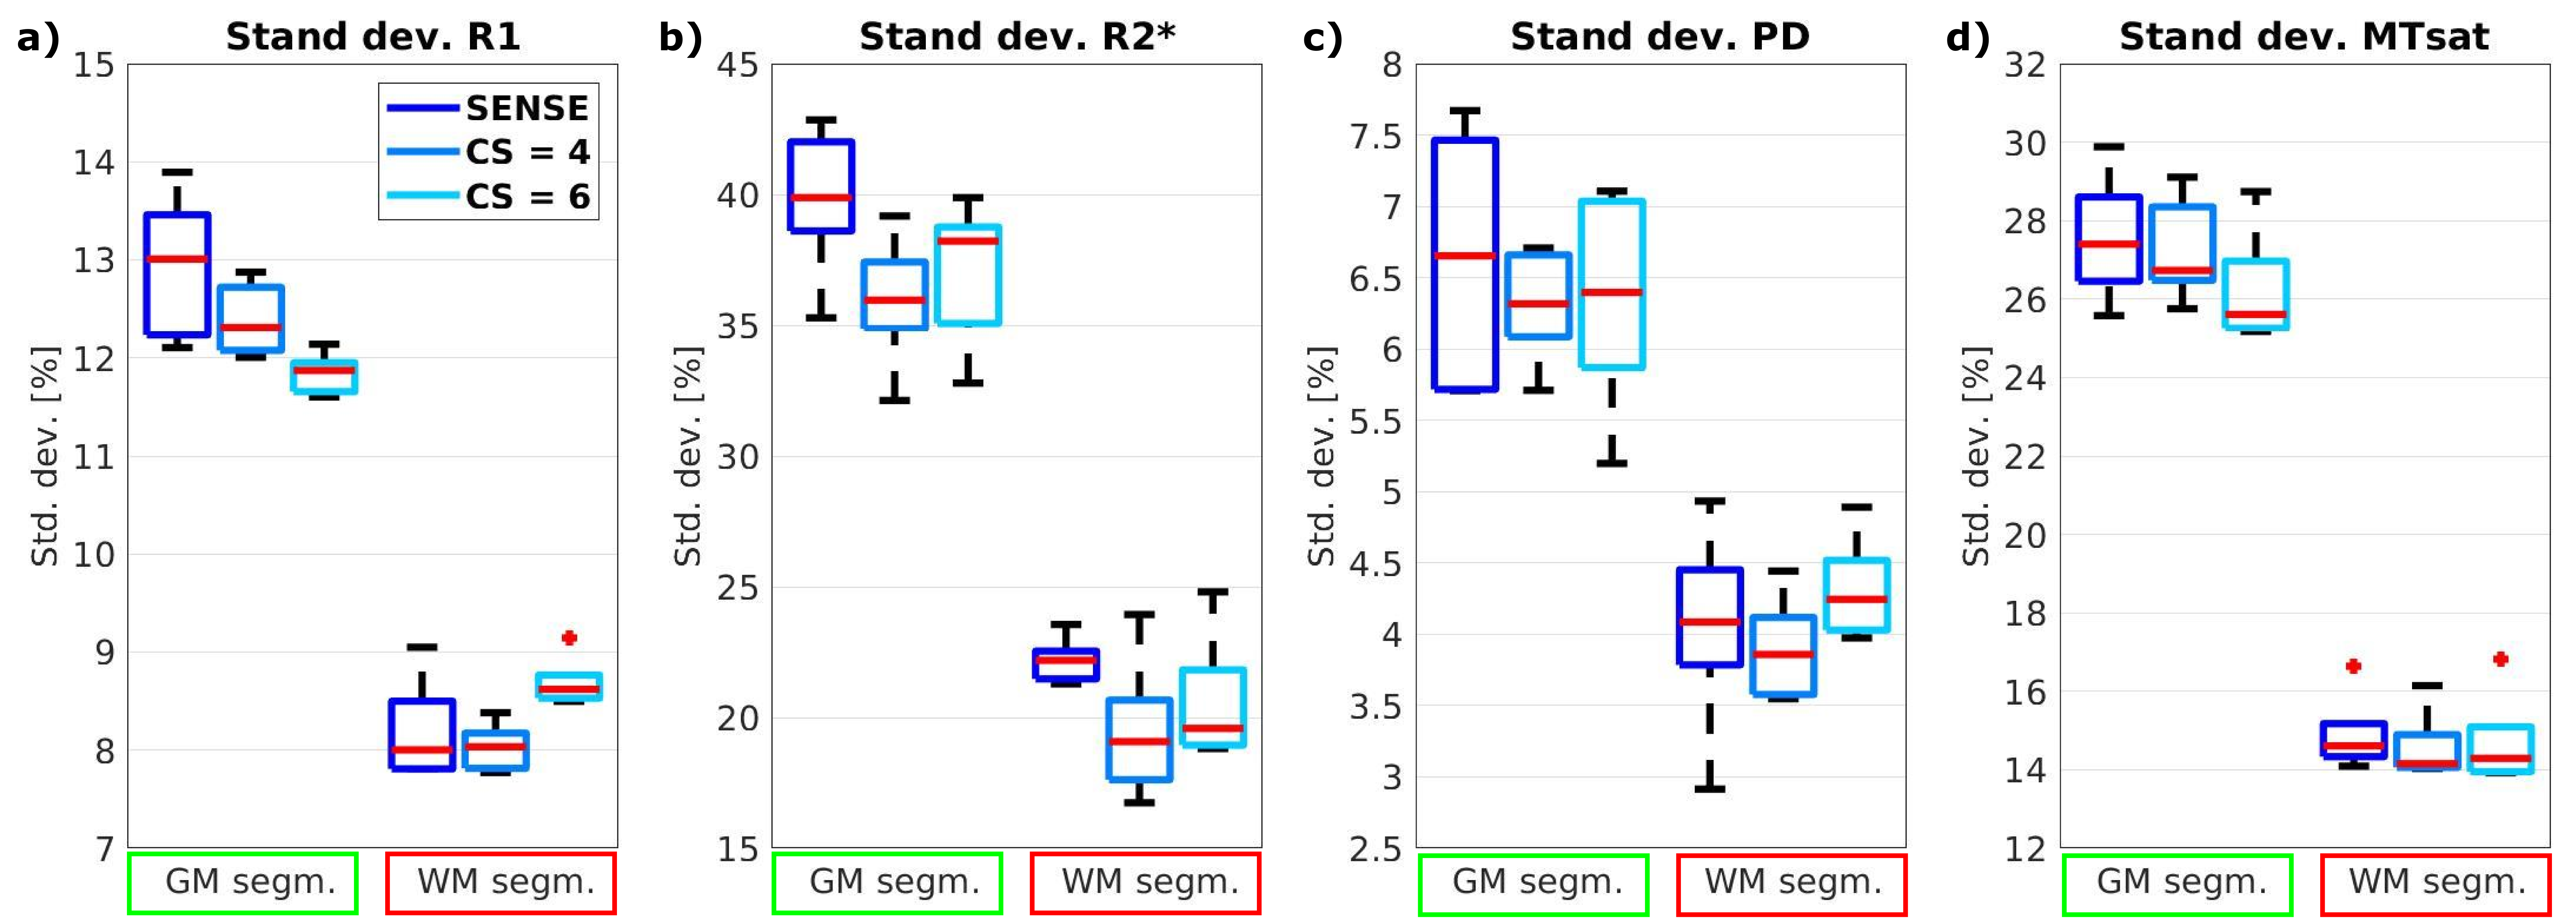
Figure
5: Box plot of average standard deviations of R1, R2*, PD, and MTsat values of
whole-brain GM and WM across subjects. Standard deviations within automatically segmented GM
(green box) and WM (red box) show similar results for different accelerations
(SENSE vs. CS) with a trend for higher variations with standard
SENSE. Red lines indicate
the median of mean standard deviation across five subjects, boxes (25th and
75th percentiles) and whiskers indicate standard deviation (of mean standard
deviation values) across subjects according to standard settings
(MatlabR2017b).