3774
Phantom study on magnetic resonance imaging (MRI) T1 and T2 relaxation times measurements standardization1Department of Physics, Università degli Studi di Pavia, Pavia, Italy, 2Department of Medical Physics, ASST Grande Ospedale Metropolitano Niguarda, Milan, Italy, 3Department of Cardiology, ASST Grande Ospedale Metropolitano Niguarda, Milan, Italy, 4Department of Physics, Università degli Studi di Milano, Milan, Italy
Synopsis
Relaxation times measurement standardization, a great issue in clinical inter-centre and inter-scanner applications, is studied by comparing relaxation times maps of a MnCl2 phantom, scanned with two different MRI imagers, with reference values measured with an NMR laboratory spectrometer. For this study standard sequences were used: NMR reference T1 and T2 values were obtained from IR (Inversion-Recovery) and CPMG (Carr-Purcell-Meiboom-Gill) sequences respectively; MRI maps were generated from clinical IR and SE (Spin-Echo) sequences. The MRI and NMR results agreement within the experimental error limits (5%) suggests that the estimation of the relaxation times is independent from the spectrometer/scanner utilized.
Introduction
Performing clinical diagnosis by means of MRI pure relaxation times maps 1 is a procedure that requires a high level of standardization between methods of images acquisition and post-processing 2,3 and, most of all, among different scanners 4: qualitative and quantitative information on tissues physical properties should be obtained through the appropriate image acquisition and analysis.User-verified validation of MRI scanners standardization in measuring relaxation times is necessary especially using MRI scanner-independent methods.
This study has the aim to assess the standardization in measuring relaxation times values for 1H nuclei from post-processing of phantom images acquired by means of different vendor clinical MRI scanners taking as a reference T1 and T2 values estimated with an NMR laboratory spectrometer.
Methods
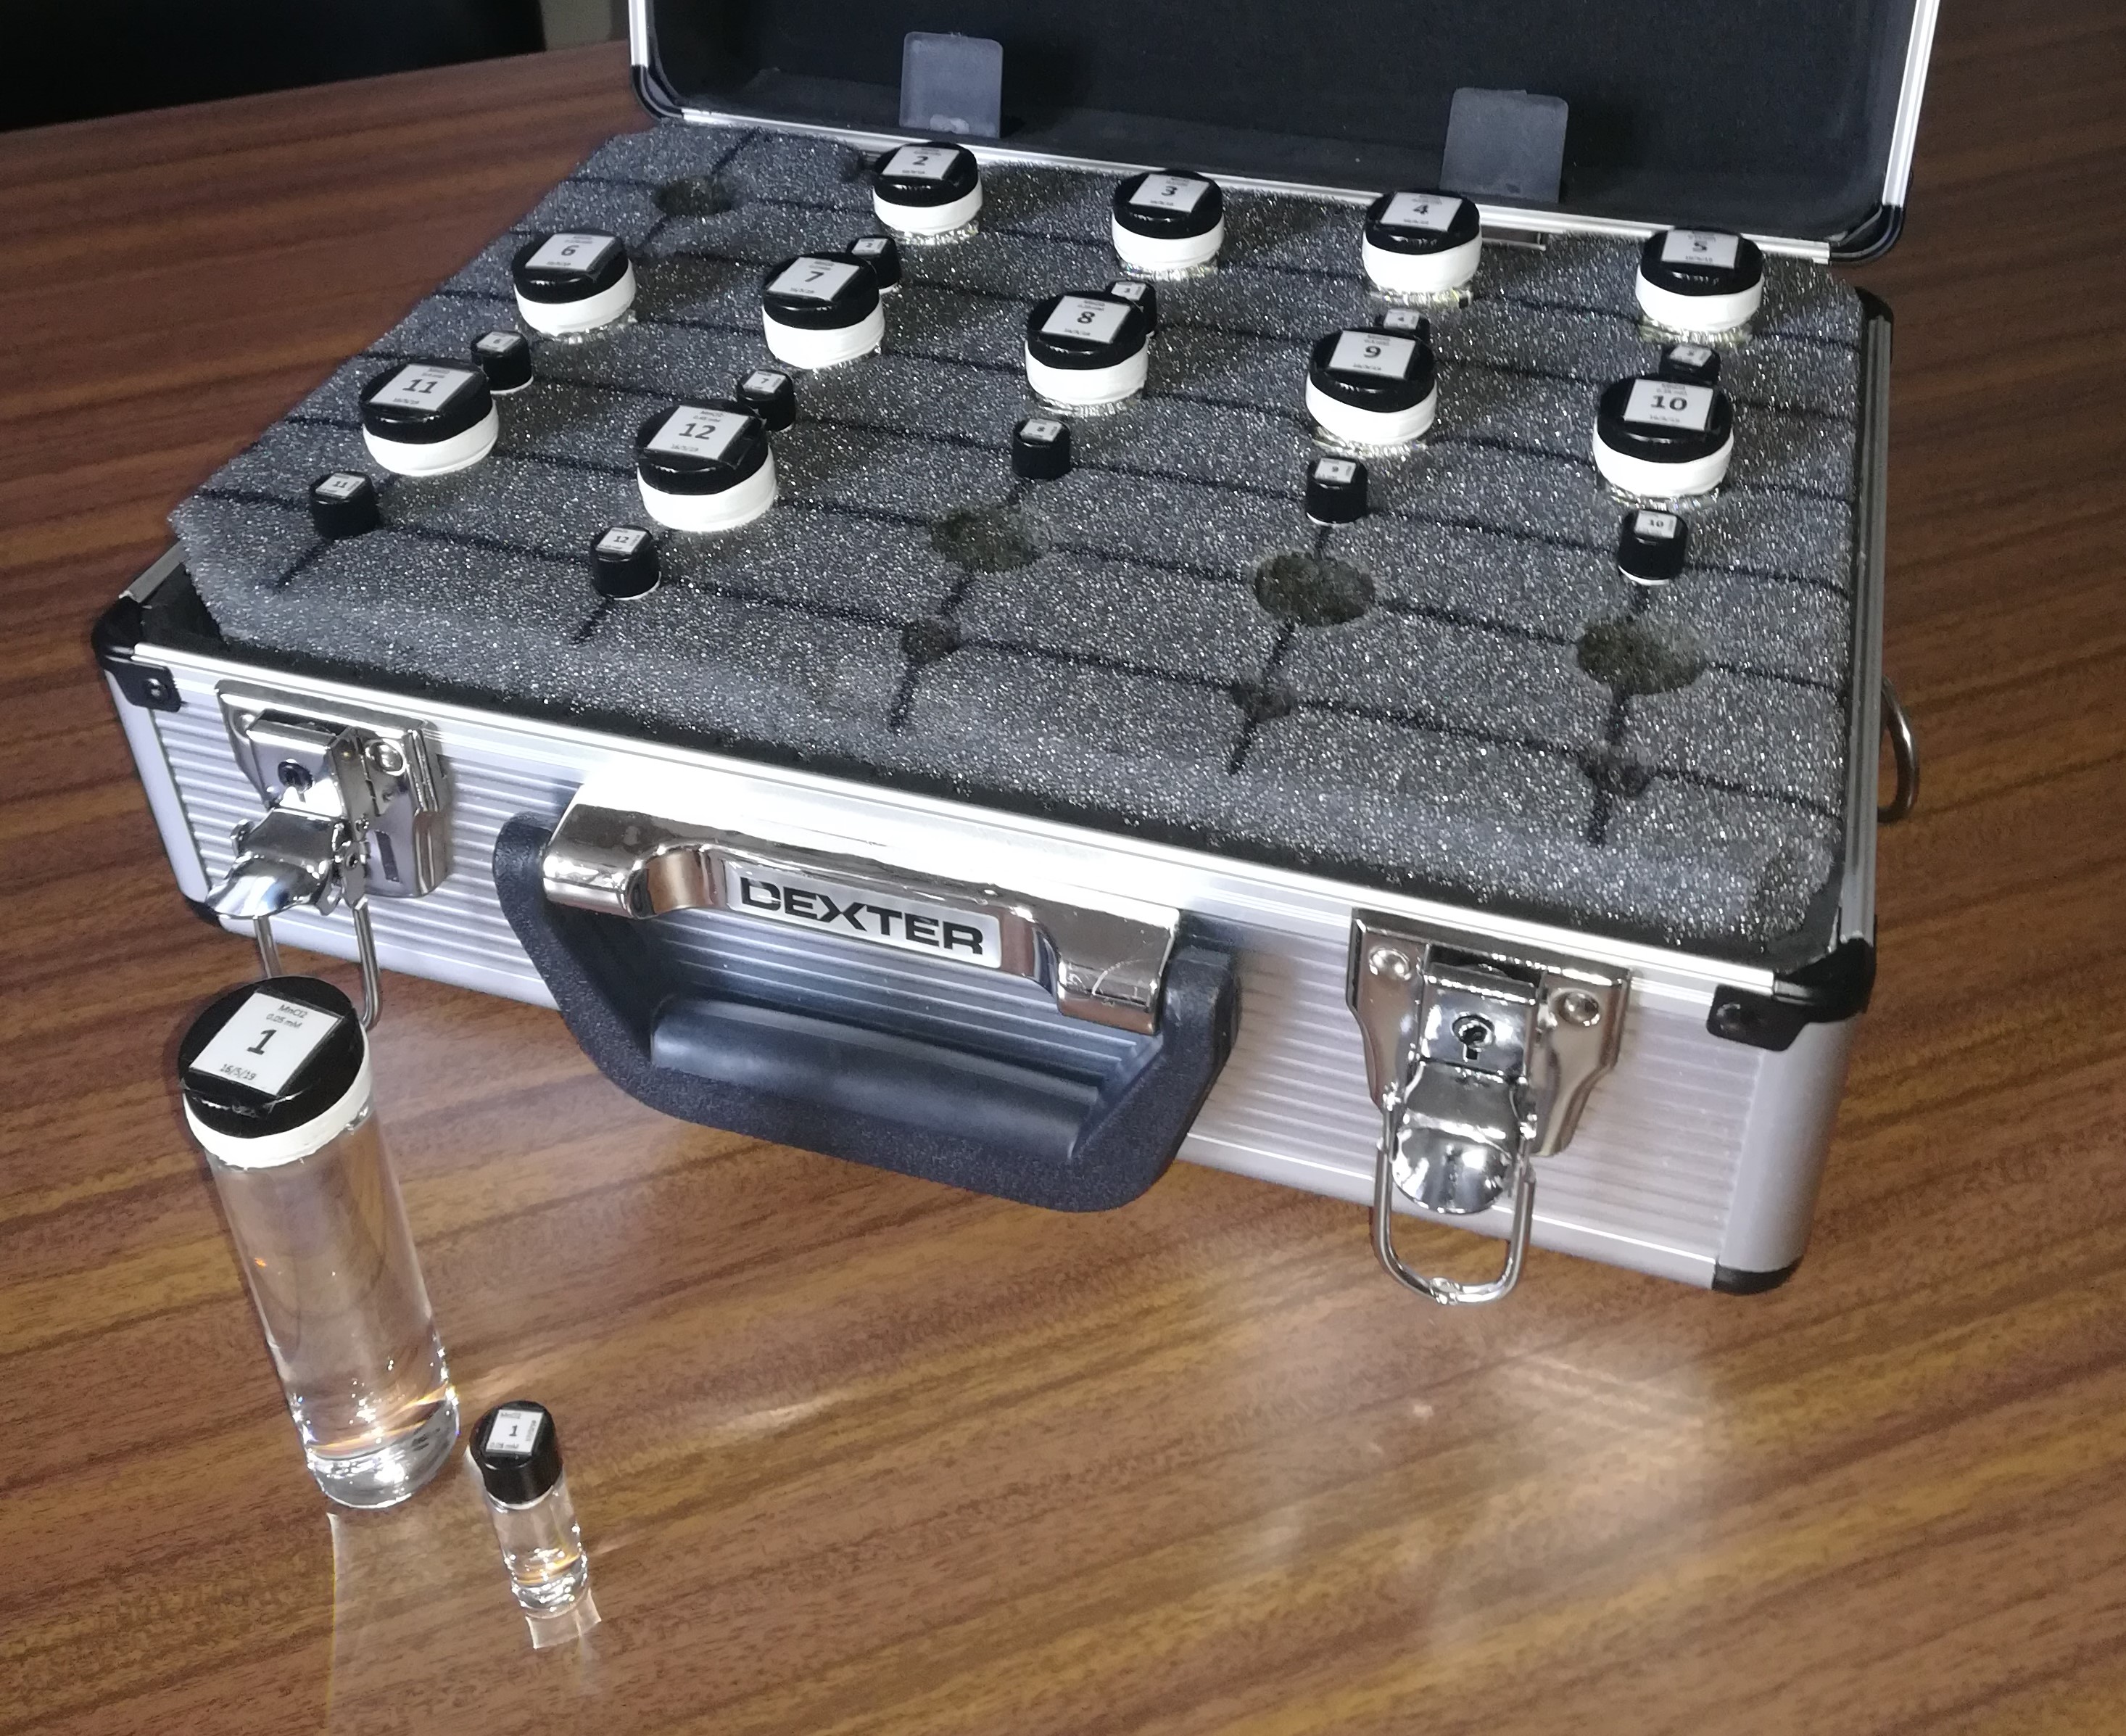
For this study an MRI phantom was realised: the phantom is composed by twelve vials (30 ml) made of borosilicate glass with Teflon caps filled with different concentrations of MnCl2 aqueous solutions. 5Reference T1 and T2 values at 1.5 T of the solutions were measured with an NMR spectrometer (Techmag Apollo spectrometer, Bruker electromagnet) scanning twelve smaller vials (2 ml) made of the same materials and filled with the same solutions of the bigger ones (see Figure 1). The temperature dependence of relaxation time values was measured as well: the vials were analysed inside a cryostat in which the temperature was set by a flux of liquid nitrogen and a heating resistance; the temperature was measured with a thermocouple nearby the vial with a sensibility of ±0.2 K.
The NMR sequences used to obtain the reference values were standard sequences: SR (Saturation Recovery) and IR (Inversion Recovery) for T1 measurements; SE (Spin-Echo) and CPMG (Carr-Purcell-Meiboom-Gill) for T2 measurements. 6
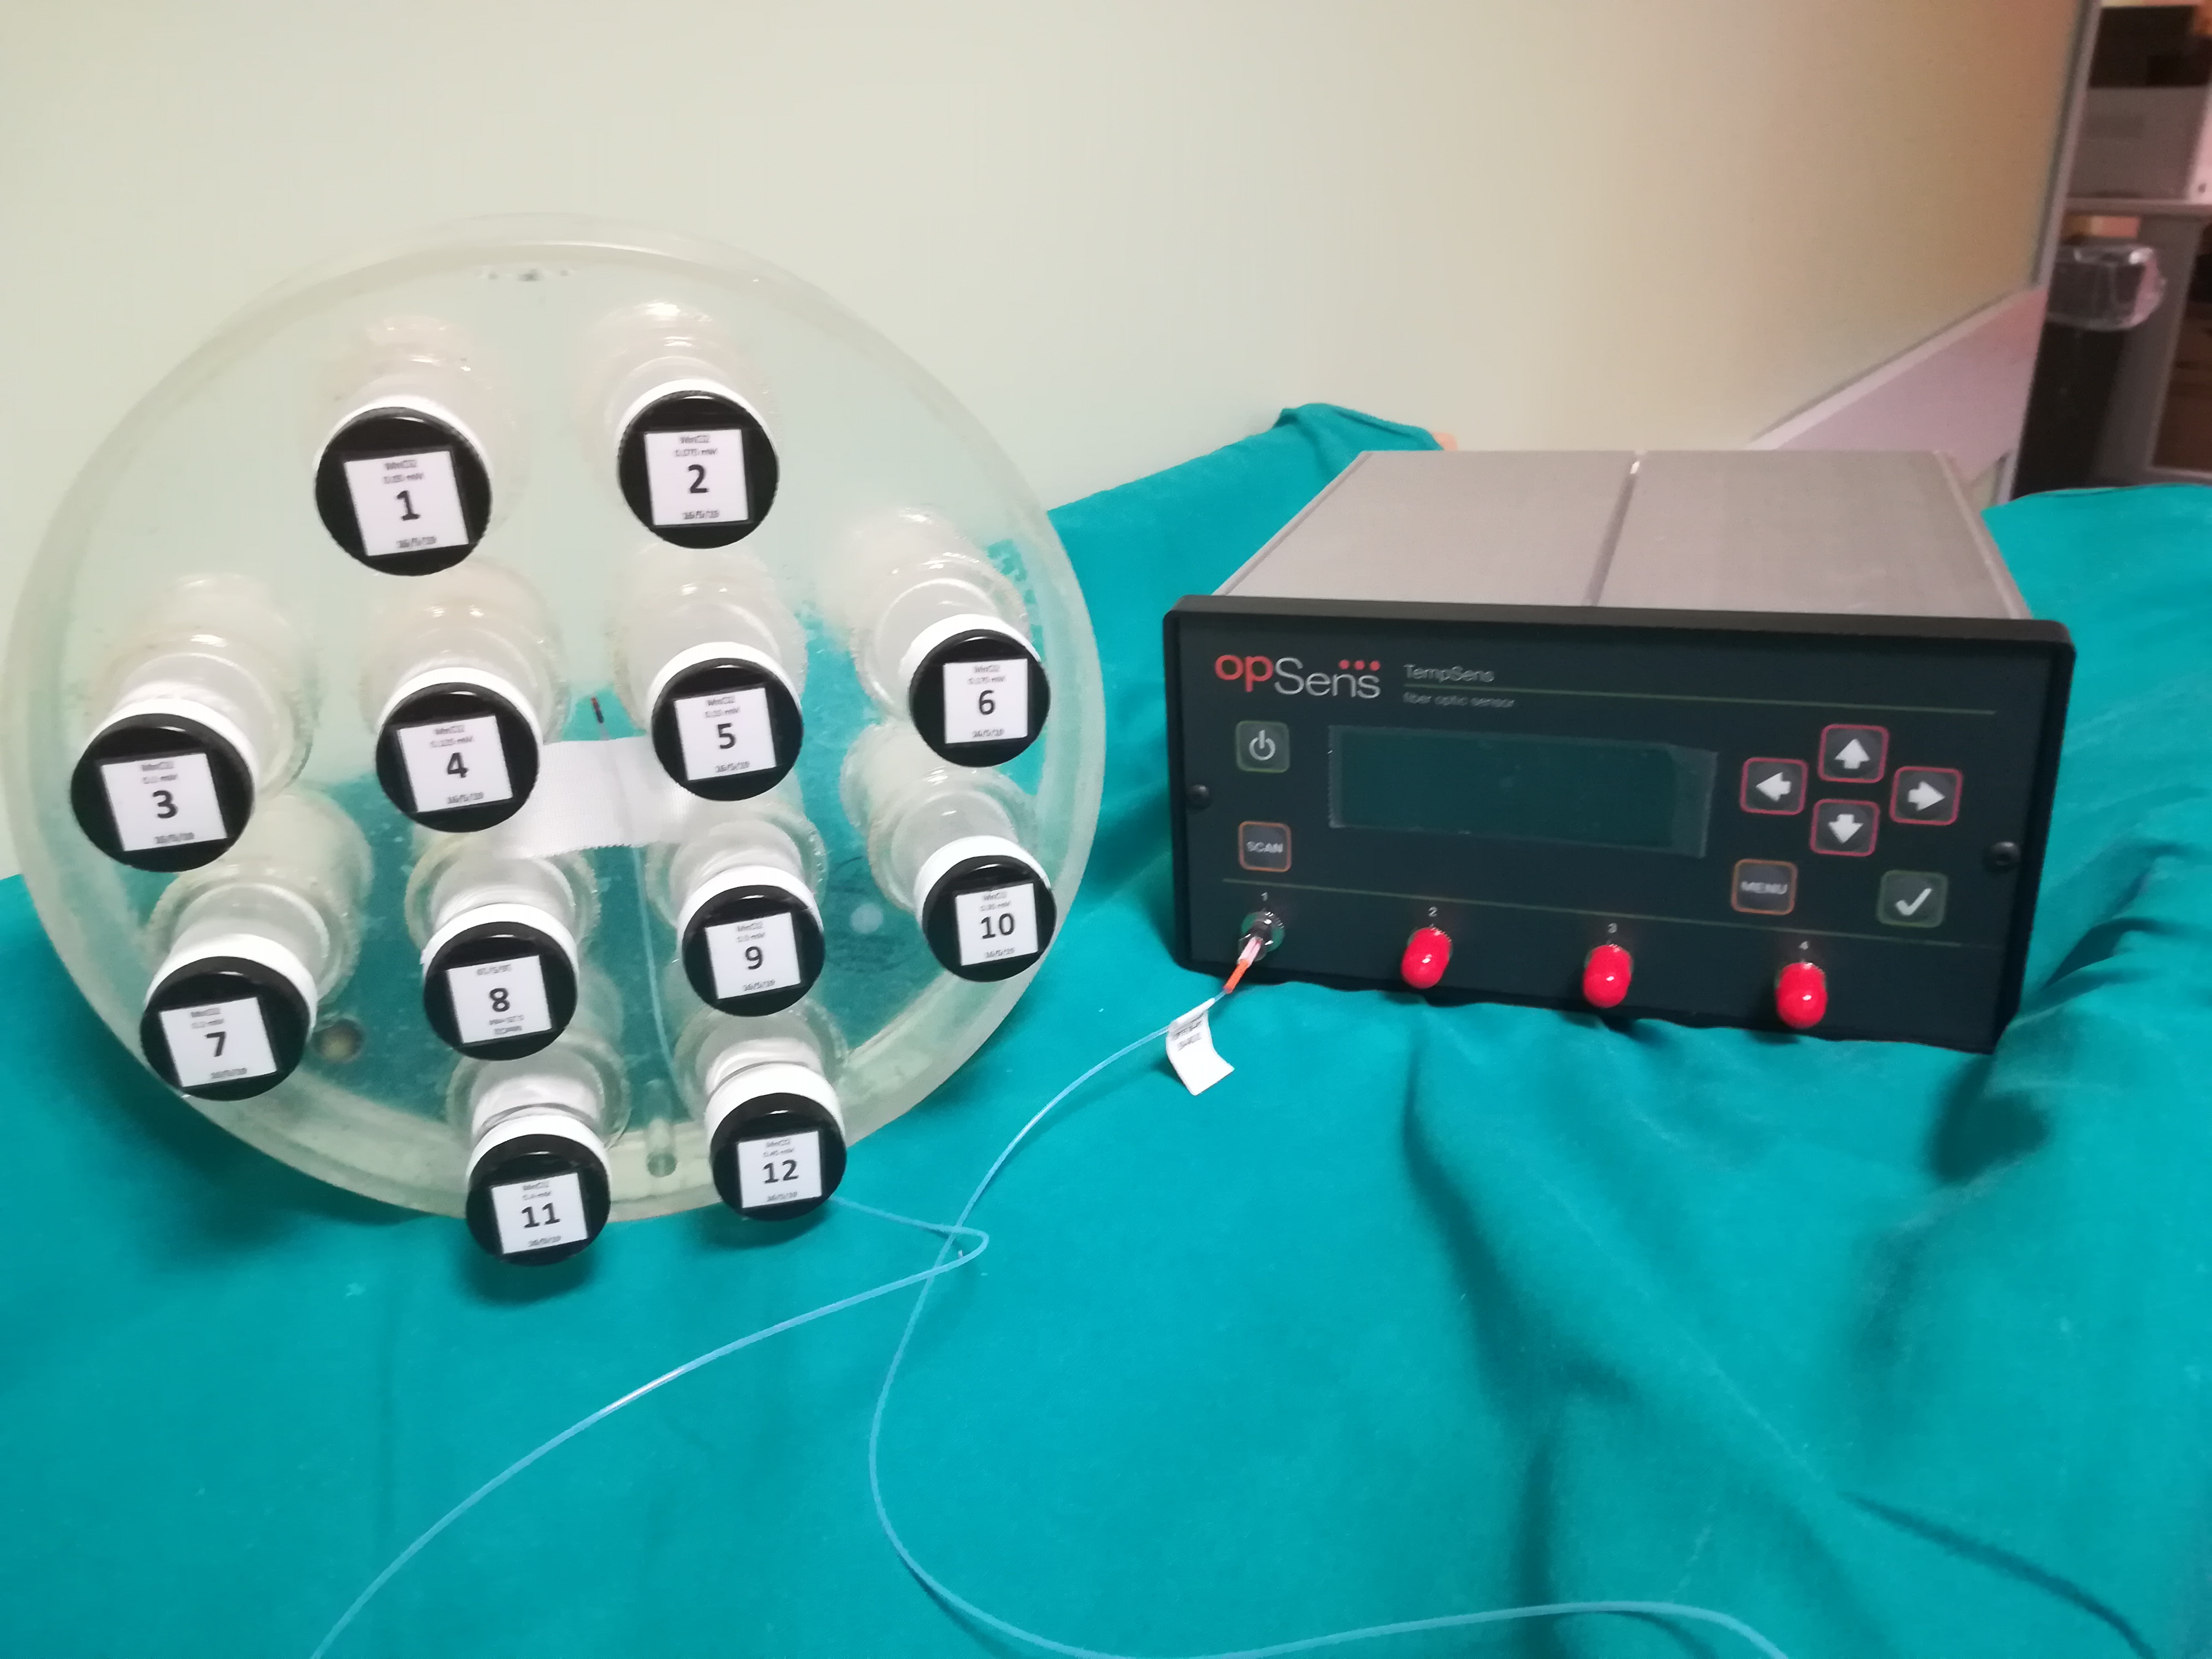
MRI measurements of relaxation times were performed with two different scanners: a Siemens Magnetom Aera (1.5 T) and a General Electric Signa (1.5 T) MRI scanners, using clinical SE and IR sequences. The temperature of the phantom was monitored by means of an optical fibres sensor TempSense (Opsense Inc., Quebec, Canada, Figure 2) with a sensibility of ±0.2 K. Images were post-processed by the vendor independent open source software Segment 7 (http://www.medviso.com) in order to obtain the relaxation times maps: measurements of relaxation times were performed with Segment itself selecting ROIs (Regions Of Interest) on the generated maps.
Results
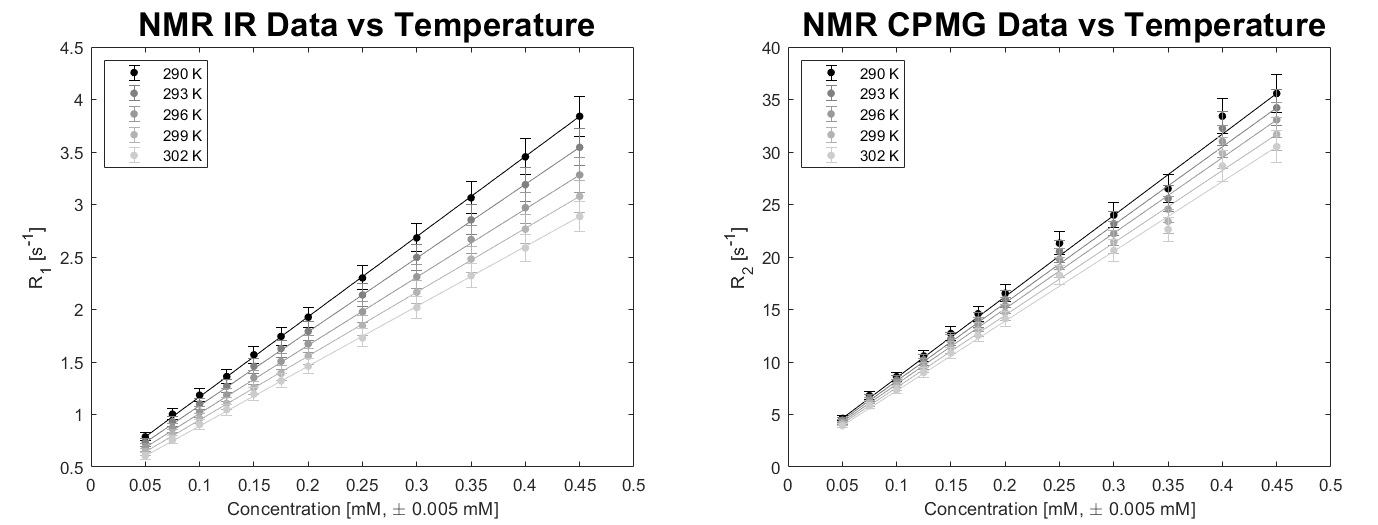
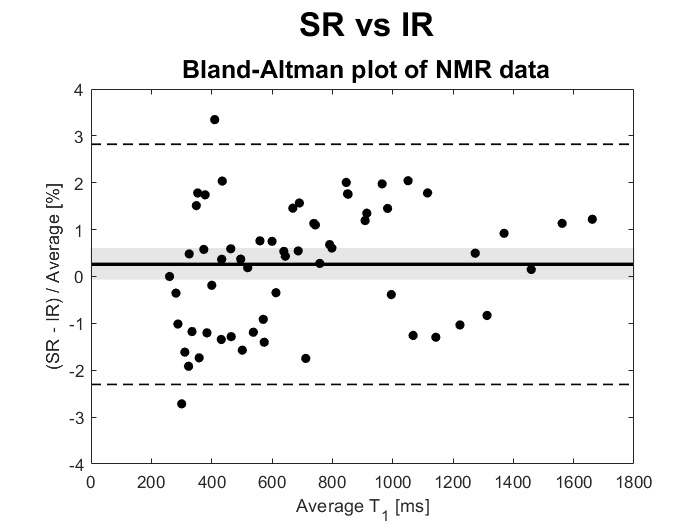
NMR results concerning the dependence of relaxation times from MnCl2 concentration and from temperature are shown in Figure 3. An experimental error of ±5% was applied to all values (from previous studies on the systematic error of the NMR experimental set up). SR results are not shown because statistically coincident with the IR ones (within the experimental error of 5%, as shown in the Bland-Altman analysis 10 in Figure 4). SE results were affected by a high diffusion that induce a severe underestimation of T2 values: the suppression of the signal due to diffusion is related also to the static field inhomogeneity, that in our experimental system is estimated to be approximately of 90 ppm. 6A conservative experimental error of ±5% was associated to clinical MRI imagers results too.
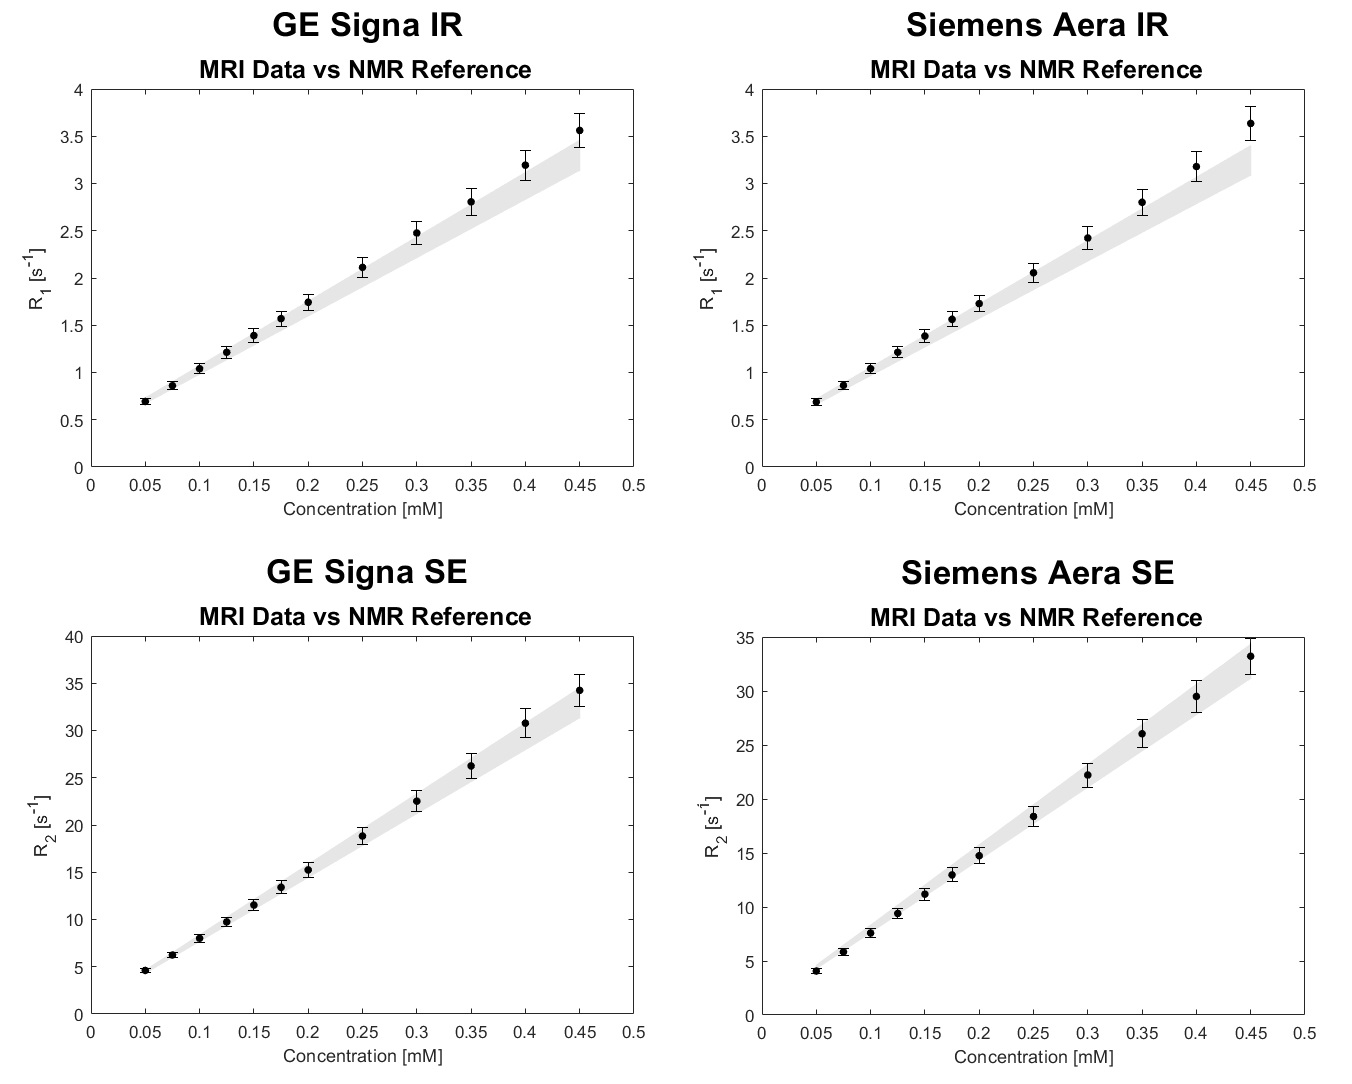
The comparisons between MRI results and NMR results (these last ones taken as reference) are illustrated in Figure 5. To obtain the reference values for the MRI results, which were acquired at different temperatures with respect to the NMR measurements, a linear regression of NMR data vs. temperature was used: with the coefficients obtained from the linear regressions we could determine the relaxation times reference values of each vials at any temperature. Again, an error of ±5% is associated to the NMR reference values calculated in this way. Compatibility tests between MRI values and NMR reference values were performed by means of the two-sample t-test, assuming the experimental errors equal to the standard deviations, thus obtaining for all the comparisons significance level (p-values) greater than 0.1.
Discussion
In our study we assessed T1 and T2 values obtained from NMR measurements and set them as reference values for inter-scanner T1 and T2 evaluation. A good agreement was found for both relaxation times of each vials in the limits of experimental errors (±5% for both T1 and T2) using different and independent MR scanners (an NMR spectrometer and two MRI scanners).An error of ±5% was applied to MRI results because Segment provides the mean value and the error (standard deviation) related to the pixel intensities within a selected ROI (the pixel intensity in a relaxation time map corresponds to the relaxation time value): the error calculated in this way does not provide an accurate estimation of the error related to the several processes that occur in the mapping process (image acquisition and generation, pixel per pixel fitting procedure). Analysis methods as those proposed by Kellman et al. in 2013 11 could lead to a better estimation of experimental errors.
Conclusion
Results suggest that standard sequences are scanner-independent methods to establish pure relaxation times values within the experimental error limits (5%): the sequence-dependence and scanner-dependence, well known in literature especially for fast mapping sequences 3,4,12, could be overcome by an harmonization of acquisition parameters in order to obtain results as close to standard sequences ones as possible.Acknowledgements
No acknowledgement found.References
1. Cheng H-LM, Stikov N, Ghugre NR, Wright GA. Practical medical applications of quantitative MR relaxometry. J Magn Reson Imaging 2012;36:805-824.
2. Roujol S, Weingärtner S, Foppa M, et al. Accuracy, precision, and reproducibility of four T1 mapping sequences: a head-to-head comparison of MOLLI, ShMOLLI, SASHA, and SAPPHIRE. Radiology 2014;272(3):683-689.
3. Baeßler B, Schaarschmidt F, Stehning C, Schnackenburg B, Maintz D, Bunck AC. A systematic evaluation of three different cardiac T2-mapping sequences at 1.5 and 3T in healthy volunteers. Europ J Radiol 2015;84:2161-2170.
4. Raman FS, Kawel-Boehm N, Gai N, et al. Modified look-locker inversion recovery T1 mapping indices: assessment of accuracy and reproducibility between magnetic resonance scanners. J Cardiovasc Magn Reason 2013;15:64.
5. Thangavel K, Saritaş EU. Aqueous paramagnetic solutions for MRI phantoms at 3 T: A detailed study on Relaxivities. Turk J Elec Eng & Comp Sci 2017;25:2108-2121.
6. Brown RW, Cheng YN, Haacke EM, Thompson MR, Venkatesan R. Magnetic resonance imaging: physical principles and sequence design. 2nd ed. New Jersey: Blackwell; 2014.
7. Heiberg E, Sjögren J, Ugander M, Carlsson M, Engblom H, Arheden H. Design and validation of Segment – freely available software for cardiovascular image analysis. BMC Med Imaging 2010;10:1.
8. Solomon I. Relaxation process in a system of two spins. Phys Rev 1955;99(2):559-566.
9. Bloembergen N, Morgan LO. Proton relaxation times in paramagnetic solutions. Effects of electron spin relaxation. J Chem Phys 1961;34(3):842-850.
10. Altman DG, Bland JM. Measurement in medicine: the analysis of method comparison studies. Statistician 1983;32:307-317.
11. Kellman P, Arai AE, Xue H. T1 and extracellular volume mapping in the heart: estimation of error maps and the influence of noise on precision. J Cardiovasc Magn Reson 2013;15:56.
12. Kim PK, Hong YJ, Im DJ, et al. Myocardial T1 and T2 mapping: techniques and clinical applications. Korean J Radiol 2017;18(1):113-131.
Figures