3773
CRISTINA: Cartesian Single and Triple Quantum Imaging of 23Na in the Brain1Medical Faculty Mannheim, Heidelberg University, Mannheim, Germany, 2Aix-Marseille University, CRMBM, CNRS, Marseille, France
Synopsis
Multi-quantum sodium imaging offers additional insights compared to standard single-quantum (SQ) images with information beyond tissue sodium concentration (TSC). Simulation including B0 inhomogeneity and stimulated echo signals of multi-quantum signals and spectra of phase cycle choices facilitated robust sequence development. The characteristic temporal evolution of the SQ and triple quantum (TQ) sodium is of interest and a multi echo sequence for SQ and TQ signal acquisition was developed, which was evaluated in phantom and 5 healthy volunteers in the brain.
INTRODUCTION
Multi-quantum (MQ) imaging offers additional insights compared to standard SQ sodium images with information beyond tissue sodium concentration (TSC) e.g., it is hard to discern edema and tumor regions, both exhibiting higher sodium signals. Triple-quantum (TQ) signals are of particular interest to probe the molecular environment in tissues. MQ sodium techniques rely on 3-pulses sequences with different phase cycling schemes.1–4 To compare them, a unified framework is needed to simulate and optimize. Especially, B0 inhomogeneity and stimulated echo signals (STE) stand as potential biases to MQ measurements and need to be fully compensated. Furthermore, the characteristic time evolution of the SQ and TQ is of interest, which calls for a multi-echo sequence to probe the time-evolution measurement and map T2*fast and T2*slow relaxation times. From a thorough analysis using proposed unified framework, we developed CRISTINA, aiming at reducing bias in MQ sodium imaging by prior simulation of different established phase cycles. CRISTINA sequence was optimized and evaluated in phantom and human brain acquisitions at 7T.METHODS
SimulationDifferent phase cycle choices were simulated to develop an efficient imaging sequence free of biases, in form of stimulated echo signal (SSTE) and B0 inhomogeneity(Ω). The phase cycle choice withstanding biases and the basis of the simulation formalism (Equation[1]-[4]) was based on Fleysher 1. ξ=Φ2-Φ1 gives the phase difference. Matrix Ap1,p2 set the amplitudes of each respective coherence transfer path, with start coherence(p1) and end coherence(p2) (Figure.1).
$$\begin{align} A_{p1,p2} & = \begin{matrix} \frac{p2 \rightarrow }{p1\downarrow} & -3 & -2 & -1 & +1 & +2 & +3\\ -1 & -TQ/4 & -DQ/4 & -SQ/4 & -SQ/4 & -DQ/4 & -TQ/4\\ +1 & ~~ TQ/4 & ~~ DQ/4 & ~~ SQ/4 & ~~ SQ/4 & ~ DQ/4 & ~~ TQ/4\\ \end{matrix} &\\ & \\
Signal({ \tau_{1},\tau_{2},\Phi_{1},\Phi_{2},\Omega,TE}) & =\sum_{p1}\sum_{p2} e^{-i \left( p_{1} \phi _{1}+ \left( p_{2} -p_{1} \right) \phi _{2} \right) } e^{-i \left( p_{1} \tau_{1}+p_{2} \tau_{2} \right) \Omega } e^{i \Omega TE~ }A_{p1,p2} &[1]\\SQ & =SQ_{0} \left( \frac{3}{5} e^{-\frac{ \left( TE+ \tau_{1} \right) }{T2*_{slow}}} + \frac{2}{5} e^{-\frac{ \left( TE+ \tau_{1} \right) }{T2*_{fast}}} \right) sin\left( \theta _{exc} \right) &[2] \\TQ &=TQ_{0} \left( e^{-\frac{TE}{T2^*_{slow}}} +~ e^{-\frac{TE}{T2^*_{fast}}} \right) \left( e^{-\frac{ \tau_{1}}{T2^*_{slow}}} +~ e^{-\frac{ \tau_{1}}{T2^*_{fast}}} \right) e^{-\frac{ \tau_{2}}{T2^*_{slow}}}~ sin^{5} \left( \theta _{exc} \right)&[3] \\
S_{STE} & =\sum_{p1}\sum_{p2}e^{-i \left( p_{1} \phi _{1}+ \left( 0-p_{1} \right) \phi _{2} \right) } \frac{ \vert A \vert }{2} e^{-\frac{ \tau_{2 }}{T_{1}}~ }cos \left( \xi- \Omega \tau_{1} \right) e^{i \Omega\,TE} \left( \frac{3}{5} e^{-\frac{ \left( TE- \tau_{1} \right) ^{2}}{2(T2^*_{slow})^{2}}} + \frac{2}{5} e^{-\frac{~ \left( TE- \tau_{1} \right) ^{2}}{2(T2^*_{fast})^{2}}} \right) &[4]\\ \end{align}$$
Measurement
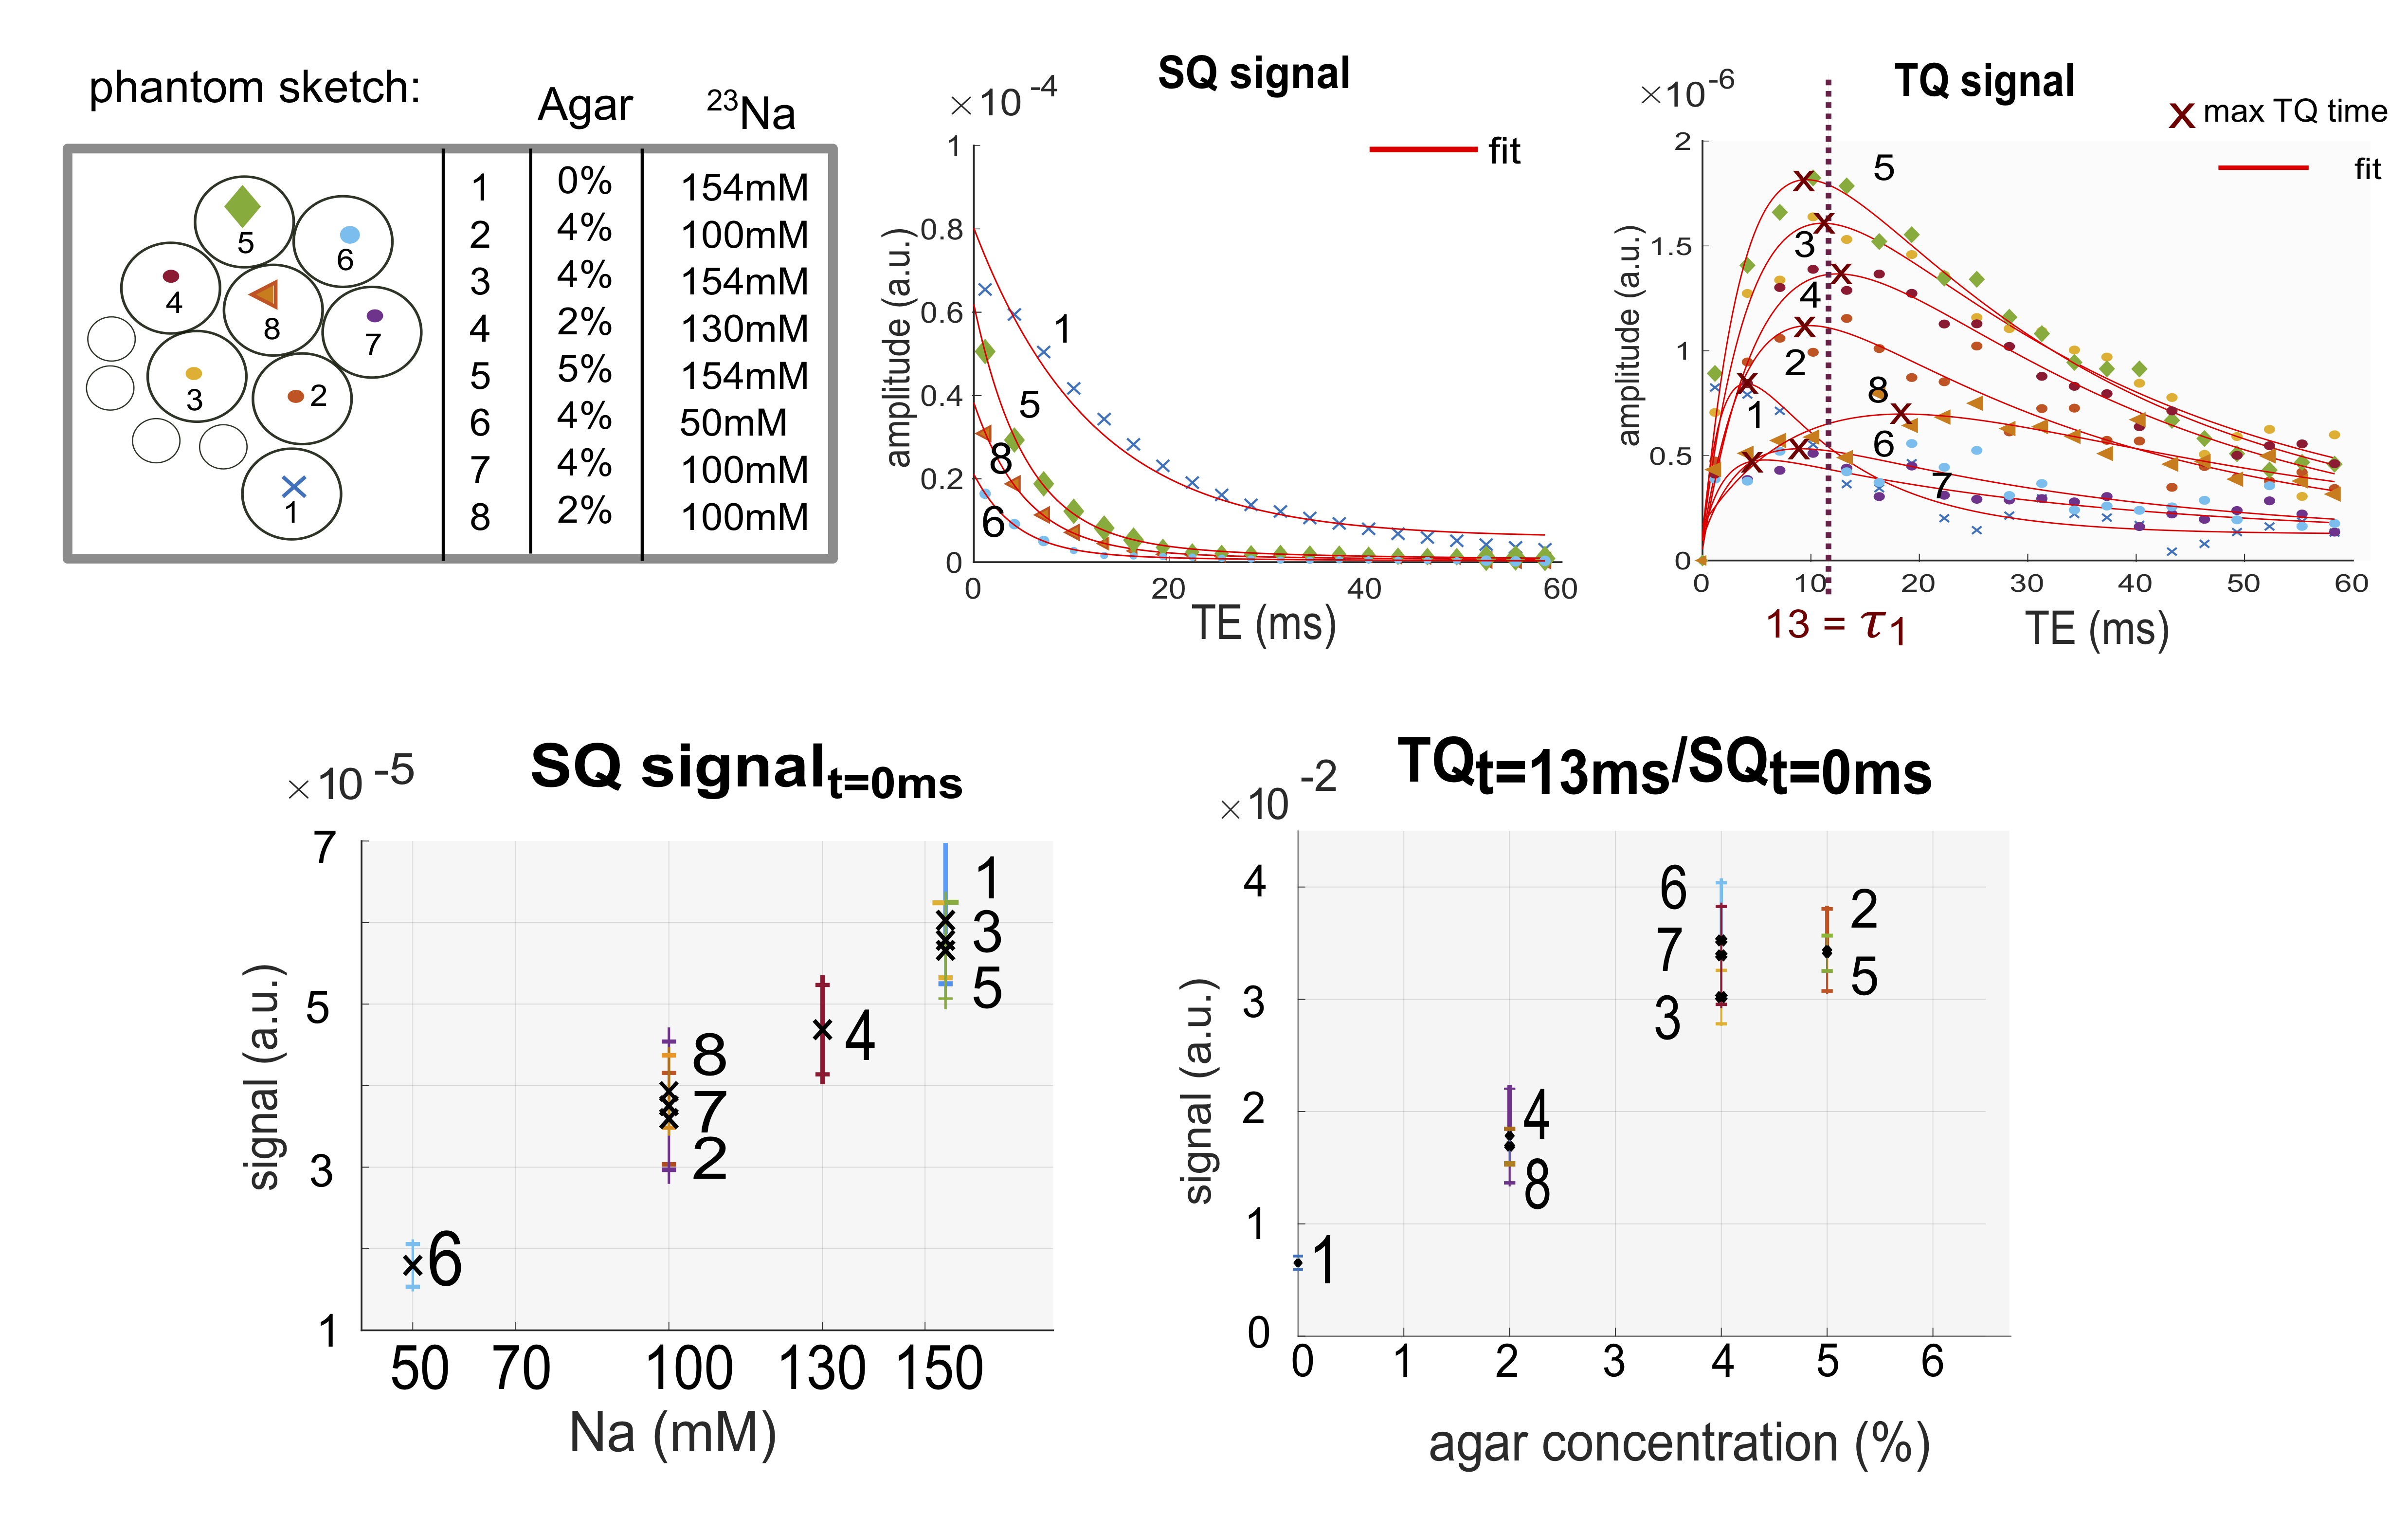
A multi-echo 2D Cartesian Imaging sequence for SQ and TQ 23Na (CRISTINA) was developed (Figure1.a). Multi echo data acquisition allowed to follow the characteristic signal evolution of SQ and TQ coherences simultaneously, and reconstruct B0 map on the same data set. A processing pipeline was designed to combine the two phase-cycles with the B0 map, then fit the multiple echo times and finally retrieve SQ, TQ amplitudes and relaxation times, free of B0 and STE biases. Sequence performance was assessed on agarose phantom and in 5 healthy volunteers at 7T(Siemens Magnetom) for the brain with a 1H/23Na Head coil, 1Tx/1Rx. Agarose phantom was comprised of 8x60ml tubes with scaled agarose (0%-5%) and sodium content (50mM-154mM). Measurement parameters: 48x32 matrix, zero-padded to 128x128 for reconstruction, FOV=230mm2(250mm2 in vivo) for one 20mm slice. In vivo, phantom vials were positioned next to the head: (Left:4%50mM and 4%100mM, Right:2%100mM). Fixed evolution time was determined by a global spectroscopic pre-scan of 2min with incremented evolution time3,5,6. The bandwidth was 330Hz/Px(400Hz/Px in vivo), resulting in a minimum echo time of 1.15ms(1.13ms in vivo) by allowing asymmetric k-space acquisition. The subsequent 19(24 in vivo) echoes were fully sampled with a ∆TE of 3ms.
RESULTS AND DISCUSSION
SimulationThe signal loss due to inhomogeneous B0 field was verified for Ω=(kπ+ξ)/(τ1), k€N0 in simulation (Figure.2). Moreover, the complementary, oscillatory behavior of the two phase-cycles can be recognized which show their nulls and maxima anticyclic (e.g. null at 25Hz for Xi=π/2, max for Xi=0). Furthermore, stimulated echo signal was simulated. And resulted in a continuous offset (0-frequencey) after Fourier Transformation of the phase cycle. The recovery using the known B0 offsets, proposed by Fleysher, also reversed STE bias and the resulting spectrum was free of B0 inhomogeneity and STE bias.
Measurement
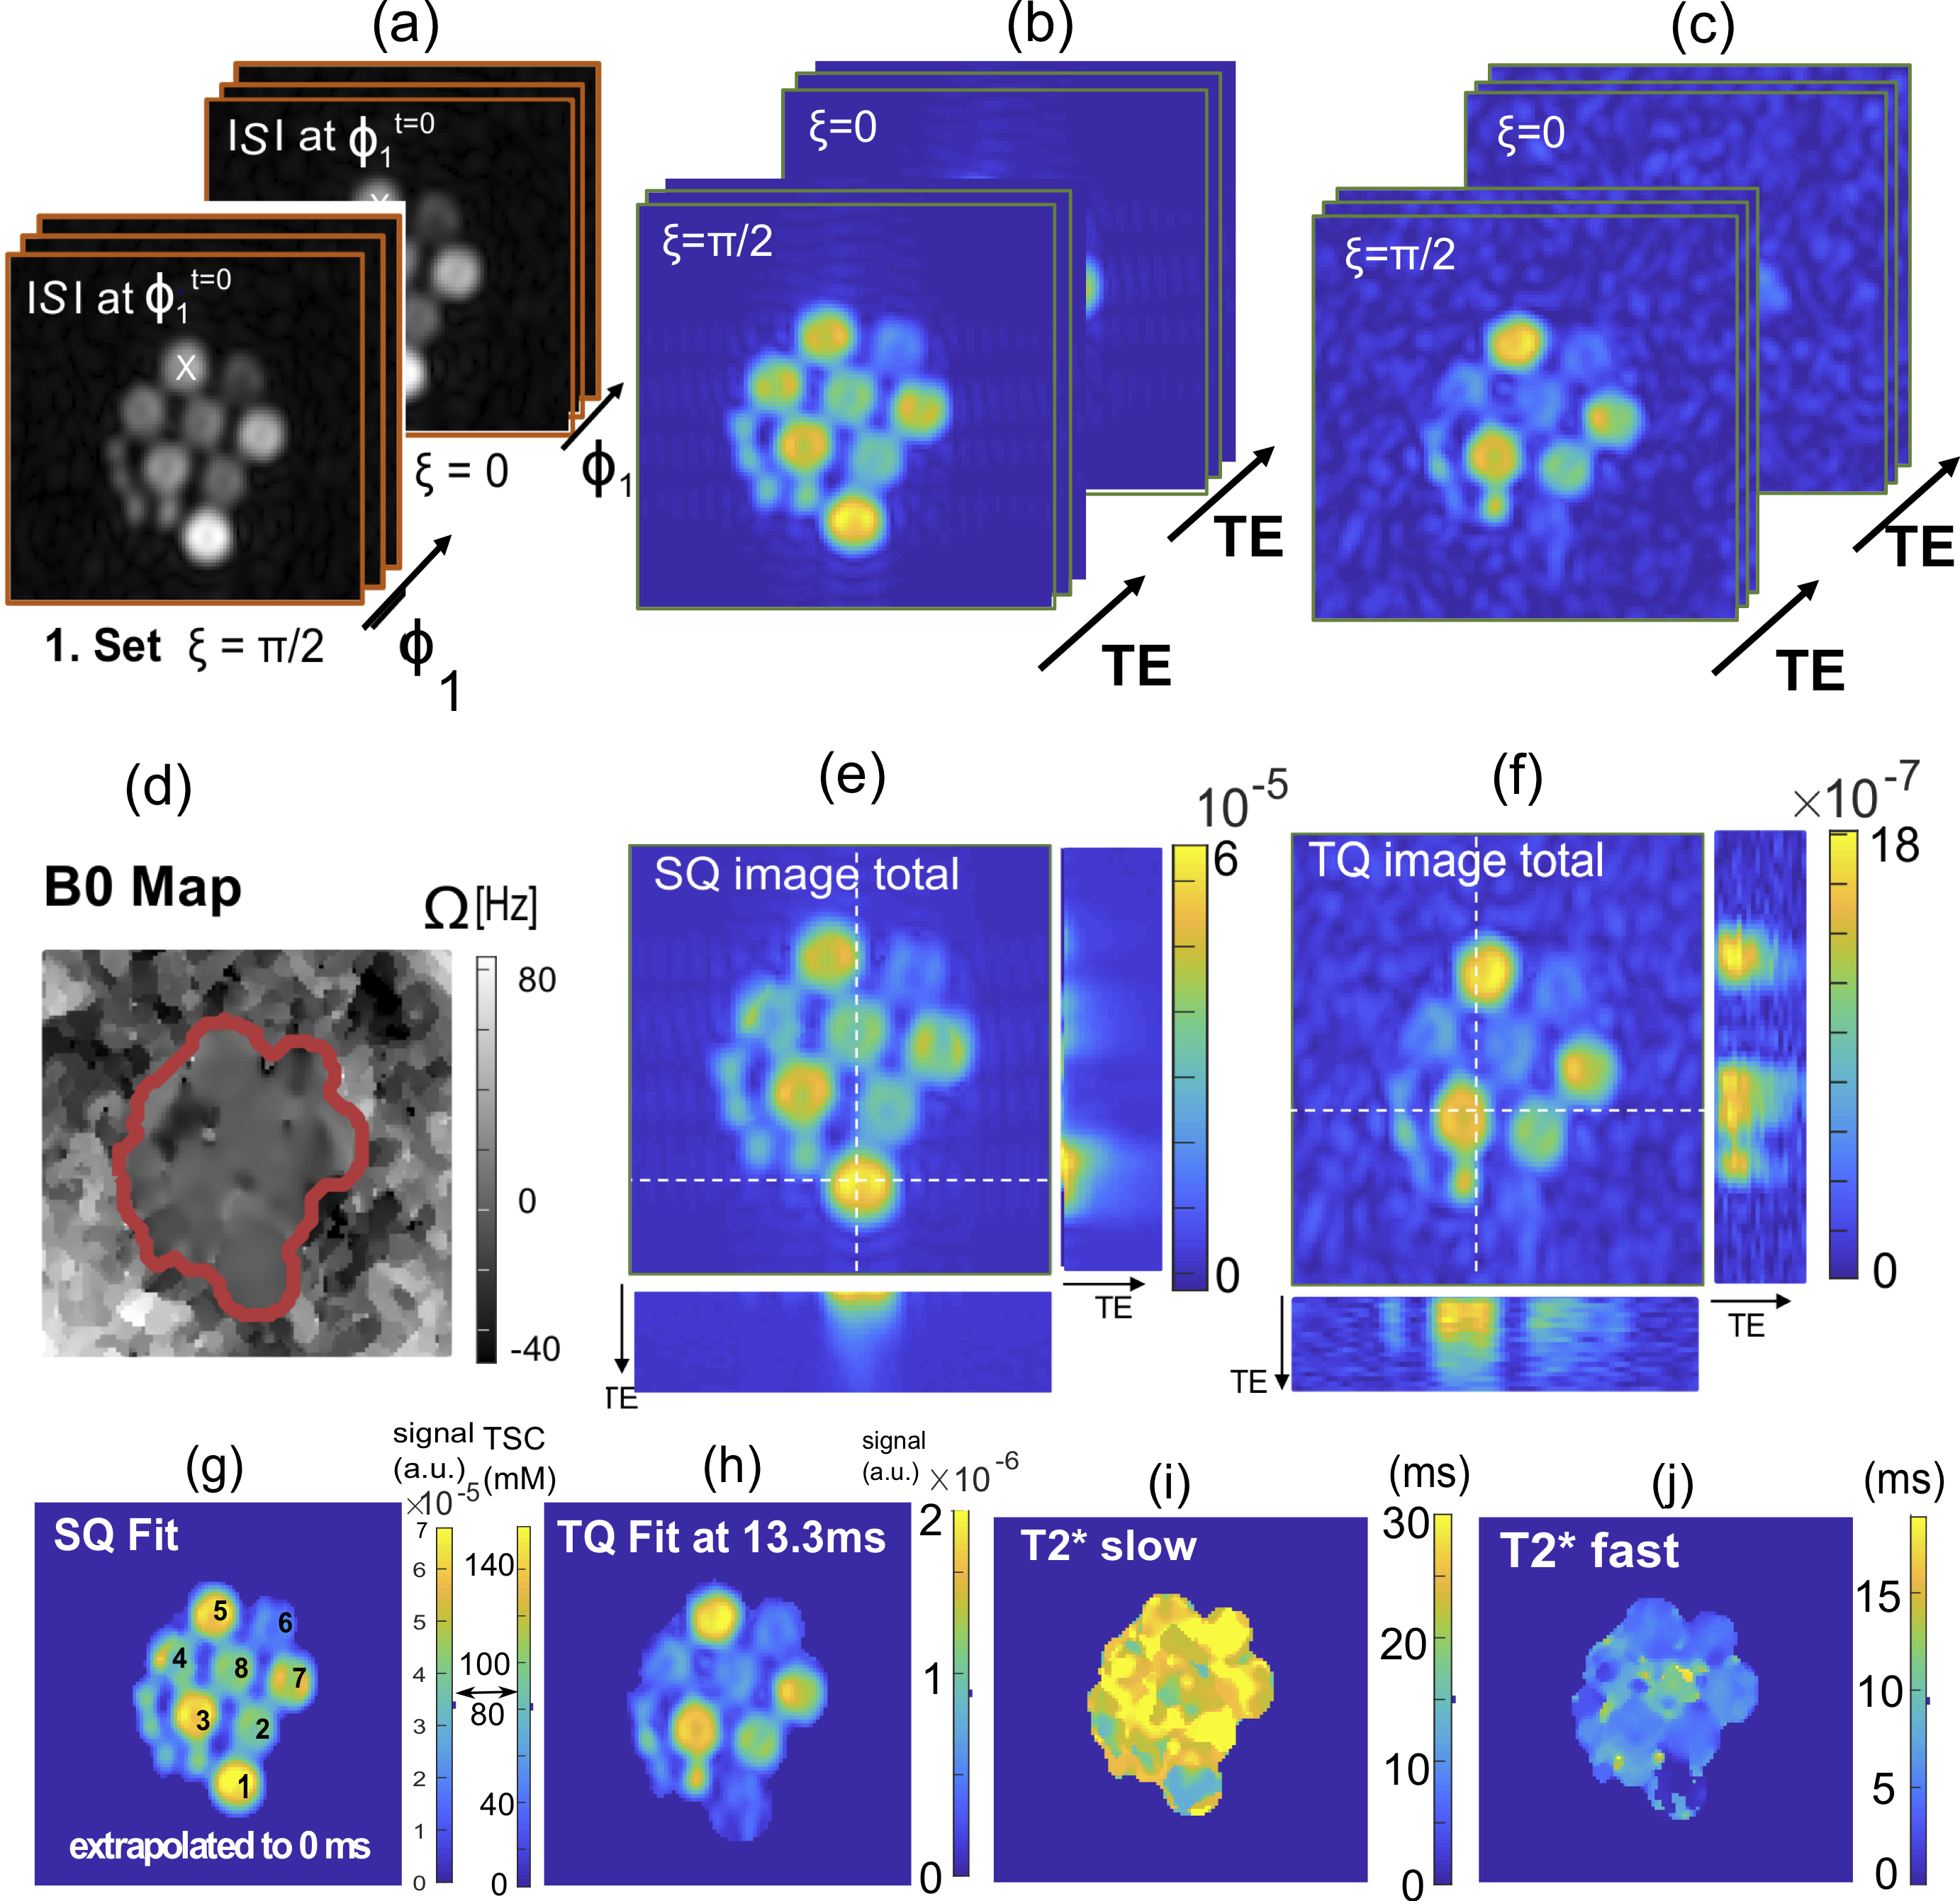
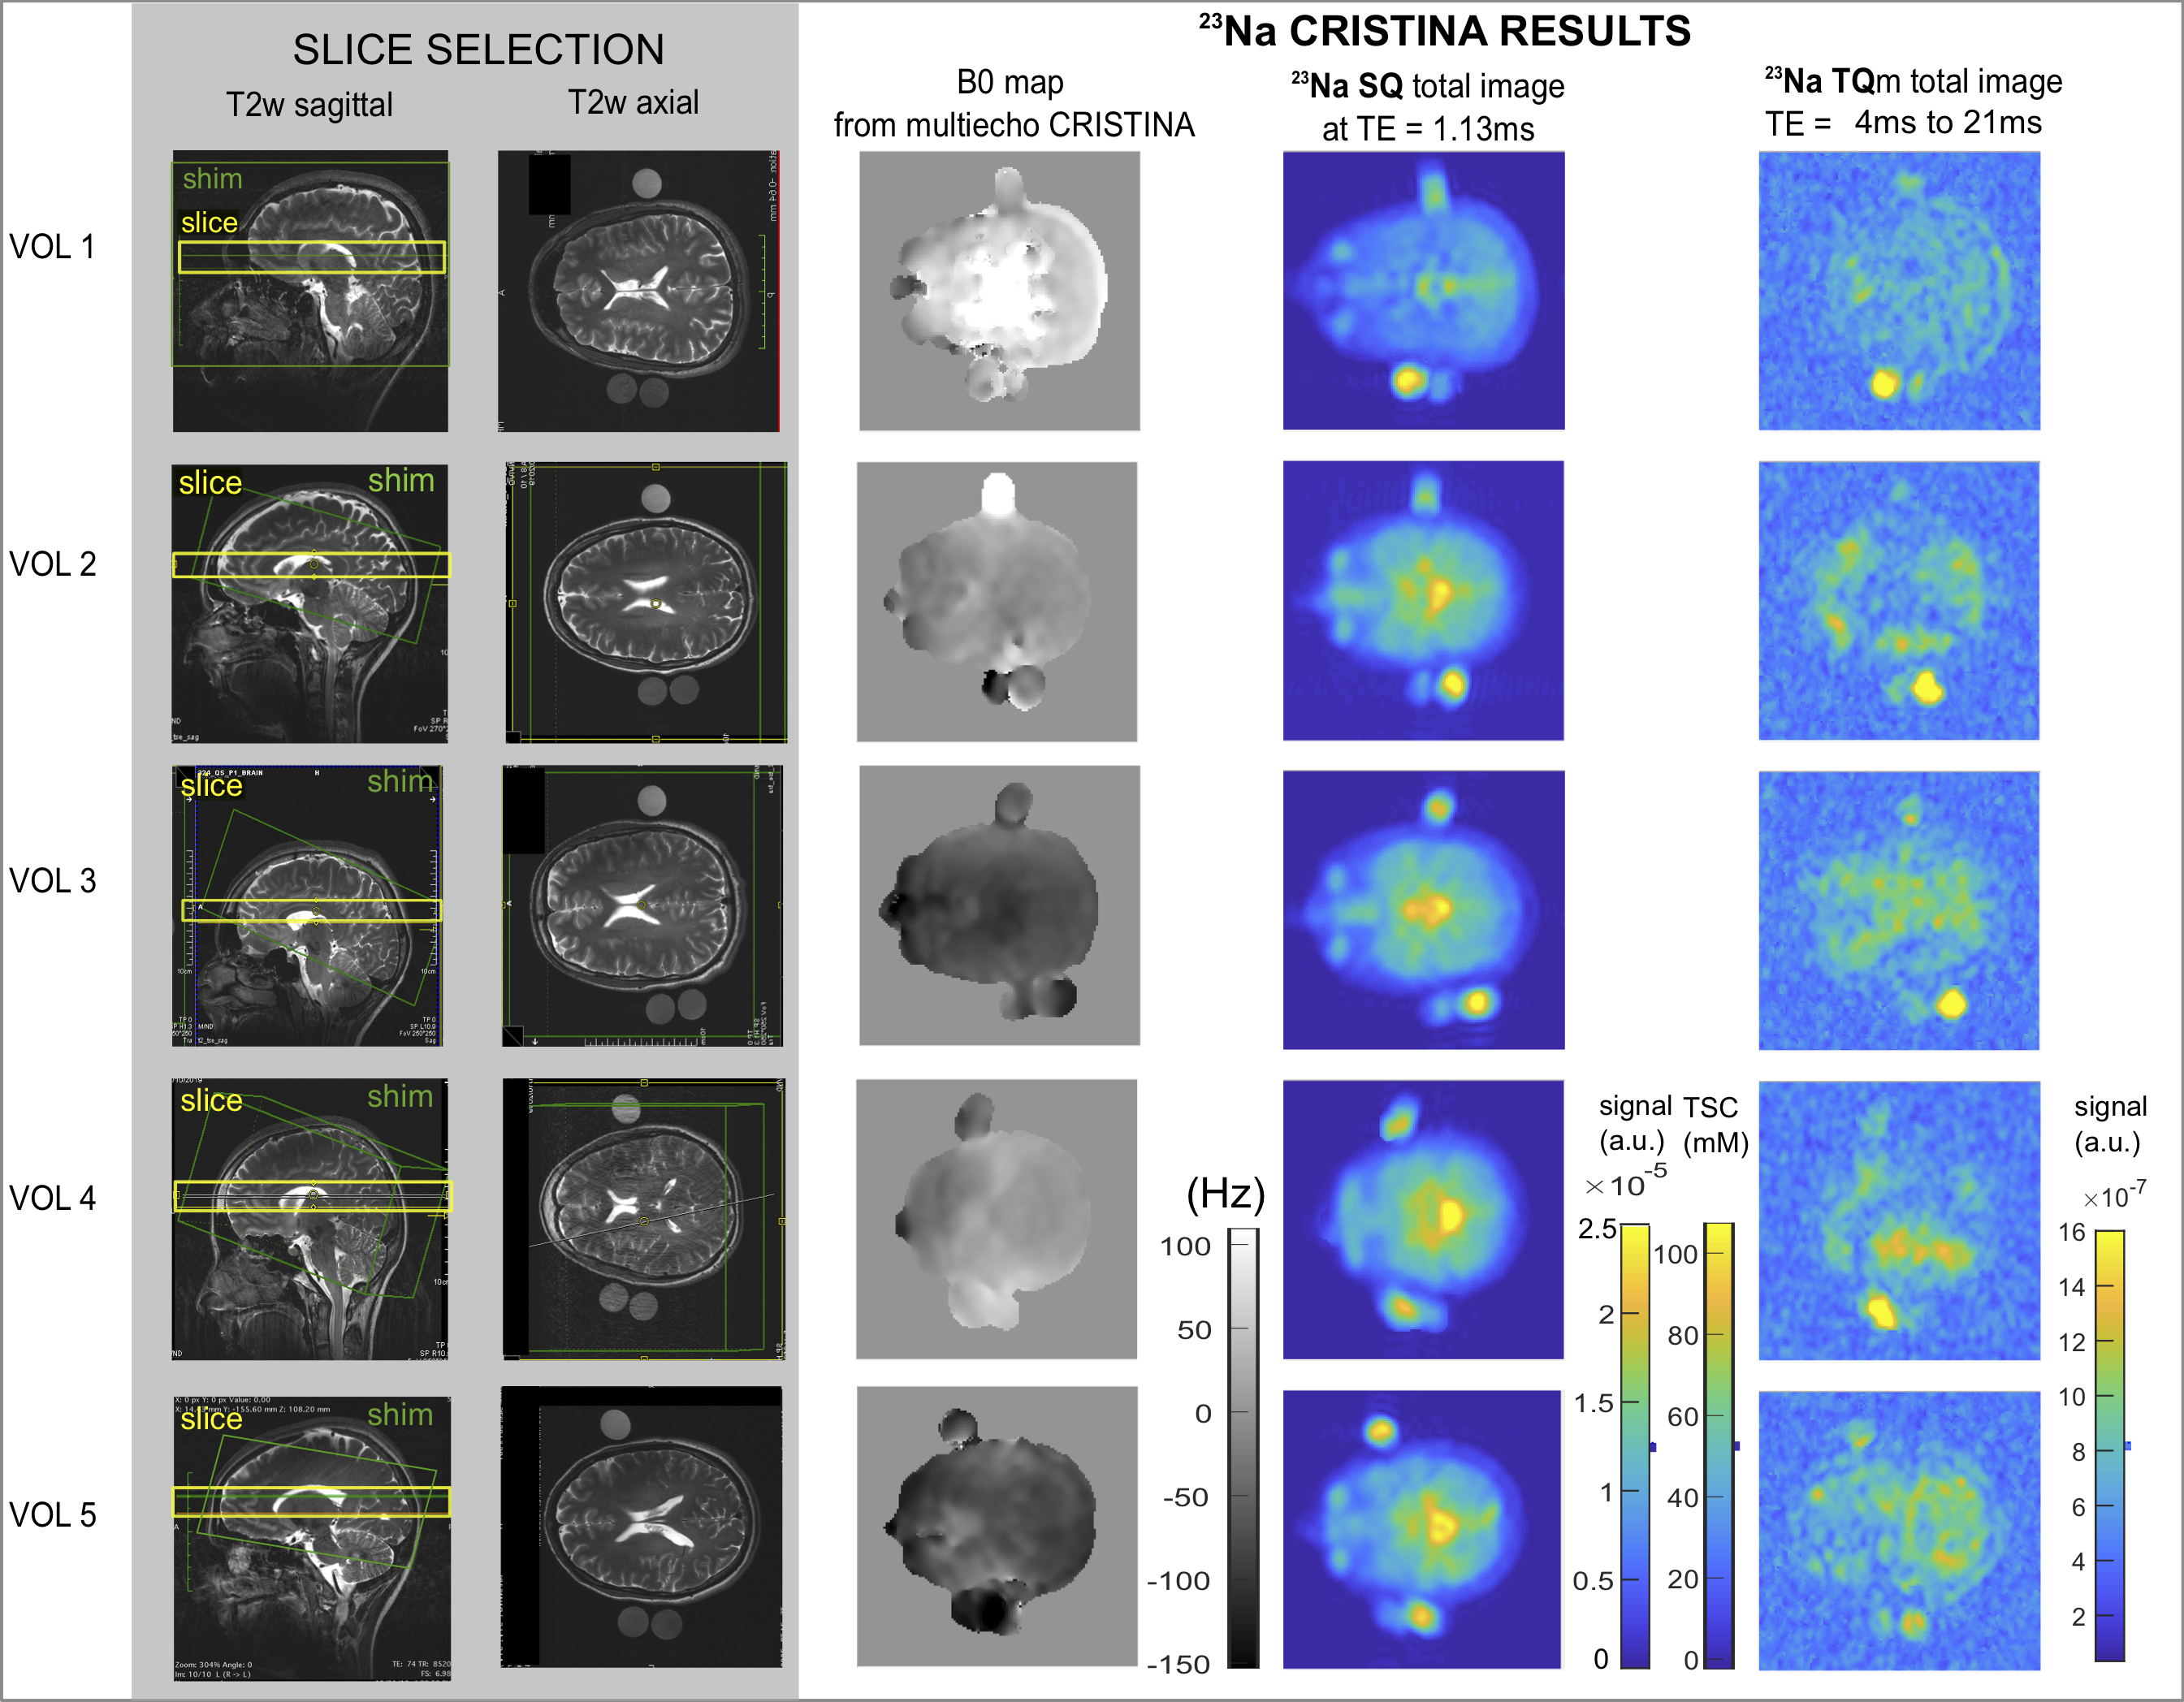
CRISTINA pipeline is shown for phantom in Figures3,4: raw images, along the phase cycle, are depicted and the result after pixel-wise FT at the frequency of interest (SQ,TQ). The reconstruction with Fleysher’s method, verified in the simulation results, resulted in total SQ and TQ-images (Figures3e,f). The multi-parameter fit of SQ and TQ signal evolution resulted in SQ-image estimation at TE=0ms, TSC calculation presumably without relaxation biases, and T2*slow and T2*fast parameter maps. Figure5 shows the results for 5 healthy volunteers for brain. We found a TQ signal comparable to the 2%agar,100mM and 4%agar,50mM phantom. In Volunteer1 and 5, the skin was notably more visible in the TQ image than in the SQ image. Comparison of volunteers and patients is warranted to discern TQ signal potential variations in diseased tissue.
CONCLUSION
In conclusion, multi-echo CRISTINA offered B0 corrected multi-echo SQ and TQ-images with visible TQ signal contrast in the phantoms and in vivo in the brain. TQ signal and T2* slow and fast maps, obtained by multi parameter fit, will be used to explore MQC-Na tissue parameters in volunteers and patients.Acknowledgements
Author Lothar R Schad and Author Stanislas Rapacchi contributed equally to this work.References
1. Fleysher L, Oesingmann N, Inglese M. B0 inhomogeneity-insensitive triple-quantum-filtered sodium imaging using a 12-step phase-cycling scheme. NMR Biomed. 2010
2. Fiege DP, Romanzetti S, Mirkes CC, Brenner D, Shah NJ. Simultaneous single-quantum and triple-quantum-filtered MRI of 23Na (SISTINA). Magn Reson Med. 2013
3. Schepkin VD, Neubauer A, Nagel AM, Budinger TF. Comparison of potassium and sodium binding in vivo and in agarose samples using TQTPPI pulse sequence. J Magn Reson. 2017
4. Jaccard G, Wimperis S, Bodenhausen G. Multiple-quantum NMR spectroscopy of S=3/2 spins in isotropic phase: A new probe for multiexponential relaxation. J Chem Phys. 1986
5. Marion D, Wüthrich K. Application of phase sensitive two-dimensional correlated spectroscopy (COSY) for measurements of 1 H-1 H spin-spin coupling constants in proteins. In: NMR in Structural Biology: A Collection of Papers by Kurt Wüthrich. World Scientific; 1995
6. Hoesl MAU, Kleimaier D, Hu R, et al. 23Na Triple-quantum signal of in vitro human liver cells, liposomes, and nanoparticles: Cell viability assessment vs. separation of intra- and extracellular signal. J Magn Reson Imaging. 2019
Figures
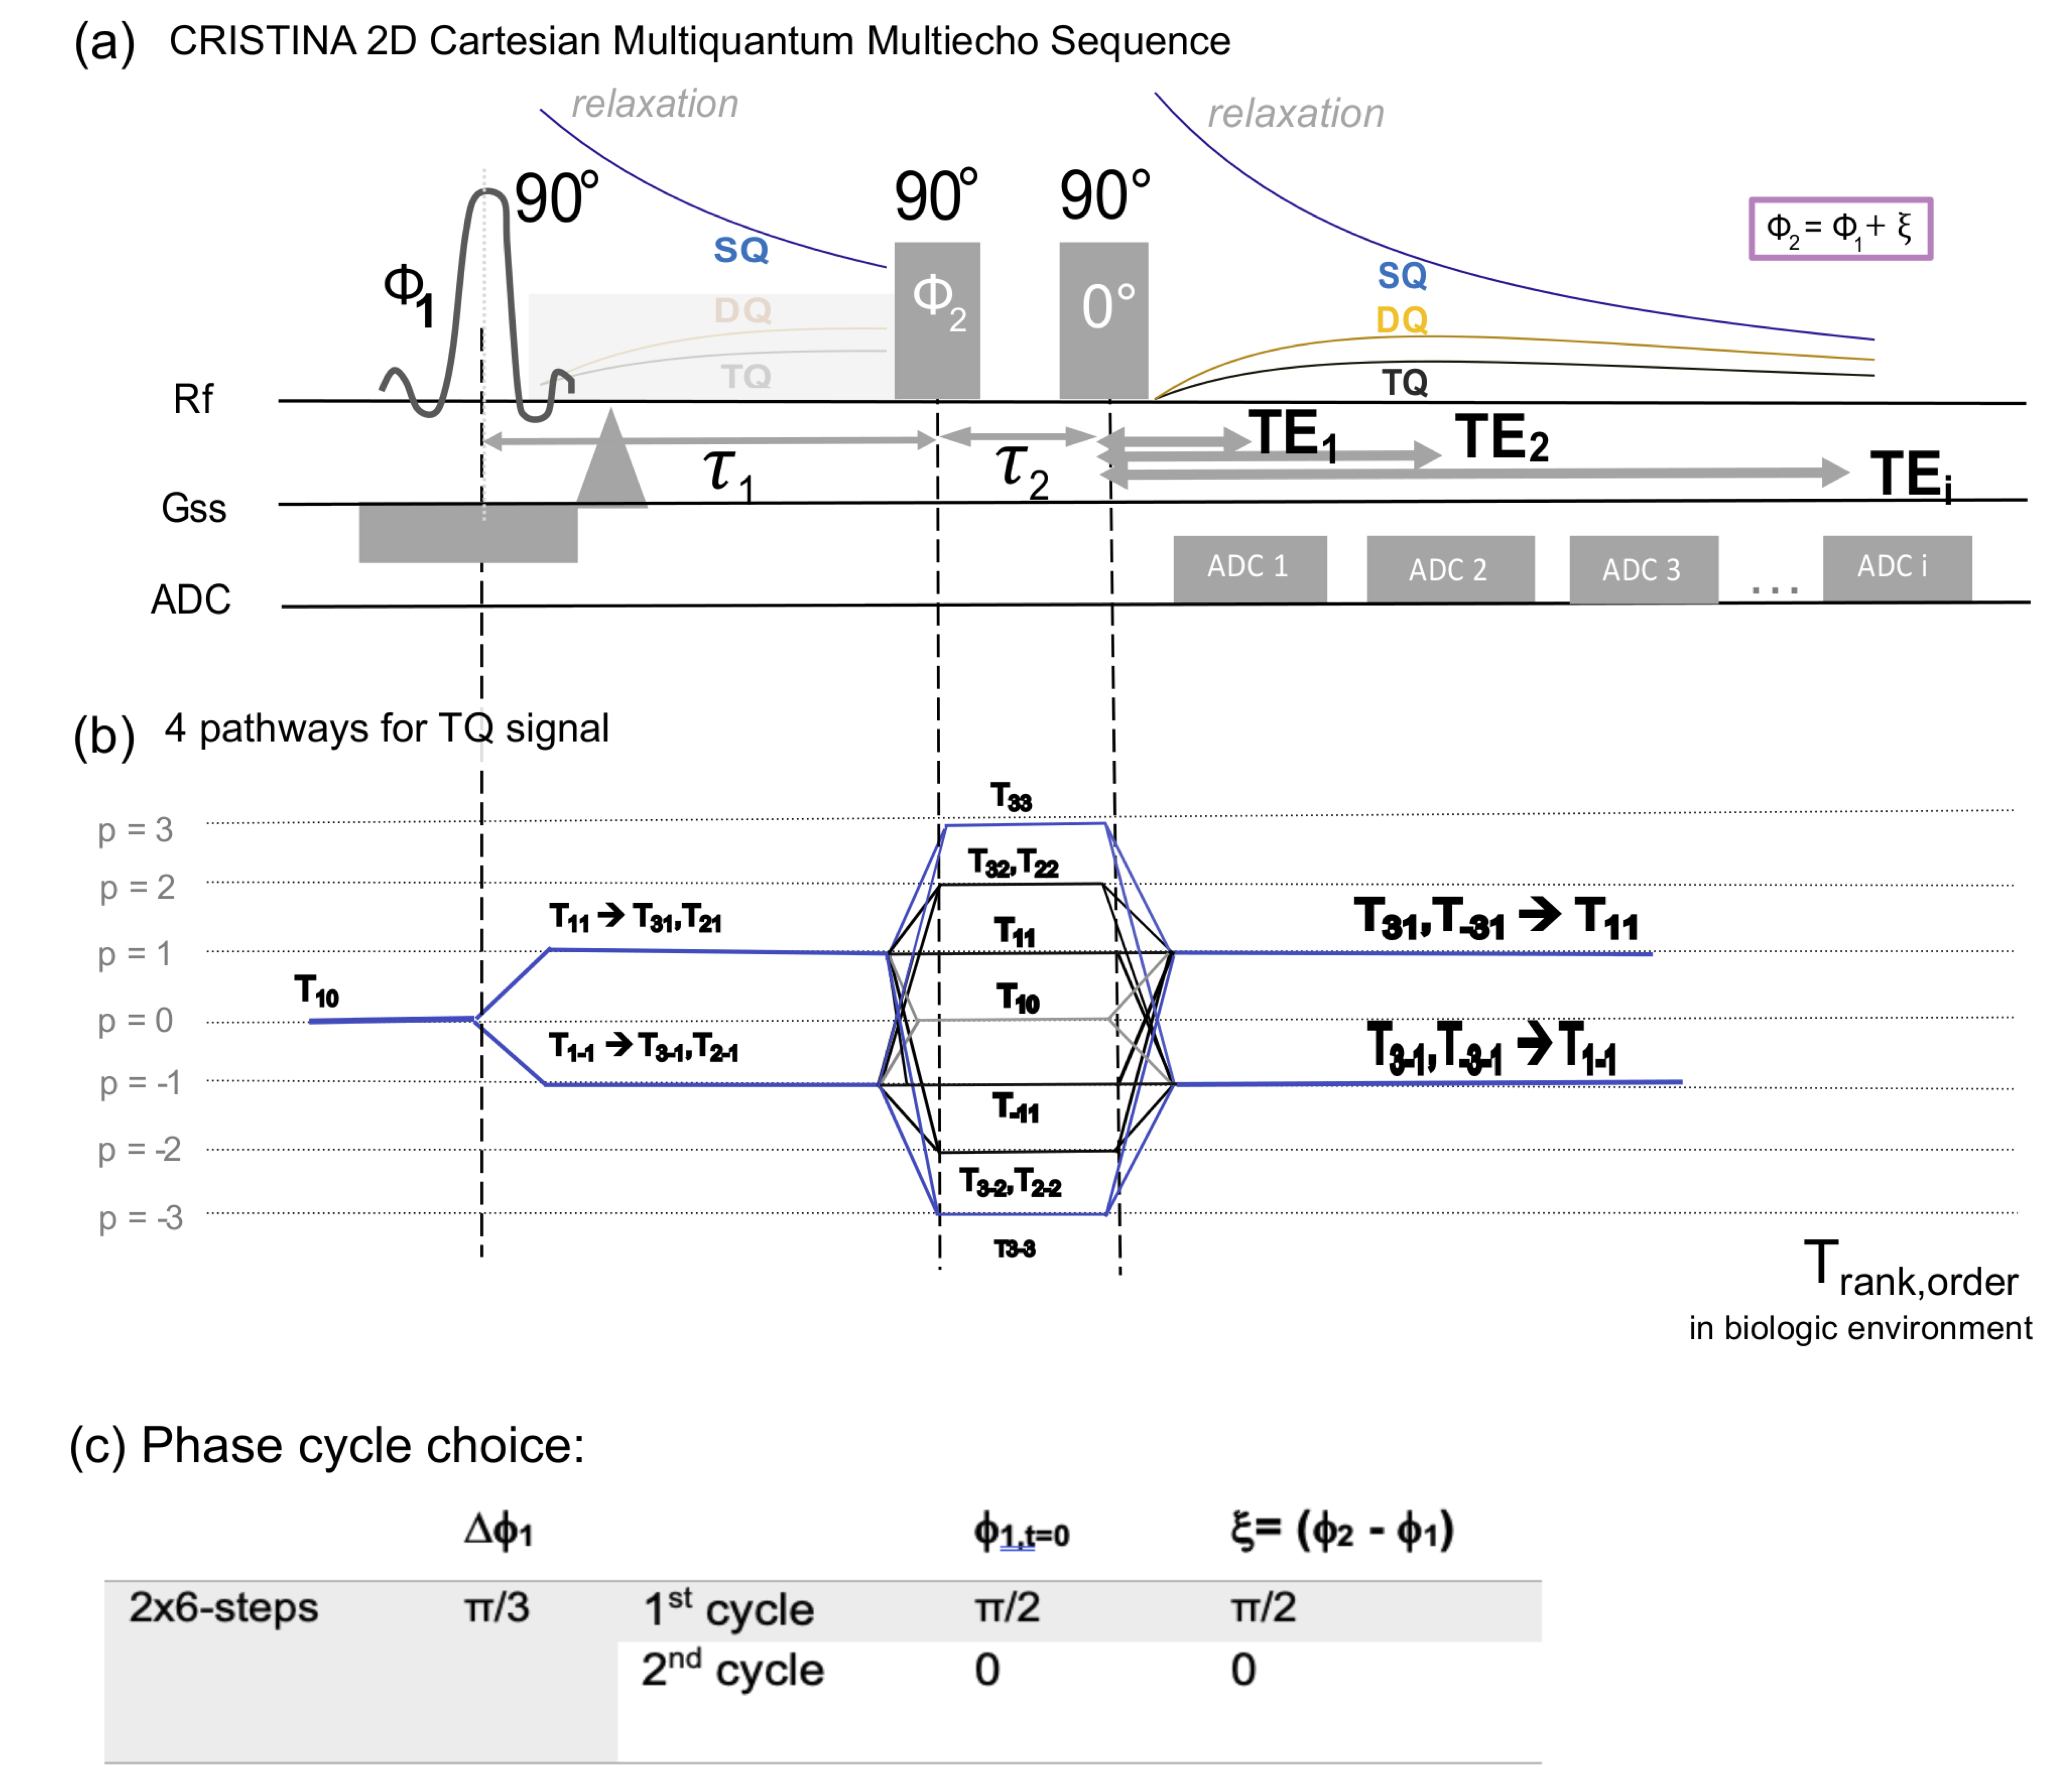
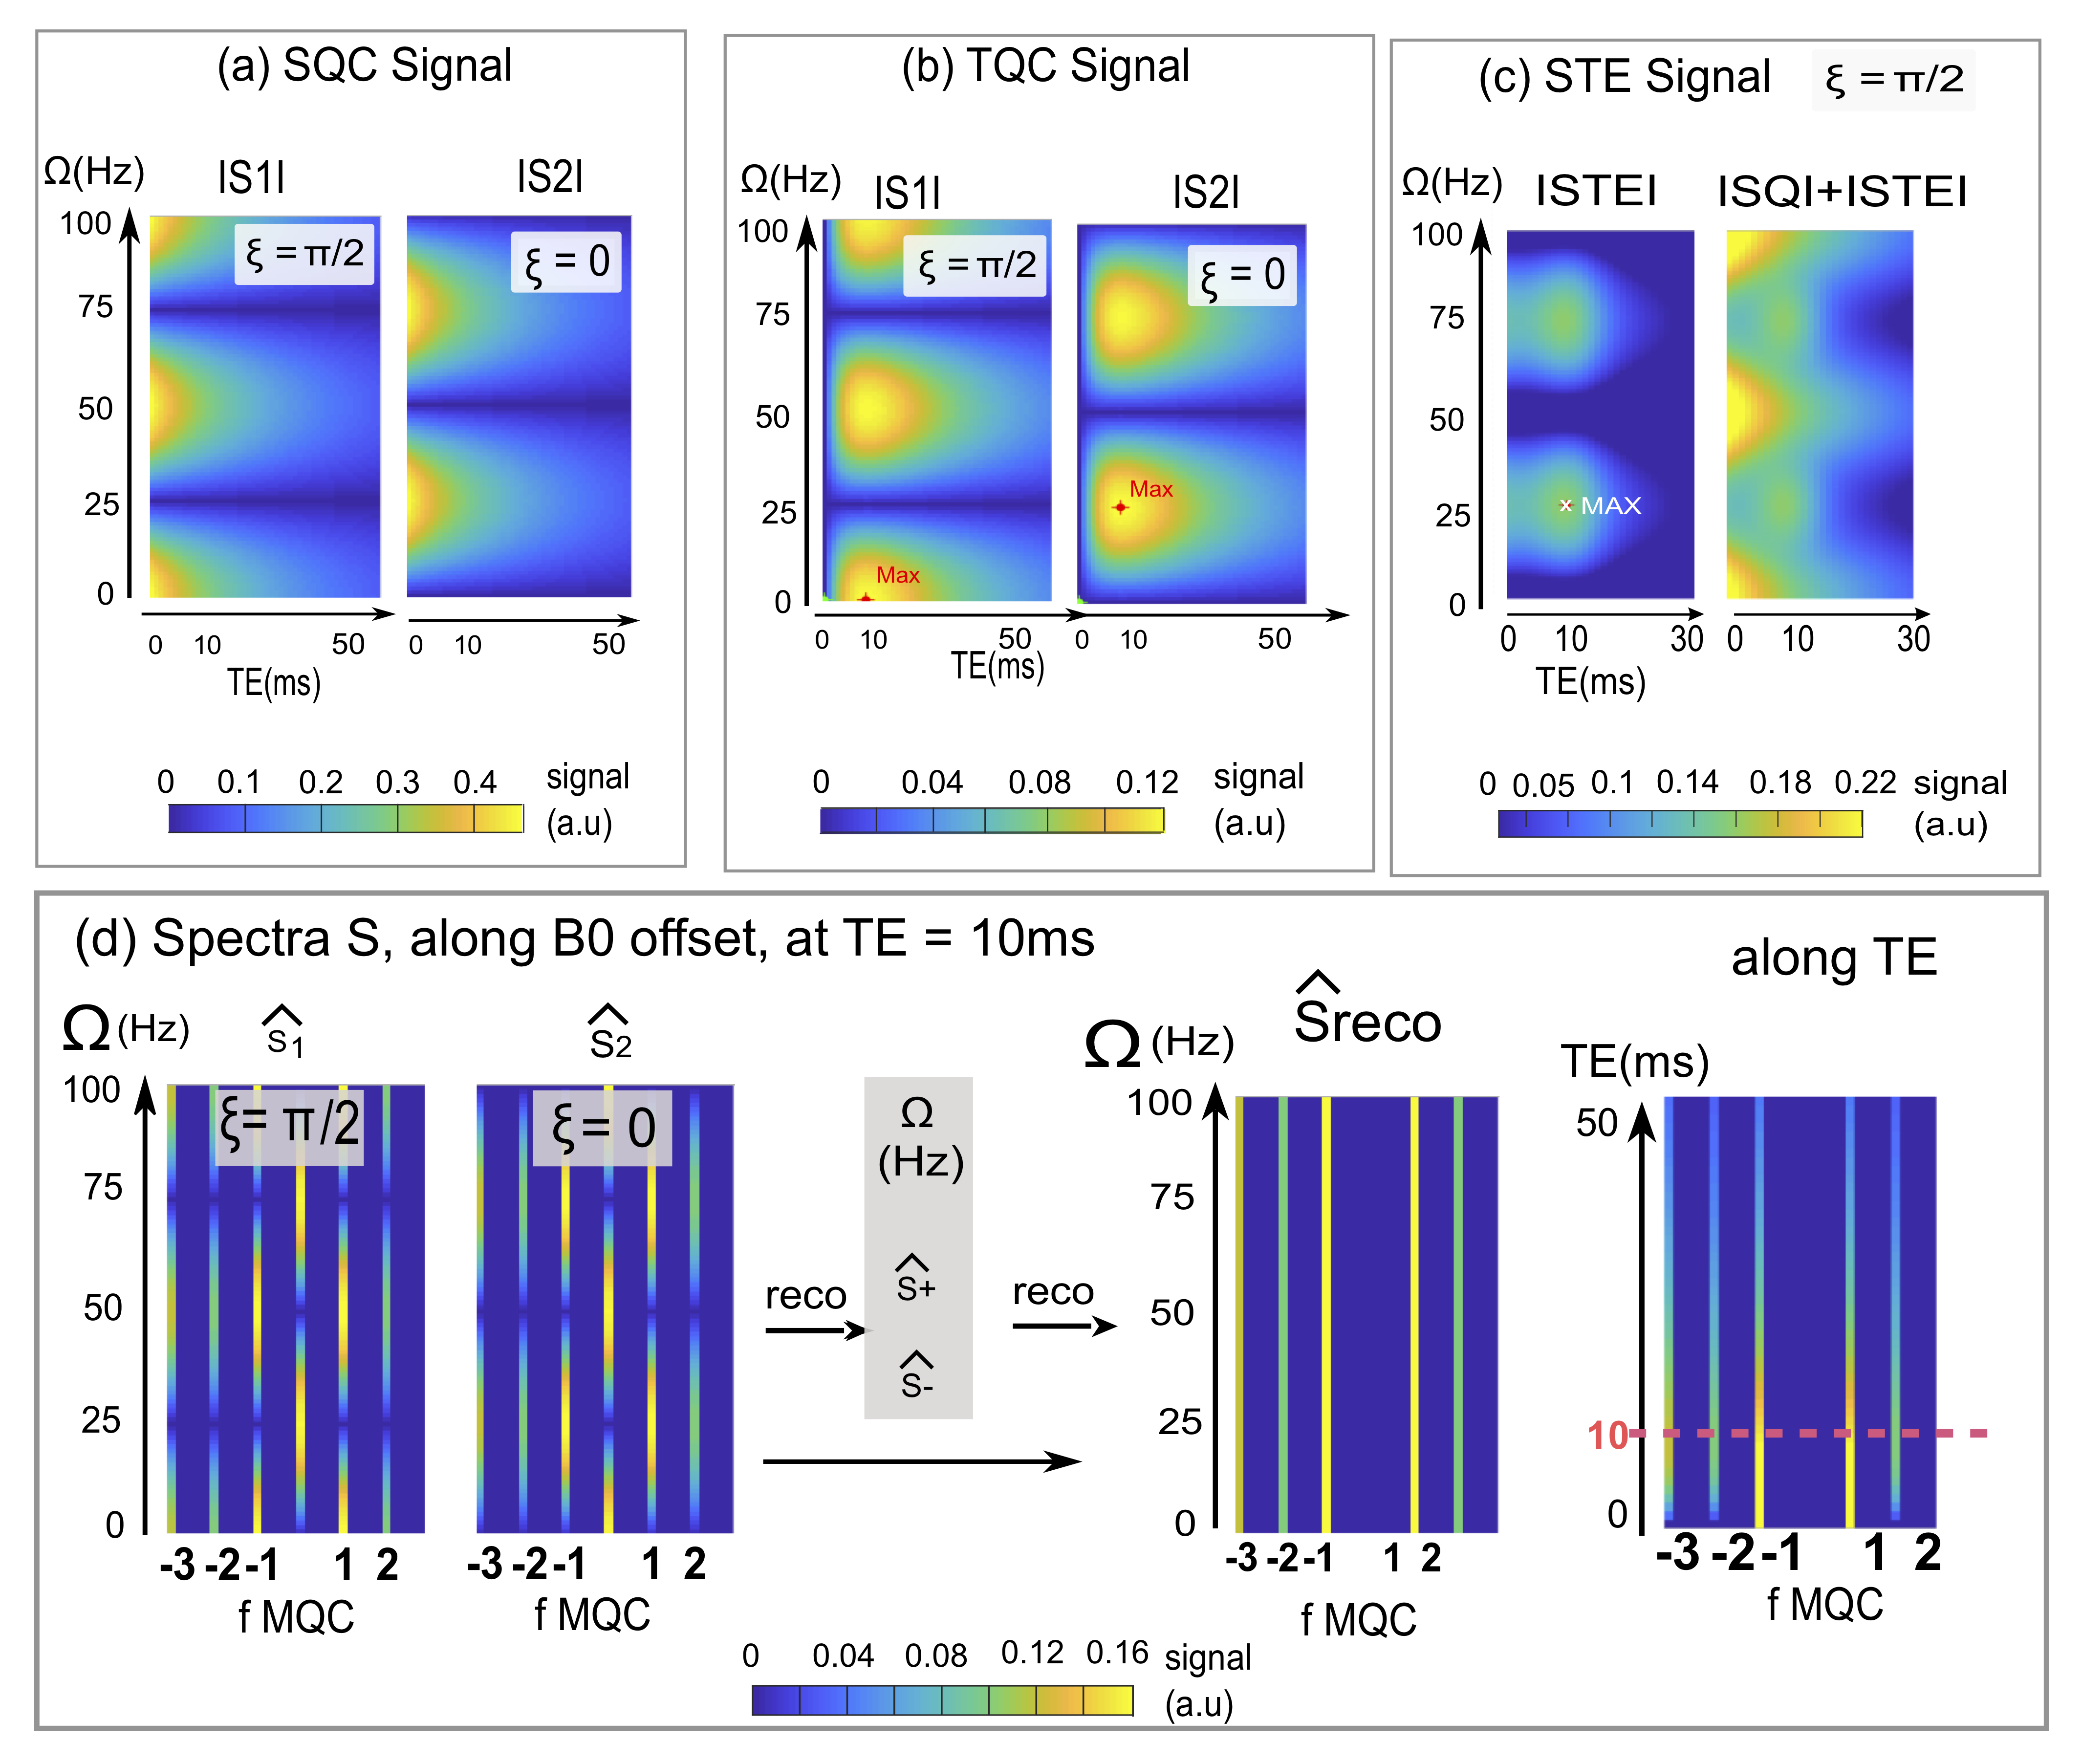
Figure2: (a), (b) Simulation of TQ, SQ coherences signals for the two phase cycles (ξ = π/2; 0) along echo time,TE, and B0 offset, Ω. An oscillating behavior was observed along Ω, which is opposite in the two phase cycles. Stimulated echo signal is presented in (c) for ξ = π/2, highlighting that its maximum coincided with the TQC signal maximum at 10ms, the signal overlays on the SQ signal. (d) Spectra after FT for the two cycles independently. TQ signal is at Nyquist limit for ∆Φ=π/3. The signal drop outs at periodic Ω values are visible which are mitigated after reconstruction.