3772
Snapshot Quantitative MRI: Application to Simultaneously T2 and T2* Mapping1Department of Electronic Science, Xiamen University, Xiamen, China, 2The Center for Brain Imaging Science and Technology, Zhejiang University, Zhejiang, China, 3Department of Imaging Sciences, University of Rochester, Rochester, NY, United States
Synopsis
Simultaneously quantifying T2 and T2* properties can provide great sensitivity and specificity to diseases. However, most of the existing methods are time-consuming. Here, we develop an overlapping-echo method for simultaneously achieving reliable T2 and T2* maps in a single shot. This method is robust to motion and the inhomogeneity of B0. Experimental results demonstrate that the resulting T2 and T2* values are in good agreement with those obtained with reference methods.
Introduction
Quantitative magnetic resonance imaging (qMRI) has the potential to make a great clinical impact on diagnostics, but the long acquisition time hinders its clinical application in routine MRI exams. To the best of our knowledge, overlapping-echo detachment (OLED) method1 is the fastest qMRI paradigm, which has previously been reported for quantitative mapping of T2,2 and apparent diffusion coefficient3 in a single shot. However, the previous methods only quantitatively examine one MR parameter in each shot. Meanwhile, the reconstructed parameter maps are distorted in inhomogeneous fields since OLED is sensitive to the B0 inhomogeneity. Here, we propose a new scheme to achieve T2 and T2* maps simultaneously and rectify the image distortion.Methods
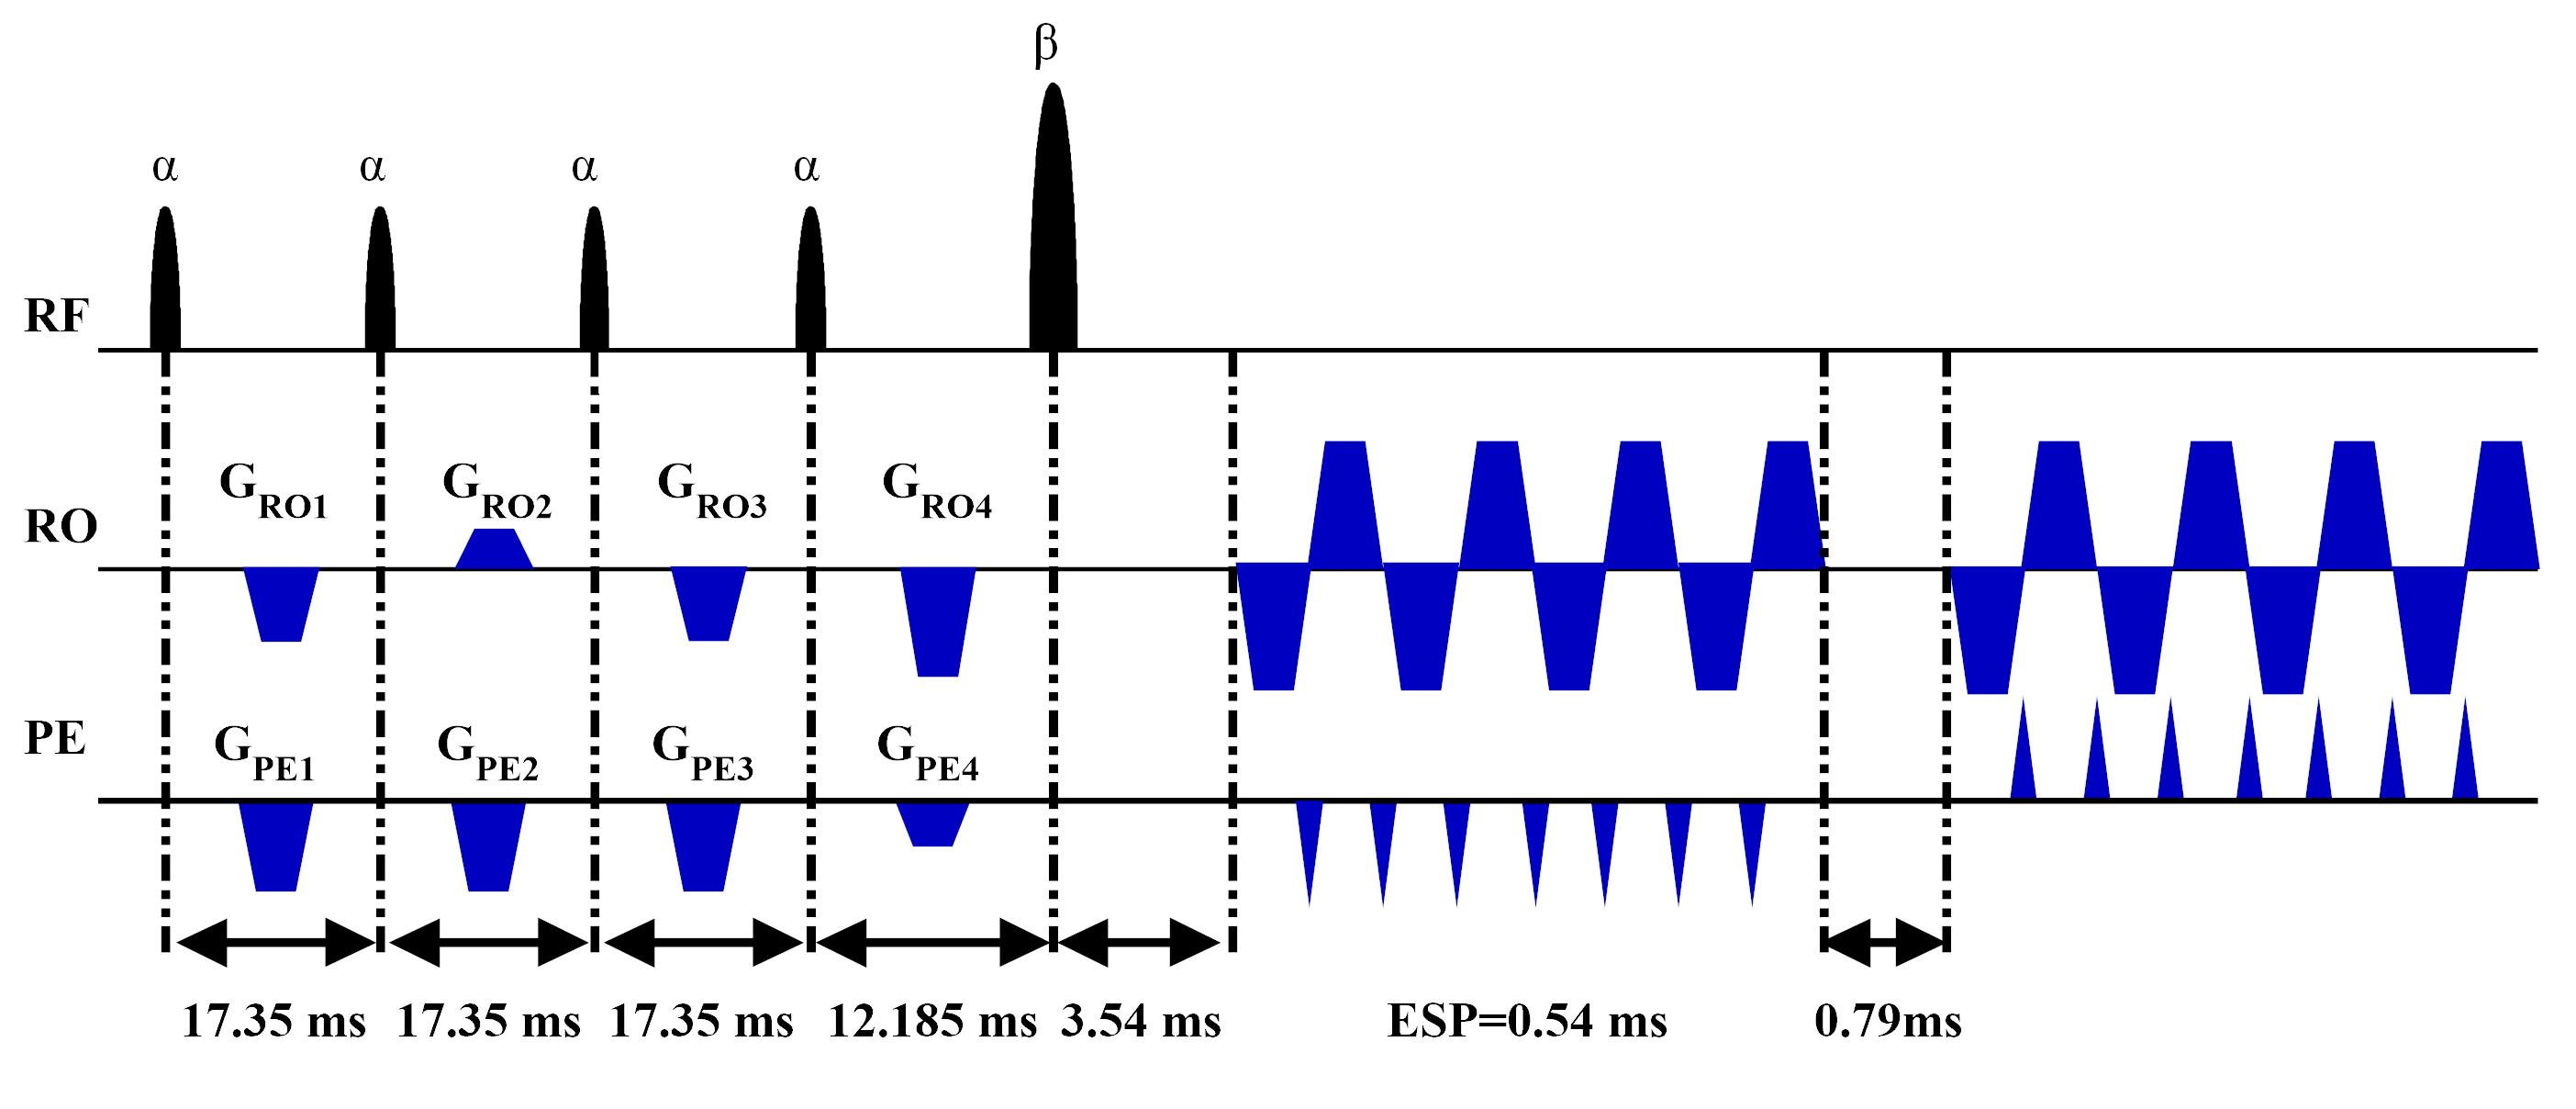
Our method includes three parts: pulse sequence design, training samples generation for deep neural network, and deep neural network based reconstruction.Pulse sequence design: The pulse sequence we designed is shown in Figure 1.
Training samples generation: The open source MRI simulation software (MRiLab) was used to generate the training samples. The pulse sequence and parameters used in simulation were the same as those used in experiments. The simulated imaged objects with various tissue properties (T2, T2*, and M0) were randomly filled with hundreds of different geometrical patterns. The inhomogeneity of B0 and B1 were also considered in simulation.
Reconstruction: U-Net was used to reconstruct the T2 and T2* maps from the acquired overlapping-echo images. At the training stage, we took the real and imaginary parts of two acquired images as input. Meanwhile the corresponding T2 or T2* map was taken as the label. At the testing stage, the experimental data were fed into the pre-trained U-Net to obtain the parameter maps.
Experiments: All MRI experiments were performed on a whole-body 3T MRI system. The accuracy of the proposed method was tested on water phantom and human brain. Multi-scan spin echo sequence was used to provide reference T2 maps, and gradient echo sequence to provide the reference T2* maps. The overlapping-echo acquisition was performed with generalized auto-calibrating partially parallel acquisitions (GRAPPA), and the acceleration factor was 2, with 24 auto-calibrating signal lines. The flip angle of the pulses are α = 30° and β = 180°.
Results
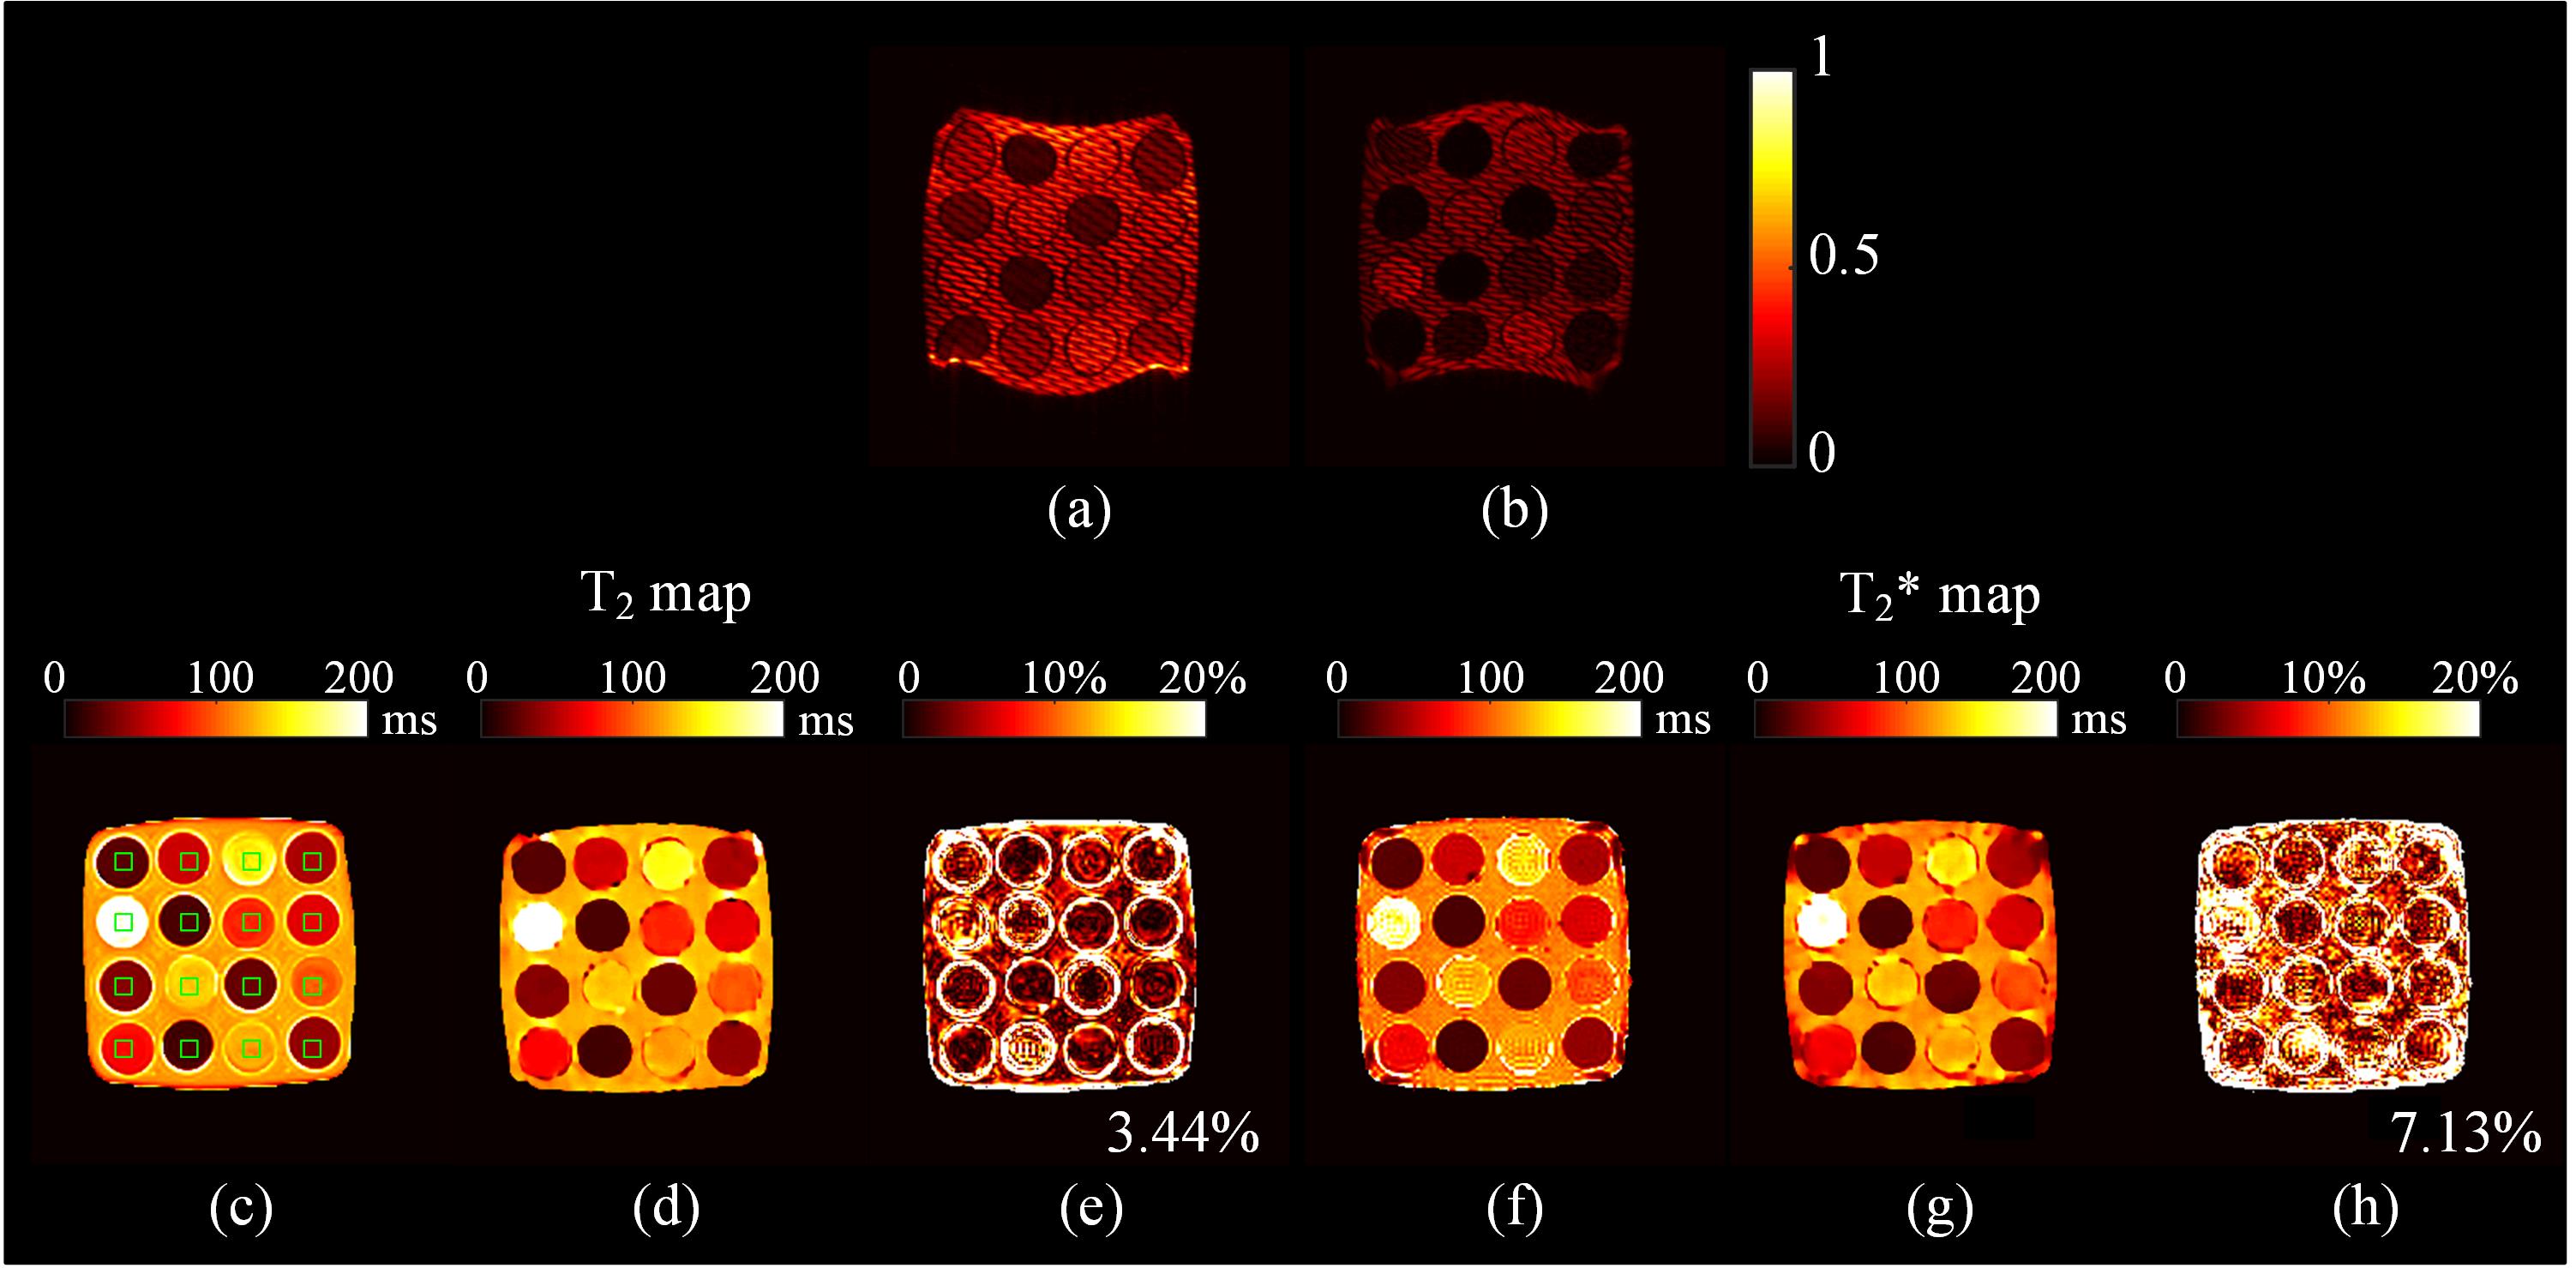
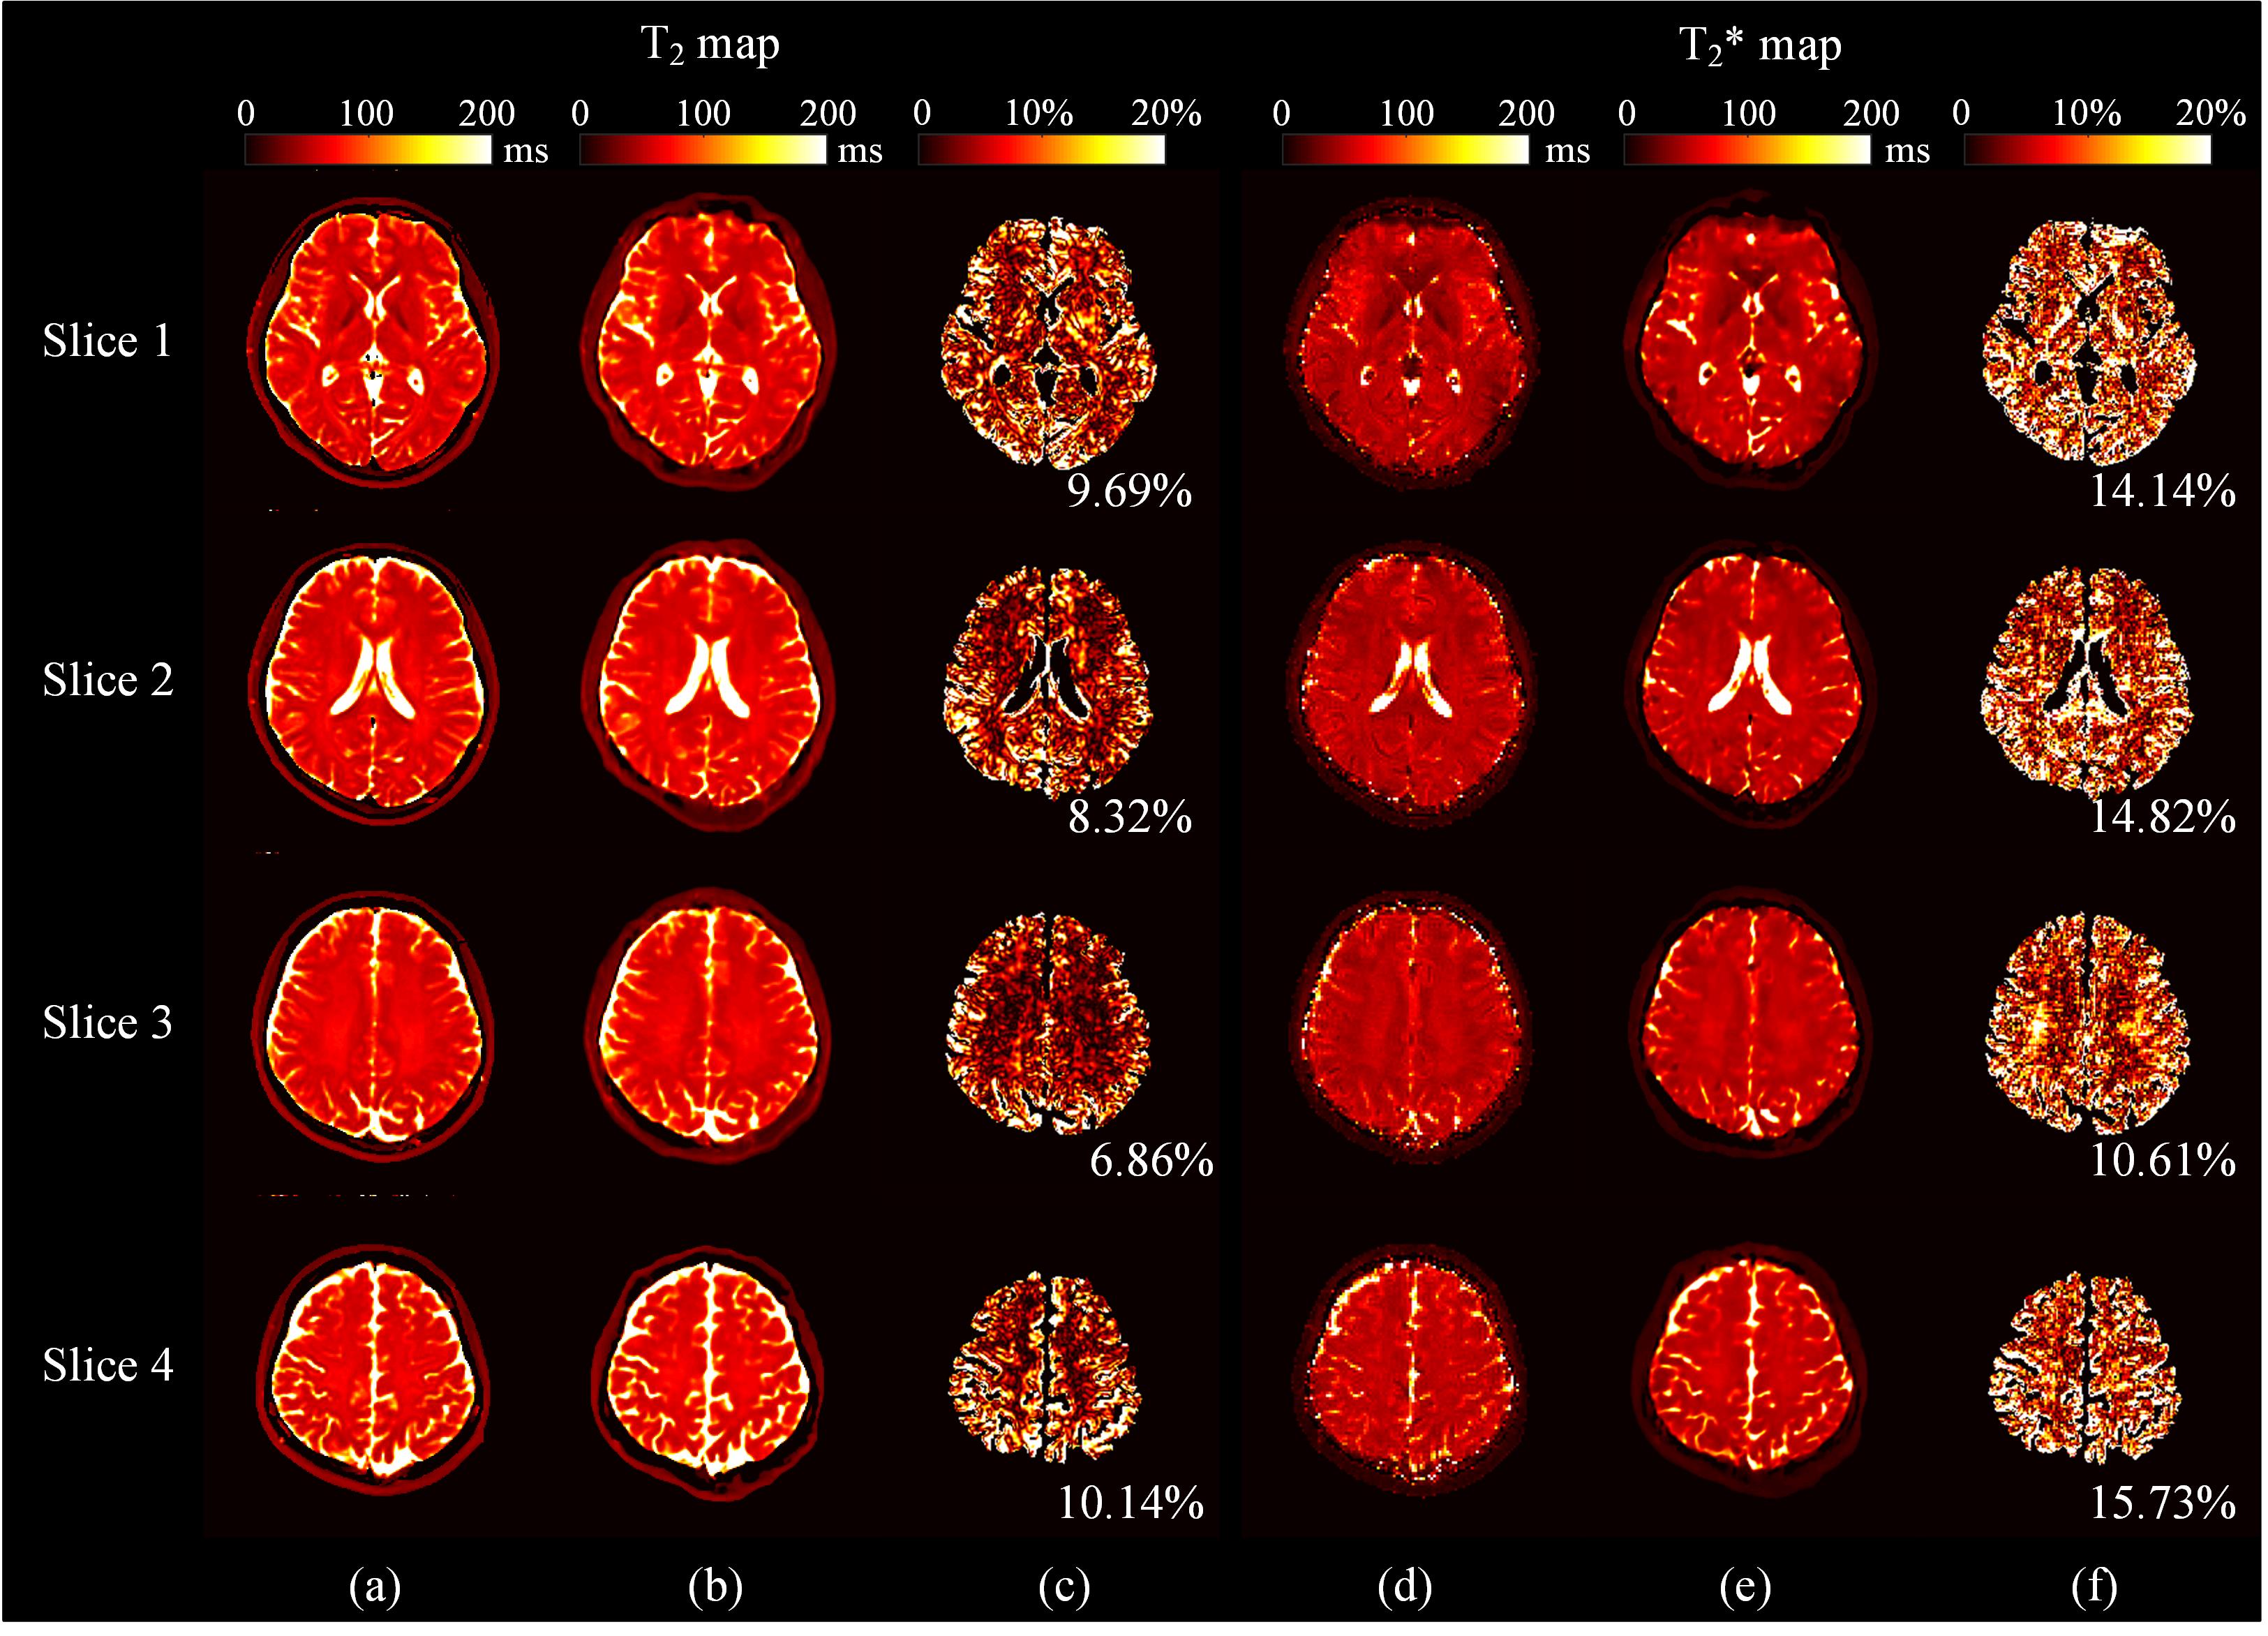
The reconstructed T2 and T2* maps were compared with the references. It is found that the T2 and T2* maps from the new method agree well with the references. For water phantom (Figure 2), the acquired images possess opposite distortion. However, since the B0 inhomogeneity was considered in simulation, the distortion can be rectified after deep neural network reconstruction. The R2 coefficient of determination of all the pixels in the green rectangles (Figure 2c) between our method and references are 0.998 and 0.994 for T2 and T2* respectively, while the R2 for magnetic resonance fingerprinting (MRF) are 0.997 and 0.972 accordingly.4 In Figure 3, representative slices from human brain are demonstrated. Our method provides comparable results with MRF, whose mean error is about 5% in phantom5 and about 9% in human brain6 of T2 maps.Conclusion
In this work, we proposed an efficient qMRI method for T2 and T2* mapping simultaneously in a single shot. Experimental results demonstrate that our method can provide comparable results with reference methods.Acknowledgements
This work was supported by the National Natural Science Foundation of China under grant numbers 11775184 and 81671674.References
[1] Cai CB, Zeng YQ, Zhuang YC, et al. Single-shot T2 mapping through overlapping-echo detachment (OLED) planar imaging. IEEE Trans. Biomed. Engineering, 2017; 64: 2450-2461.
[2] Zhang J, Wu J, Chen SJ, et al. Robust single-shot T2 mapping via multiple overlapping-echo acquisition and deep neural network. IEEE Trans. Med. Imaging, 2019; 38: 1801-1811.
[3] Ma LC, Cai CB, Yang HY, et al. Motion-tolerant diffusion mapping based on single-shot overlapping-echo detachment (OLED) planar imaging. Magn. Reson. Med., 2018; 80: 200-210.
[4] Wang CY, Coppo S, Mehta BB, et al. Magnetic resonance fingerprinting with quadratic RF phase for measurement of T2* simultaneously with δf, T1, and T2. Magn. Reson. Med., 2018; 81: 1849-1862.
[5] Zhao B, Haldar JP, Liao C, et al. Optimal experiment design for magnetic resonance fingerprinting: Cramer-Rao bound meets spin dynamics. IEEE Trans. Med. Imaging, 2019; 38: 844-861.
[6] Fang ZH, Chen Y, Liu MX, et al. Deep learning for fast and spatially-constrained tissue quantification from highly-accelerated data in magnetic resonance fingerprinting. IEEE Trans. Med. Imaging, 2019; 38: 2364-2374.
Figures