3771
Blood Flow and Permeability Imaging in a Rat Stroke Model Using 3D Compressed-Sensing DCE-MRI1Institute of Scientific Instruments of the CAS, Brno, Czech Republic, 2Utah Center for Advanced Imaging and Research, University of Utah, Salt Lake City, UT, United States, 3University of Veterinary and Pharmaceutical Sciences Brno, Brno, Czech Republic
Synopsis
The main challenge of using DCE-MRI in stroke in combination with advanced pharmacokinetic models is the need for high temporal resolution, whole-brain coverage and a low SNR (especially in small-animal MRI) of the DCE signal (compared to DSC, due to the BBB and low fractional blood volume in brain). In this pilot study we test if compressed sensing could help solve these challenges.
Introduction
MRI perfusion imaging in acute stroke patients is mostly done using dynamic susceptibility contrast (DSC) MRI or arterial spin labeling (ASL). Several studies1,2,3 have applied dynamic contrast-enhanced (DCE) MRI to assess permeability of the blood brain barrier (BBB), which is related to the risk of hemorrhage during tPA treatment, thus might provide a selection criterion for tPA treatment. These methods are mostly based on the Patlak pharmacokinetic (PK) model4 providing estimates of permeability surface area product (PS) and plasma volume (vp). Use of a more complex PK model, such as the 2-compartment exchange (2CX) or the 2-compartment uptake (2CU) model5 would provide estimates of plasma flow (Fp) in addition, so that DCE-MRI could be an alternative to DSC-MRI (provides only relative Fp estimates) and ASL. These more complex models have been used mostly for tumors. Exceptionally, they have been applied to normal6 and multiple-sclerosis brain tissue7 but not in stroke patients or animals (except for a test on three stroke patients8).The main problem of these PK models in stroke is the need for high temporal resolution (1-2 s/volume), whole-brain coverage and a low SNR of the DCE signal (compared to DSC, due to the BBB and low vp in brain). Here we test if compressed sensing (CS) could solve the mentioned challenges.
Methods
Five Wistar rats were imaged: two normal rats and three rats with acute stroke induced by occluding the middle cerebral artery (MCA) by artificial clots (fibrin glue, TISSEEL set, Baxter), approved by the National Animal Research Authority. MRI was performed with a 9.4T scanner (Bruker Biospin MRI, Germany) using time-of-flight angiograpgy, T2-weighted spin-echo MRI, DWI, ASL (FAIR RARE), CS-DCE (3D golden-angle stack-of-stars9, TR/TE=5.5/1.3ms, FA:15°, matrix:128x128x11, acquisition:10min, Magnevist) and DSC (only in stroke rats, 2D GE EPI, TR/TE=1000/16ms, matrix:128x128x11, acquisition:10min, Magnevist). MRI of stroke rats was followed by histology - triphenyl tetrazolium chloride (TTC) staining. DCE image sequence reconstruction was done using total-variation regularization10 with experimentally set weights of in-slice and temporal regularization. DCE analysis was based on blind-deconvolution estimation of the arterial input function11 and approximation with a 1-compartment (assuming intact BBB) and 2CX PK models. Voxel-based model selection was done using the Akaike information criterion12,6.Results
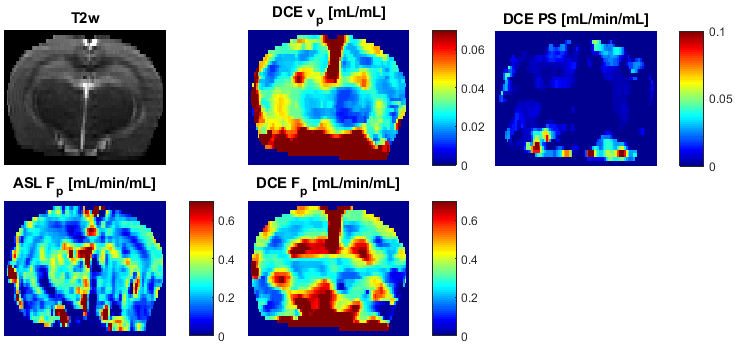
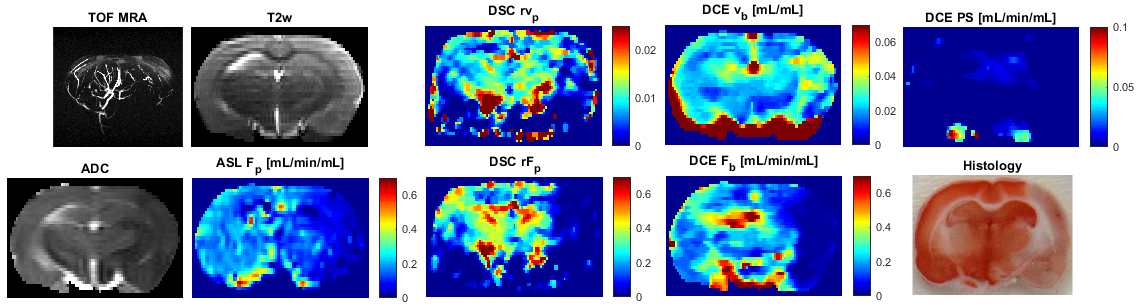
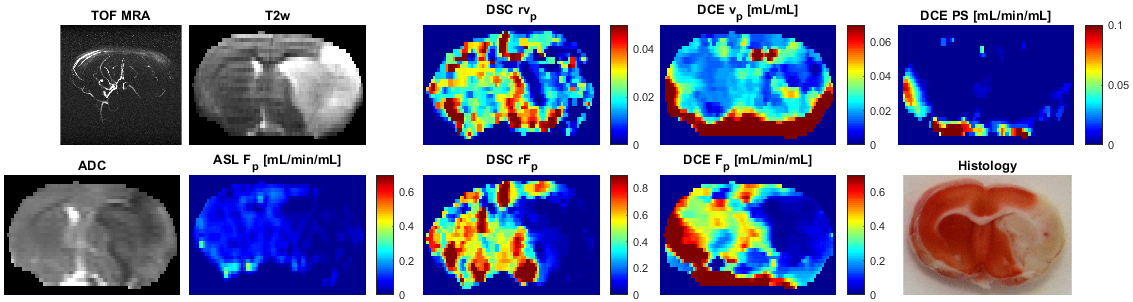
In normal rats, the DCE maps were fairly symmetric, consistent with ASL (DSC not measured), showing similar structures and range of Fp values (Fig.1). The DCE perfusion maps of the stroke animals (Figs.2,3) were consistent with DSC and ASL concerning the position of the normal-appearing and ischemic regions, also in line with ADC, T2w and MRA images.The maps of PS need to be assessed in the follow-up work.Discussion
According to the structures shown by the DCE maps, the stroke lesions seem to be clearly visible on the Fp maps, not so clearly in the vp maps.The range of Fp and vp is according to literature values. The lower quality of the DCE perfusion maps, especially in areas further from the surface coil is mainly due to low SNR which was at the limit of applicability. A solution to this problem might be use of a cryoprobe. An alternative would be use more receiving channels (a 4-channel coil used here). Furthermore, aggregation of variable number of spokes to reconstruct volumes with variable spatio-temporal resolution/SNR will be investigated. Also, PS will need to be evaluated more thoroughly, with tests on more subjects, with potentially known status of the BBB.Conclusion
This pilot study showed that simultaneous assessment of flow and permeability in stroke might be possible with small-animal MRI when using compressed sensing acquisition and image reconstruction. Compared to DSC, this should provide absolute quantification of Fb, and, compared to ASL, estimates of PS will provide a possible marker for hemorrhage risk of the following treatment.Acknowledgements
This work was supported by the Czech Health Research Council (grant no. 16-30299A), by the Ministry of Education, Youth, and Sports of the Czech Republic (project No. CZ.02.1.01/0.0/0.0/16_013/0001775) and NIH R01HL135328.References
1. Merali Z, Huang K, Mikulis D, et al. Evolution of blood-brain-barrier permeability after acute ischemic stroke. PLoS ONE. 2017;12(2):1–11.
2. Kassner A, Roberts T, Taylor K, et al. Prediction of hemorrhage in acute ischemic stroke using permeability MR imaging. American Journal of Neuroradiology. 2005;26(9):2213–2217.
3. Heye AK, Culling RD, Hernández MCV, et al. Assessment of blood-brain barrier disruption using dynamic contrast-enhanced MRI. A systematic review. NeuroImage: Clinical. 6:262–274.
4. Patlak CS, Blasberg RG, Fenstermacher JD. Graphical evaluation of blood-to-brain transfer constants from multiple-time uptake data. J. Cereb. Blood Flow Metab. 1983;3(1):1–7.
5. Sourbron SP, Buckley DL. Classic models for dynamic contrast-enhanced MRI. NMR in biomedicine 2013;26(8):1004–27
6. Sourbron SP, Ingrisch M, Siefert A, et al. Quantification of cerebral blood flow, cerebral blood volume, and blood-brain-barrier leakage with DCE-MRI. Magn Reson Med. 2009;62(1):205–217.
7. Ingrisch M, Sourbron SP, Morhard D, et al. Quantification of Perfusion and Permeability in Multiple Sclerosis. Investigative Radiology. 2012;47(4):252–258.
8. Nadav G, Liberman G, Artzi M, et al. Optimization of two-compartment-exchange-model analysis for dynamic contrast-enhanced MRI incorporating bolus arrival time. Journal of Magnetic Resonance Imaging. 2017;45(1):237–249.
9. Feng L, Grimm R, Block KT, et al. Golden-angle radial sparse parallel MRI: combination of compressed sensing, parallel imaging, and golden-angle radial sampling for fast and flexible dynamic volumetric MRI. Magn Reson Med. 2014;72(3):707–717.
10. Mendes JK, Adluru G, Likhite D, et al. Quantitative 3D myocardial perfusion with an efficient arterial input function. Magn Reson Med. 2019;00:1–15.
11. Jiřík R, Taxt T, Macíček O, et al. Blind deconvolution estimation of an arterial input function for small animal DCE-MRI. Magnetic Resonance Imaging. 2019;62:46–56.
12. Akaike H. A new look at the statistical model identification. IEEE Transactions on Automatic Control. 1974;19(6):716–723.
Figures