3770
Three-Dimensional Free-breathing Whole-Liver Simultaneous T1, R2*, and Fat-Fraction Quantification Using MR Multitasking1Biomedical Imaging Research Institute, Cedars-Sinai Medical Center, Los Angeles, CA, United States, 2Bioengineering, University of California, Los Angeles, Los Angeles, CA, United States, 3Siemens Healthcare, Los Angeles, CA, United States, 4Siemens Healthcare, Austin, TX, United States
Synopsis
Quantitative MRI has been playing a key role in the assessment and characterization of liver. However, current applications are still facing technical challenges. In this work, we proposed a novel technique based on MR Multitasking, which enables simultaneous T1, R2*, and FF quantification in one scan with free-breathing acquisition, 3D whole-liver coverage, and sufficient spatial resolution. The feasibility of the proposed method were demonstrated on the volunteer study (N = 8), showing that the T1, R2*, and FF quantification was repeatable in vivo and consistent with the results from the reference methods.
Introduction
Liver diseases represent a major health problem with a prevalence of 4.5% to 9% worldwide1. In recent years, quantitative MRI has been widely investigated and applied to the assessment and characterization of liver morphology and function. T1 mapping has been reported to be feasible to assess liver fibrosis, cirrhosis and their severity2,3. Multi-echo acquisition with simultaneous fat-fraction (FF) and R2* quantification has also been widely used to evaluate liver fat and iron overload4. Despite these encouraging results, current liver MRI for multiparametric mapping continues to face technical challenges: 1) breath-holds are usually required to minimize respiratory motion artifacts; 2) compromises are usually made between coverage and spatial resolution; 3) separate scans for R2*+FF and T1 mapping are required, which can lead to mis-registration between breath-holds. To address these limitations, we propose a novel MRI technique that enables simultaneous T1, R2*, and FF quantification in one scan with free-breathing acquisition, 3D whole-liver coverage, and sufficient spatial resolution using MR Multitasking5. This work demonstrates the in-vivo feasibility of this new technique.Methods
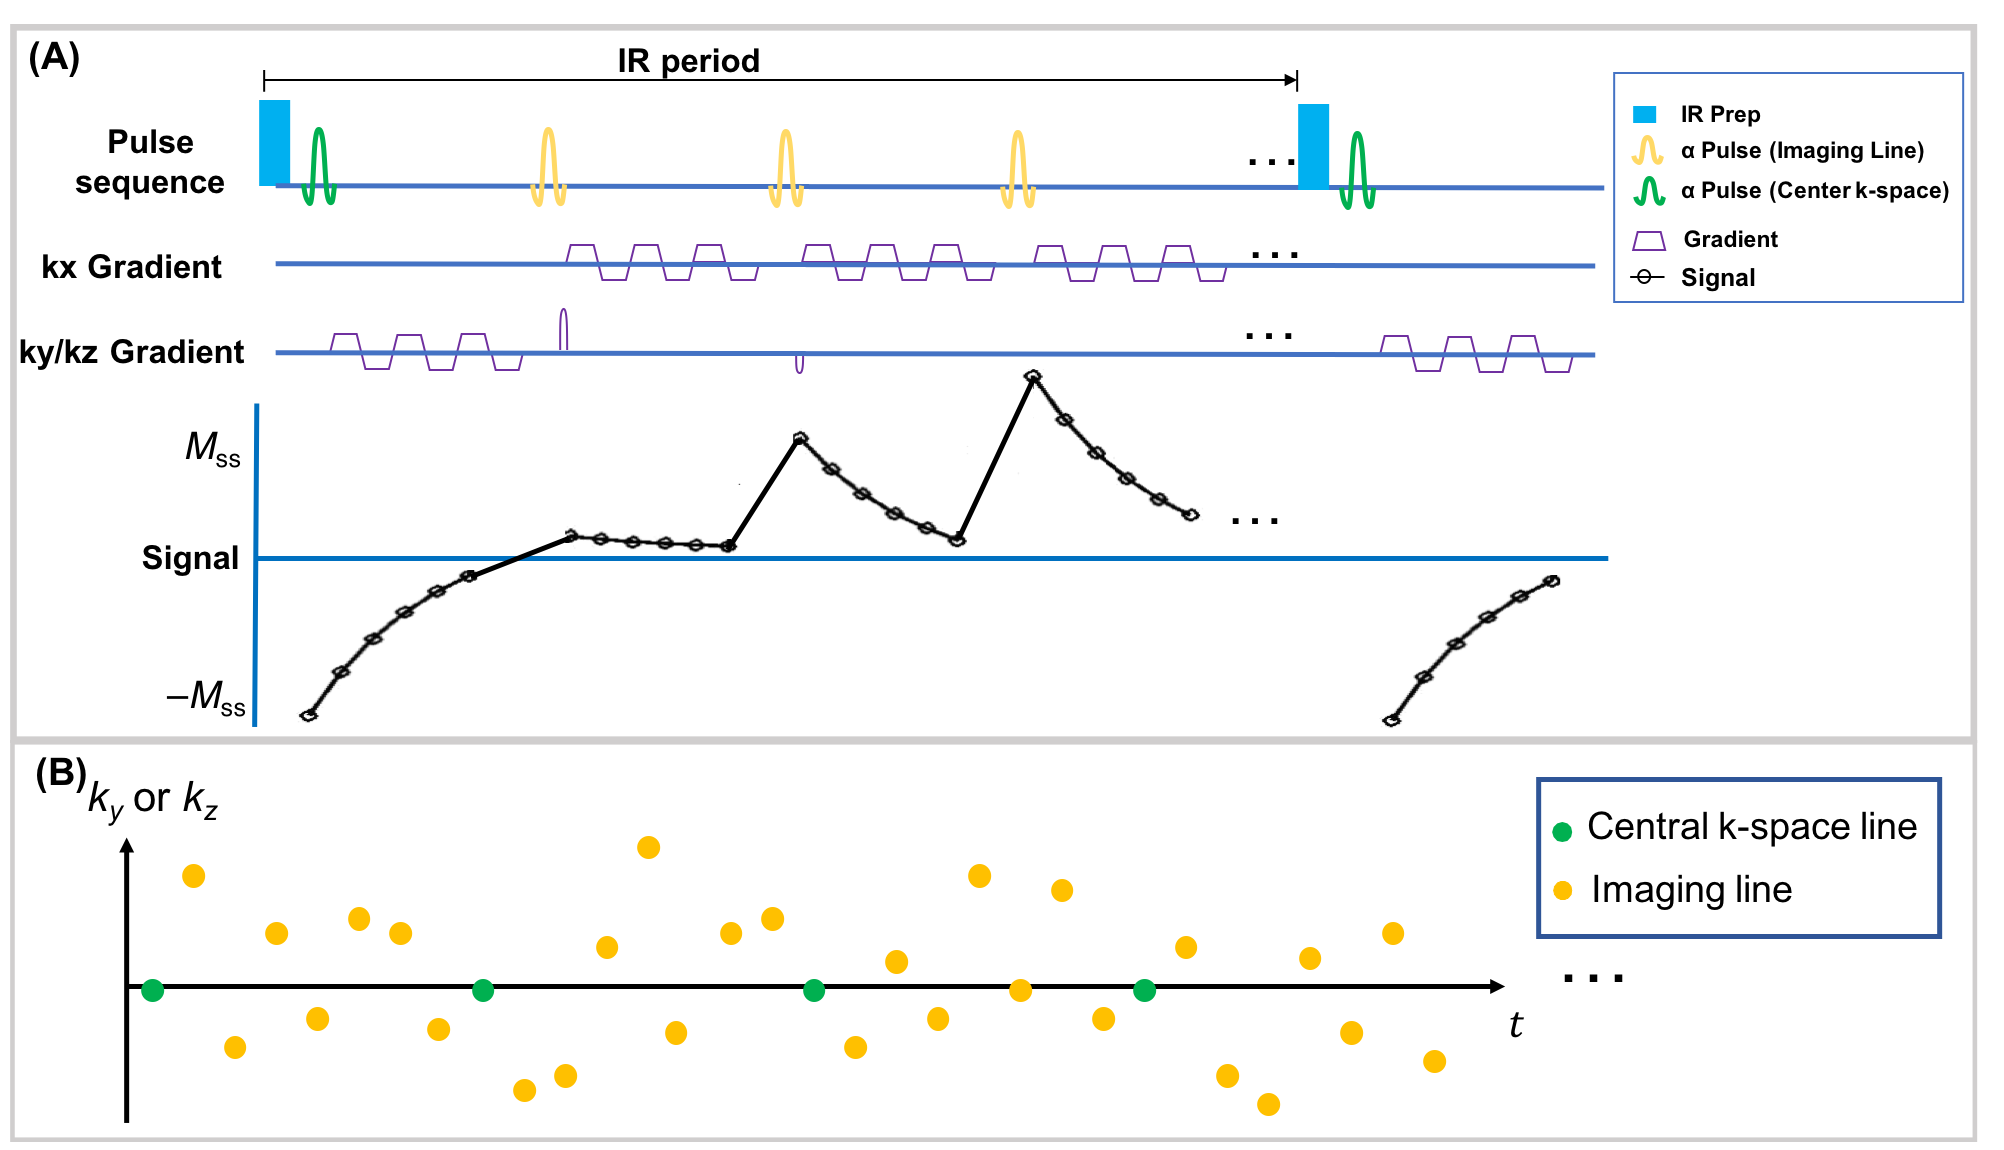
Sequence Design: A continuous scan prototype sequence with periodic non-selective IR preparation pulses followed by a 3D 6-echo bipolar FLASH readout was used to generate T1 and R2* contrast, as shown in Figure 1A. A 3D Cartesian sampling pattern with randomized Gaussian-density reordering in both phase and partition encoding directions was designed, and a center k-space line was collected every 8 readouts as training data, as shown in Figure 1B. The center k-space lines were placed in the superior-inferior direction to capture respiratory motion.Image Reconstruction: The images acquired in this work can be represented as a 4-way tensor $$$\mathcal{A}$$$ with voxel location index $$$\mathbf{r}=(x,y,z)$$$, IR dimension $$$TI$$$, multi-echo dimension $$$t_{e}$$$, and respiration dimension $$$t_{r}$$$. The high correlation along and across multiple time dimensions induces $$$\mathcal{A}$$$ to be low-rank, which can be factorized as $$$\mathbf{A}_{(1)}=\mathbf{U}\mathbf{\Phi}$$$, where $$$\mathbf{A}_{(1)}$$$ is the mode-1 matricization of $$$\mathcal{A}$$$, $$$\mathbf{U}$$$ contains spatial coefficient maps, and $$$\mathbf{\Phi}$$$ contains the separable multi-dimensional temporal basis functions describing T1 relaxation, multi-echo contrast, and respiratory motion5. In the reconstruction, $$$\mathbf{\Phi}$$$ was first determined by the SVD of low-rank tensor–completed training data. $$$\mathbf{U}$$$ was then recovered by fitting $$$\mathbf{\Phi}$$$ to the acquired imaging data $$$\mathbf{d}$$$, using the following optimization problem:$$\widehat{\mathbf{U}}=\arg\min_{\mathbf{U}}\|\mathbf{d}-\Omega(\mathbf{F}\mathbf{S}\mathbf{U}\mathbf{\Phi})\|_{2}^{2}+R(\mathbf{U}),$$with undersampling operator $$$\Omega$$$, Fourier transform operator $$$\mathbf{F}$$$, coil sensitivity operator $$$\mathbf{S}$$$, and spatial total-variation penalty $$$R(\cdot)$$$6.
T1, R2*, and FF Quantification: First, T1 was quantified using the images of the first echo according to the following equation:$$s\left(A,\alpha,B,n,T_{1}\right)=A\frac{1-e^{-T_{\mathrm{R}}/T_{1}}}{1-e^{-T_{\mathrm{R}}/T_{1}}\cos\alpha}\left[1+(B-1)\left(e^{-T_{\mathrm{R}}/T_{1}}\cos\alpha\right)^{n}\right]\sin\alpha,$$with amplitude factor $$$A$$$, SR pulse efficiency $$$B$$$, FLASH readout interval $$$T_{R}$$$, flip angle $$$\alpha$$$, and recovery time point $$$n=1,2,...,N$$$ ($$$N$$$ is the number of TIs in an IR period).
Subsequently, the R2* and FF were jointly fitted using the multi-echo images at the last TI according to:$$s_{w}\left(\rho_{w},\rho_{f},\psi_{0},R_{2}^{*}\right)=\left(\rho_{w}+\rho_{f}e^{i2\pi{fT_{E}}}\right)e^{i\psi_{0}-T_{E}R_{2}^{*}},$$where $$$T_{E}$$$ is the echo time (TE), $$$\rho_{w}$$$ and $$$\rho_{f}$$$ are the proton densities for water and fat, respectively, $$$f$$$ is the chemical shift of fat at 3T, and $$$\psi_{0}$$$ is the field inhomogeneity. An iterative fitting scheme was implemented as introduced in IDEAL7,8.
Imaging Experiment: All data were acquired on a 3T scanner (MAGNETOM Vida, Siemens Healthcare, Germany) in transversal orientation with the following parameters: TEs = 1.44/ 2.67/ 3.90/ 5.13/ 6.36/ 7.59ms, TR=9.29ms, FOV=360x288x216mm3,spatial resolution=1.5x1.5x3mm3, Flip angle=5°, scan time=9min. Healthy volunteers (N = 8) were recruited for the study. Three of them were scanned twice with the same protocol to assess repeatability. A 2D MOLLI sequence9 positioned in the center slice of liver with 1.5-mm in-plane resolution and 8-mm slice thickness and a 3D multi-echo GRE sequence10(spatial resolution 1.5x1.5x3mm3) covering the whole liver were acquired as reference for the T1, R2* and FF, respectively.
Image Analysis: T1, R2*, and FF measured by Multitasking sequence were assessed and compared to reference sequences for all the volunteers (N = 8). The Intraclass correlation coefficient (ICC) and paired t-test between Multitasking and reference sequences were performed for each parameter. Repeatability of Multitasking was evaluated.
Results
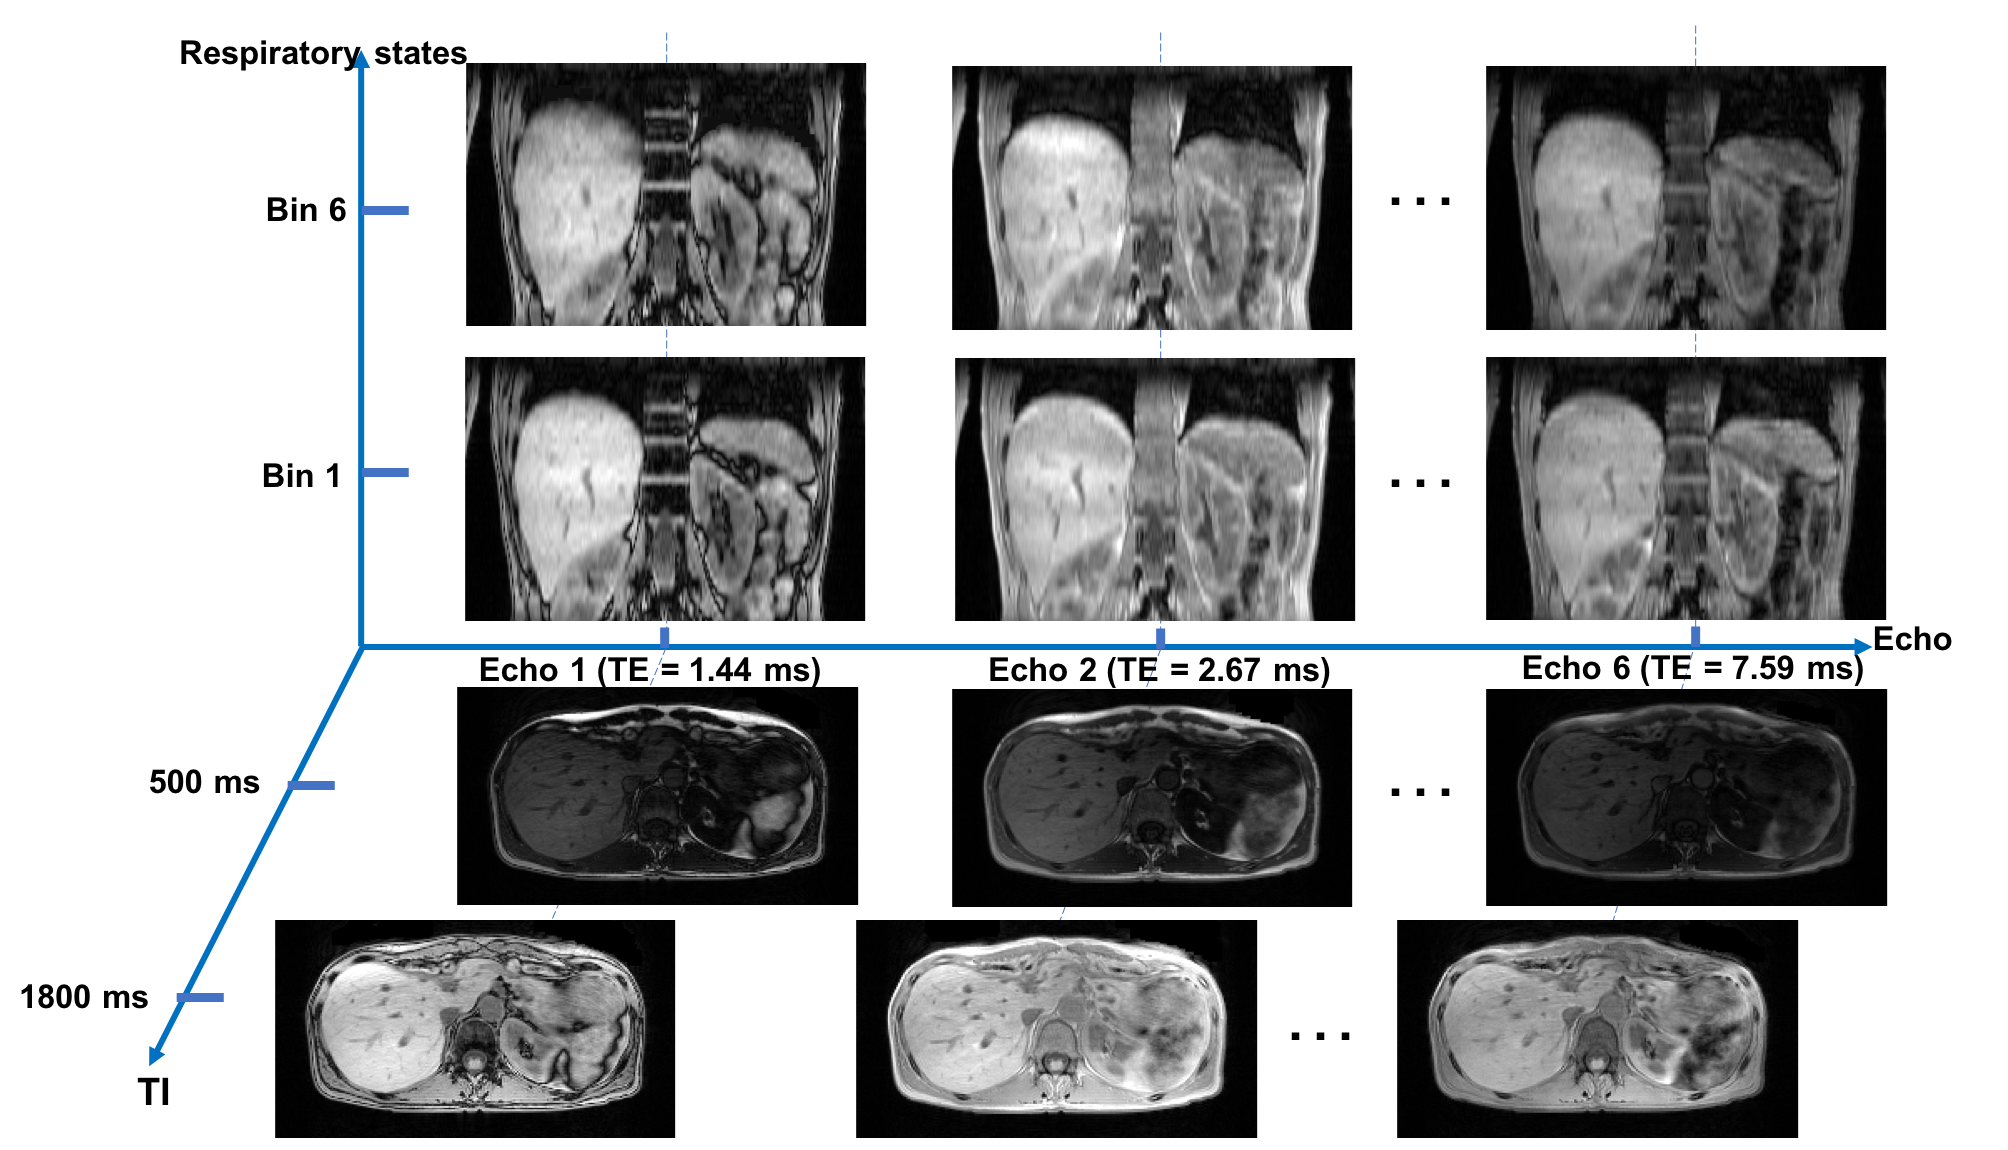
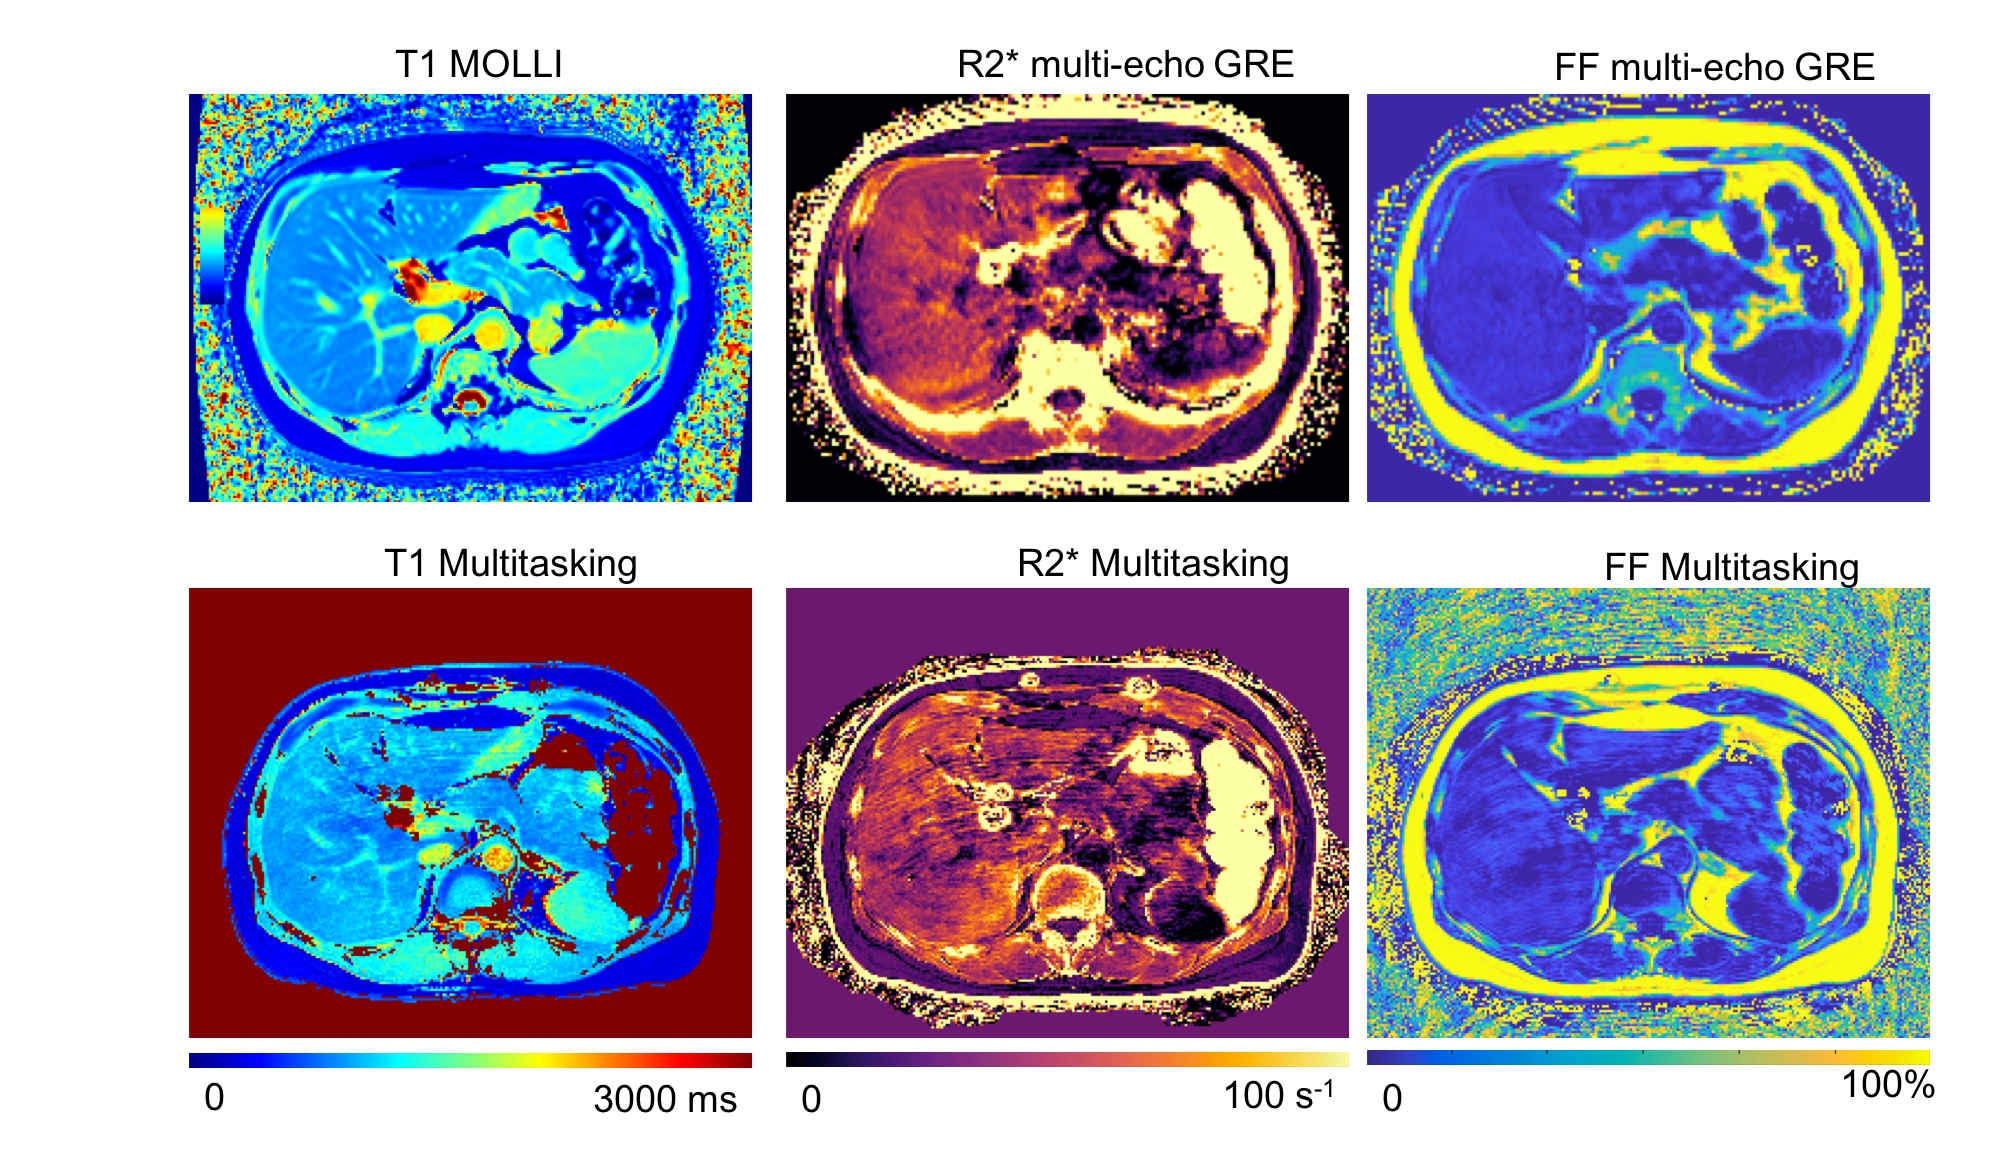
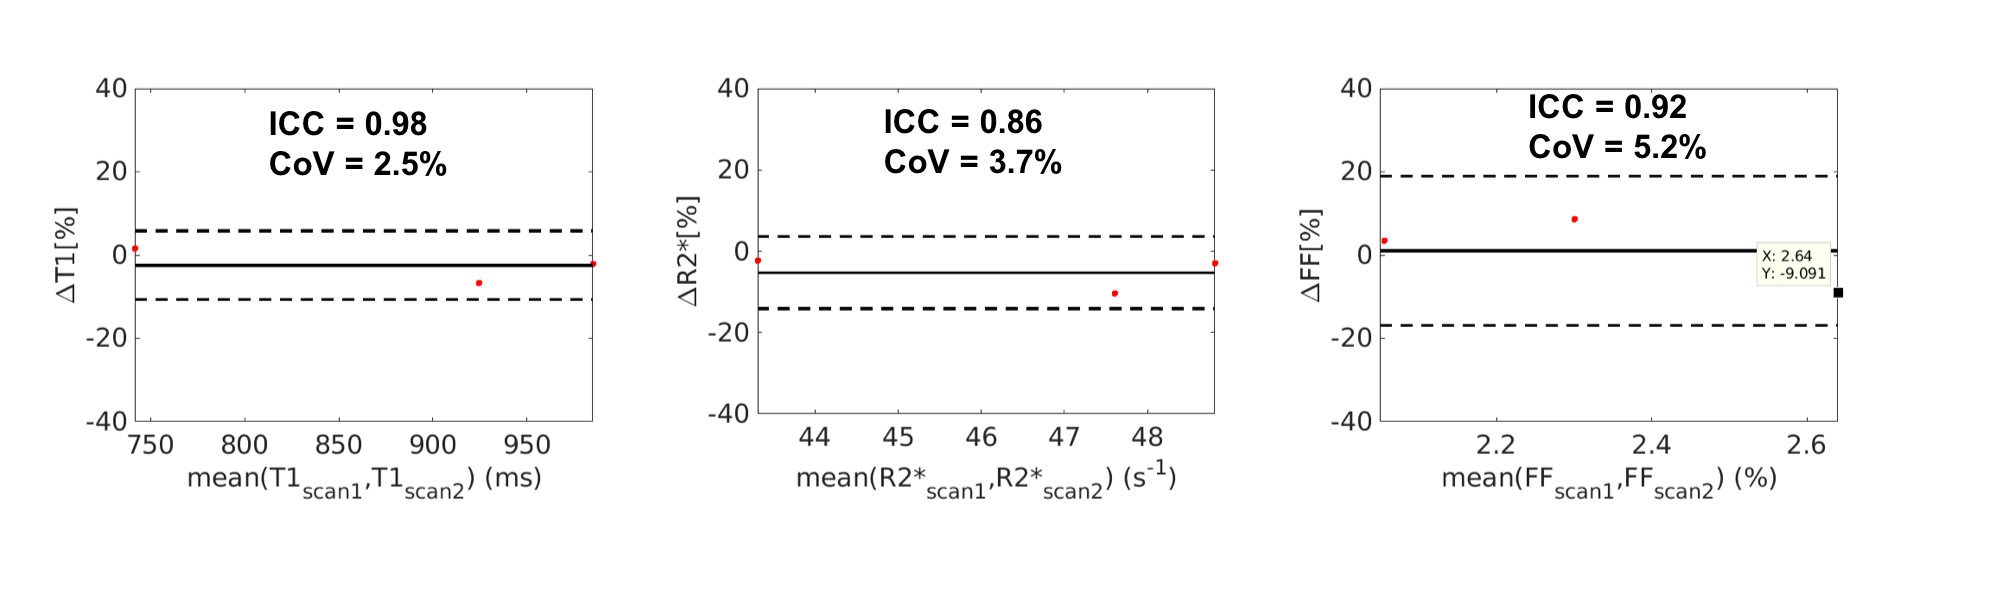
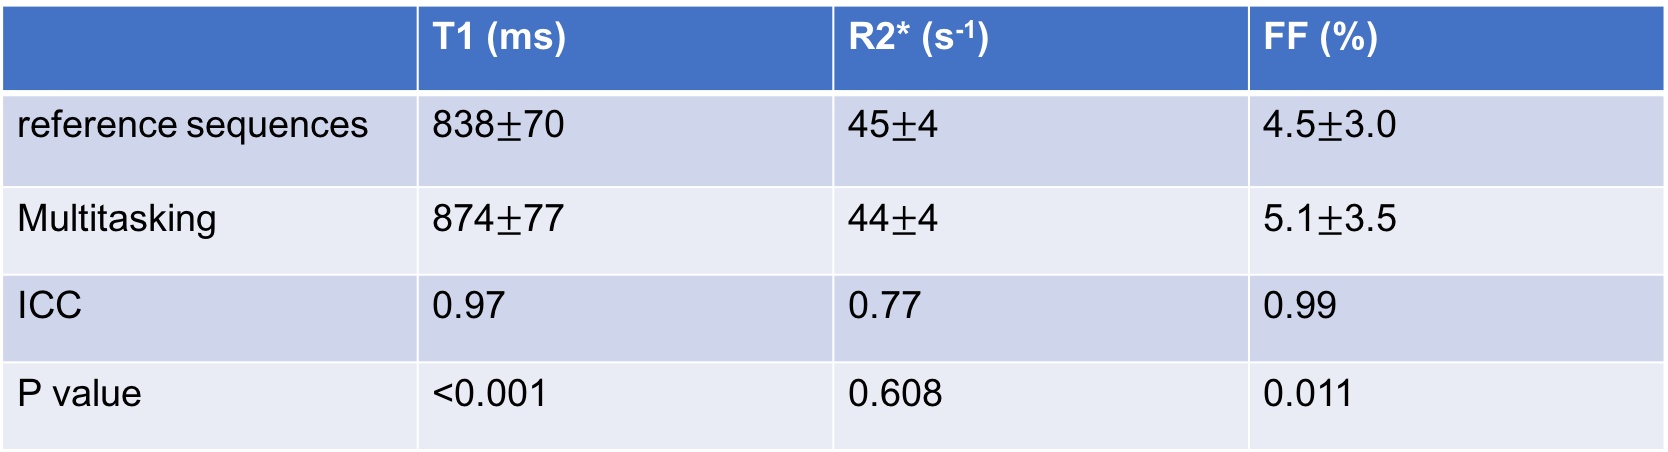
Figure 2 illustrates the multi-dimensional images from Multitasking with different respiratory states, TIs and echo times. Figure 3 shows an in vivo example of the T1, R2*, and FF maps from Multitasking and reference sequences. The Bland-Altman plots in Figure 4 shows the repeatability of each parameter, with less than 10% inter-scan variation. The mean value, standard deviation and statistical analysis for each parameter measured by Multitasking and reference sequences are listed in Table 1. The ICC indicates that the parameters measured by Multitasking are generally consistent with the measurement from reference sequences.Discussion
Simultaneous co-registered T1, R2*, and FF maps were generated using the proposed Multitasking technique. Free-breathing acquisition was enabled by the Multitasking technique which resolved the motion. The multi-parametric quantification was repeatable in vivo and consistent with the results from the reference methods. Some motion artifacts still remain, so future work will include investigation of stack-of-stars encoding.Conclusion
In this work, we demonstrated the in vivo feasibility of MR Multitasking to enable simultaneous T1, R2*, and FF quantification with free-breathing acquisition, 3D whole-liver coverage, and sufficient spatial resolution. T1, R2* and FF were repeatable in vivo and consistent with reference methods. Further clinical validation in a large patient cohort is warranted.Acknowledgements
This work was supported by NIH 1R01EB028146.References
1. Marcellin P, Kutala BKJLI. Liver diseases: A major, neglected global public health problem requiring urgent actions and large‐scale screening. 2018;38:2-6.
2. Cassinotto C, Feldis M, Vergniol J, Mouries A, Cochet H, Lapuyade B, Hocquelet A, Juanola E, Foucher J, Laurent FJEjor. MR relaxometry in chronic liver diseases: Comparison of T1 mapping, T2 mapping, and diffusion-weighted imaging for assessing cirrhosis diagnosis and severity. 2015;84(8):1459-1465.
3. Banerjee R, Pavlides M, Tunnicliffe EM, Piechnik SK, Sarania N, Philips R, Collier JD, Booth JC, Schneider JE, Wang LMJJoh. Multiparametric magnetic resonance for the non-invasive diagnosis of liver disease. 2014;60(1):69-77.
4. Hernando D, Levin YS, Sirlin CB, Reeder SBJJoMRI. Quantification of liver iron with MRI: state of the art and remaining challenges. 2014;40(5):1003-1021.
5. Christodoulou AG, Shaw JL, Nguyen C, Yang Q, Xie Y, Wang N, Li D. Magnetic resonance multitasking for motion-resolved quantitative cardiovascular imaging. Nature Biomedical Engineering 2018;2(4):215.
6. Wang N, Christodoulou AG, Xie Y, Wang Z, Deng Z, Zhou B, Lee S, Fan Z, Chang H, Yu WJMrim. Quantitative 3D dynamic contrast‐enhanced (DCE) MR imaging of carotid vessel wall by fast T1 mapping using Multitasking. 2019;81(4):2302-2314.
7. Reeder SB, McKenzie CA, Pineda AR, Yu H, Shimakawa A, Brau AC, Hargreaves BA, Gold GE, Brittain JHJJoMRIAOJotISfMRiM. Water–fat separation with IDEAL gradient‐echo imaging. 2007;25(3):644-652.
8. Reeder SB, Wen Z, Yu H, Pineda AR, Gold GE, Markl M, Pelc NJJMRiMAOJotISfMRiM. Multicoil Dixon chemical species separation with an iterative least‐squares estimation method. 2004;51(1):35-45.
9. Messroghli DR, Radjenovic A, Kozerke S, Higgins DM, Sivananthan MU, Ridgway JP. Modified Look‐Locker inversion recovery (MOLLI) for high‐resolution T1 mapping of the heart. Magnetic Resonance in Medicine: An Official Journal of the International Society for Magnetic Resonance in Medicine 2004;52(1):141-146.
10. Zhong X, Nickel MD, Kannengiesser SA, Dale BM, Kiefer B, Bashir MRJMrim. Liver fat quantification using a multi‐step adaptive fitting approach with multi‐echo GRE imaging. 2014;72(5):1353-1365.
Figures