3766
Natural, multi-contrast and quantitative imaging of the brain using tailored MR fingerprinting1Columbia University Magnetic Resonance Research Center, Columbia University in the City of New York, New York, NY, United States, 2Dayananda Sagar College of Engineering, Bangalore, India, 3GE Healthcare Applied Sciences Laboratory East, New York, New York, NY, United States
Synopsis
Tailored MRF (TMRF) provides scheme to acquire non-synthetic, multi contrast images simultaneously in one sequence by tailoring the acquisition scheme derived in MRF. Natural contrast obtained from TMRF overcomes artifacts observed in MRF such as flow and errors in tissue parameter quantitation. We acquired TMRF and MRF data on the ISMRM/NIST phantom along with gold standard relaxometry data. We also acquired MRF and TMRF data for 5 volunteers and compared the natural and synthetic contrasts; and the relaxometric maps. The TMRF natural contrasts are similar to control experiments and do not contain flow artifacts found in synthetic contrasts.
Introduction
The benefits of quantitative imaging is well accepted but typically requires long acquisition time in order to obtain parametric maps such as T1 and T2 maps. Multiple approaches have been made to reduce the scan time. one such technique includes Magnetic Resonance Fingerprinting (MRF)1 which provides the multi parametric maps simultaneously. Synthetic contrast images are derived from the parametric maps obtained from MRF. One of the limiting factors of MRF is that it does not provide the natural contrast images. Tailored MRF (TMRF) provides scheme to acquire non-synthetic, multi contrast images simultaneously in one sequence by tailoring the acquisition scheme derived in MRF. Natural contrast obtained from TMRF overcomes artifacts observed in MRF such as flow and errors in tissue parameter quantitation. TMRF currently gives 4 natural contrasts and was demonstrated on in-vitro NIST phantom and 5 in-vivo brain healthy human volunteer.Methods
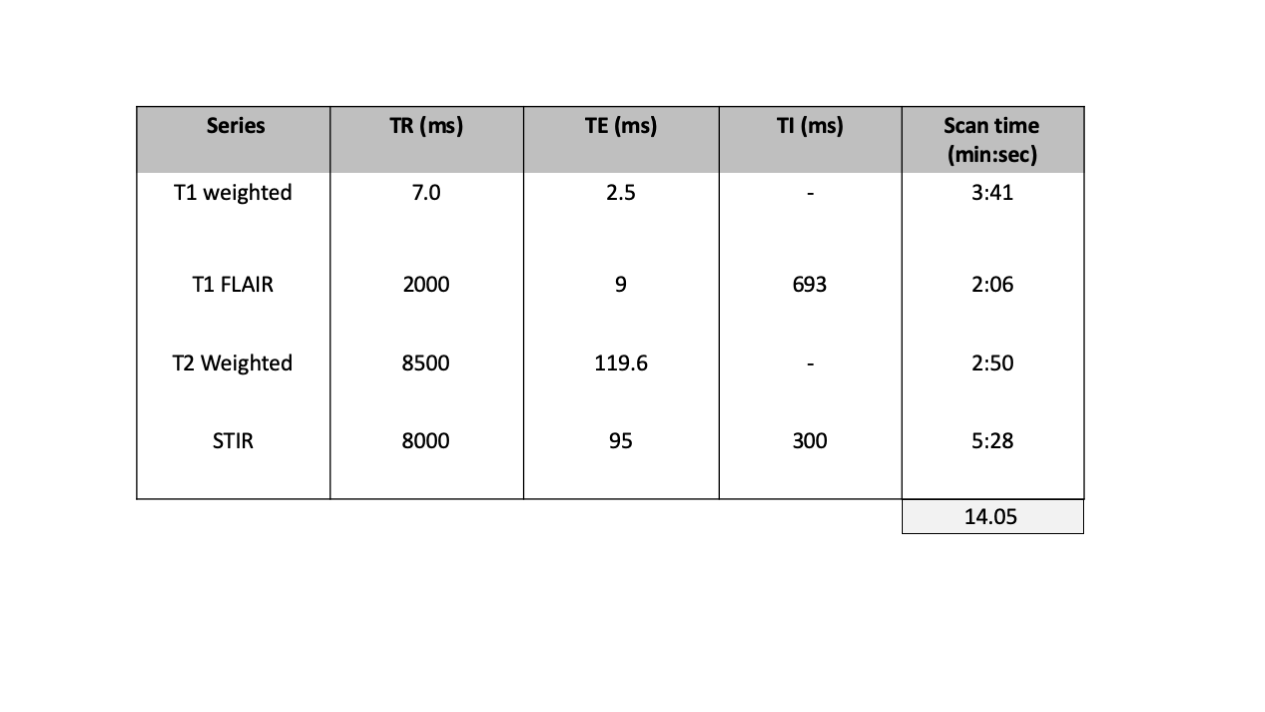
The TMRF was designed for 1000 time points for various combinations of Repetition Time (TR) and Flip Angle (FA). These parameters were arranged in ascending order which leads to smoothly varying magnetization evolution of tissue types. These 1000 time points were divided into different acquisition blocks which corresponds to the image contrasts. Currently, four blocks were designed in order to acquire four contrasts and can be increased in order to get other contrasts. The dictionary was generated using Extended Phase Graph (EPG)2 and images were reconstructed using sliding window method. The dictionary generation, simulation, acquisition and reconstruction of TMRF was previously demonstrated.3 The TMRF and MRF scan parameters were optimised, as sometimes parameters such as minimum TR (changed from 12.8ms to 14.7ms) cannot be achieved by the scanner.The gold standard sequences magnetization prepared T1 weighted, T1 Fluid Attenuated Inversion Recovery (FLAIR), T2 weighted and Short Inversion Time Inversion Recovery (STIR) were used to acquire brain from 5 healthy volunteer on GE 3T DISCOVERY 750w scanner. The acquisition parameters – TR, TE and TI for gold standard sequences with the scan times were tabulated in table 1. MRF and TMRF data were acquired and the acquisition time were 5:57 and 5:27 (min:sec) respectively. Synthetic contrast (magnetization prepared T1 weighted, T1 FLAIR, T2 weighted and STIR) were generated by providing parametric maps derived from MRF and TMRF, and acquisition parameters such as TR, TE and TI to the signal equation. All 1000 reconstructed images obtained from TMRF were visualised and only 4 images were manually selected (one from each block). All images were picked by visually comparing it with Magnetic Resonance Image Compilation (MAGiC).4 These images passed through median filter in order to smoothen the image with window size of 2x2. The obtained filtered image is then normalized between 0 and 1. The same time points were used for all the 20 slices and on rest of the datasets in order to pick the natural contrast. Natural contrast weighted images, synthetic contrast generated from TMRF and MRF are written in DICOM. This was possible by reading the existing DICOM file from GE scanner and modifying it required format. These images were loaded on the GE's target and compared with the gold standard.
Results
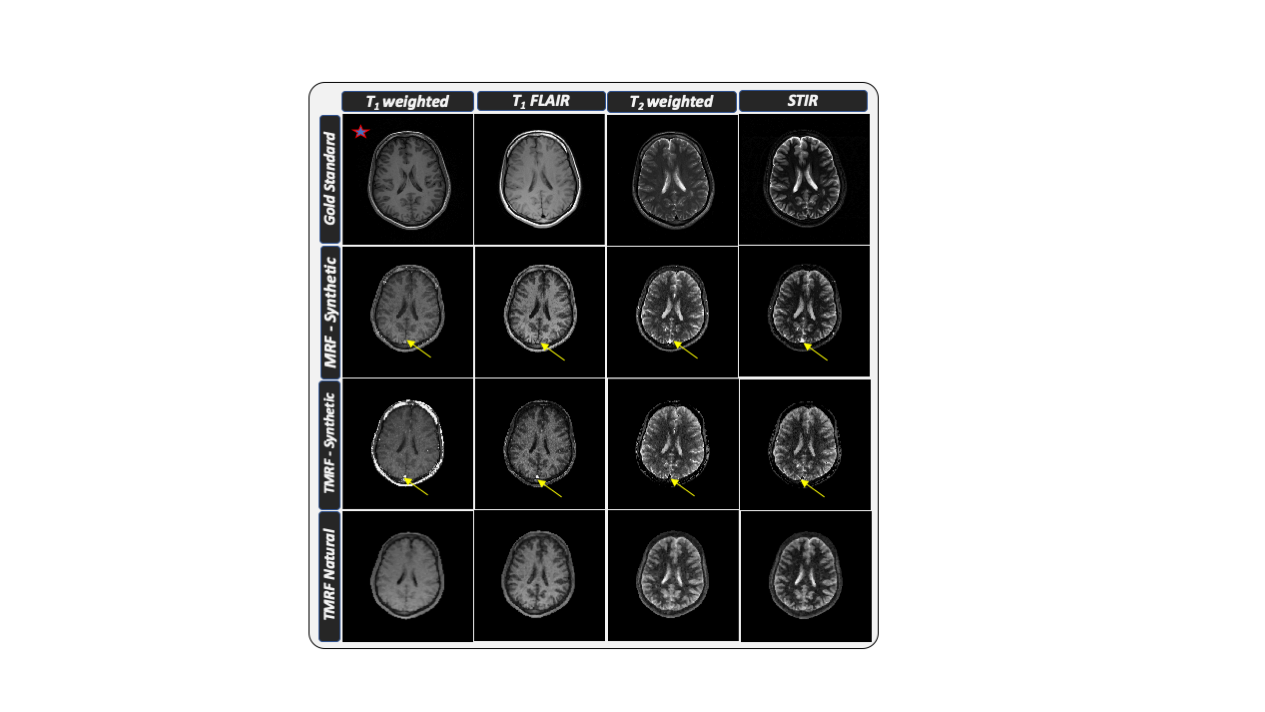
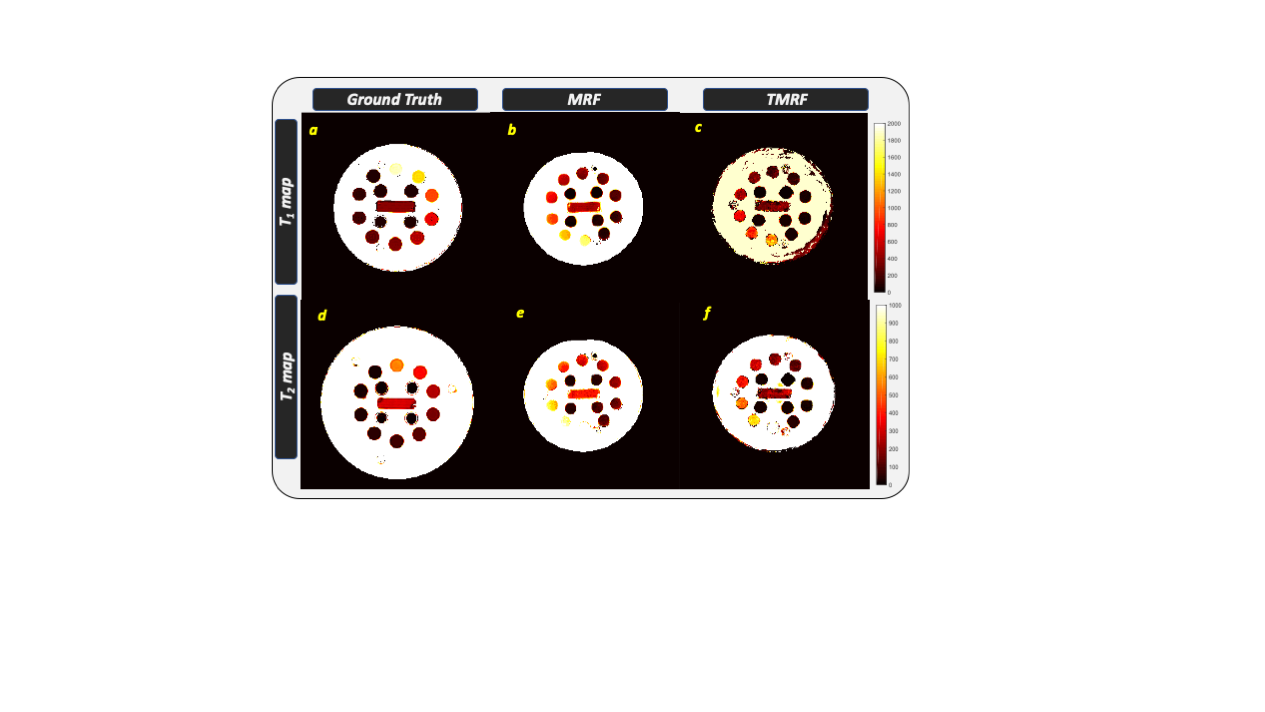
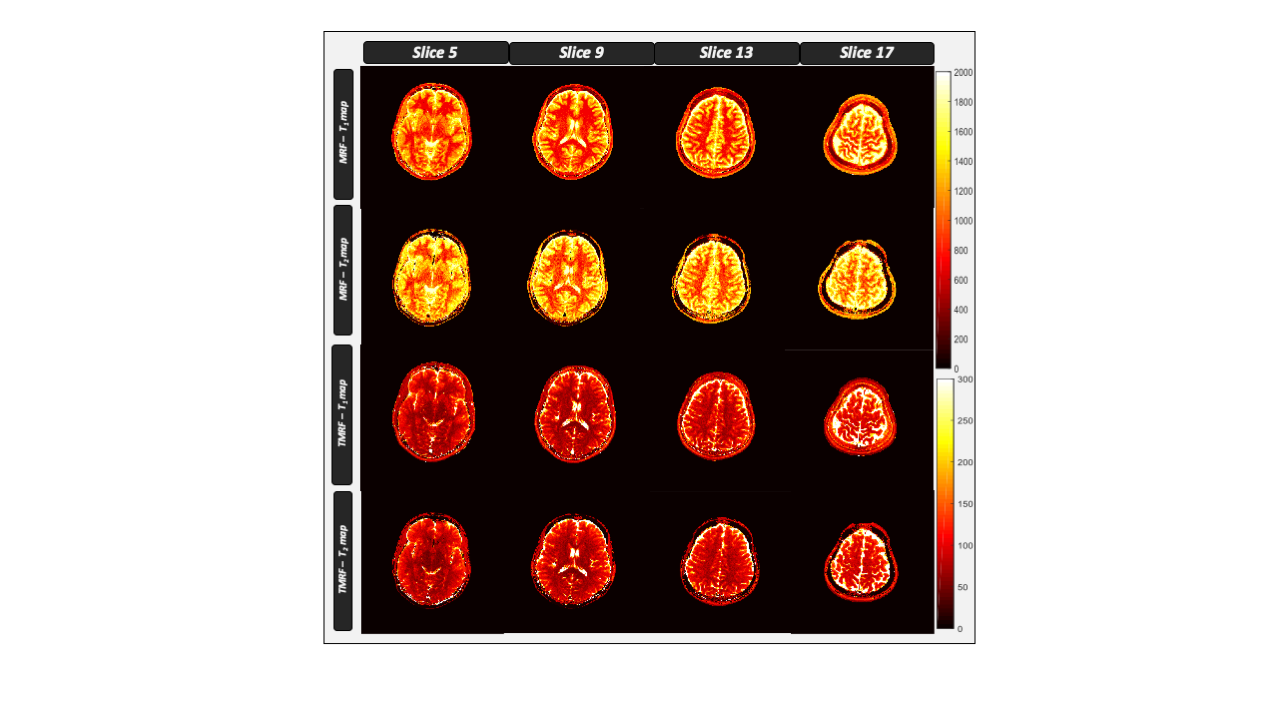
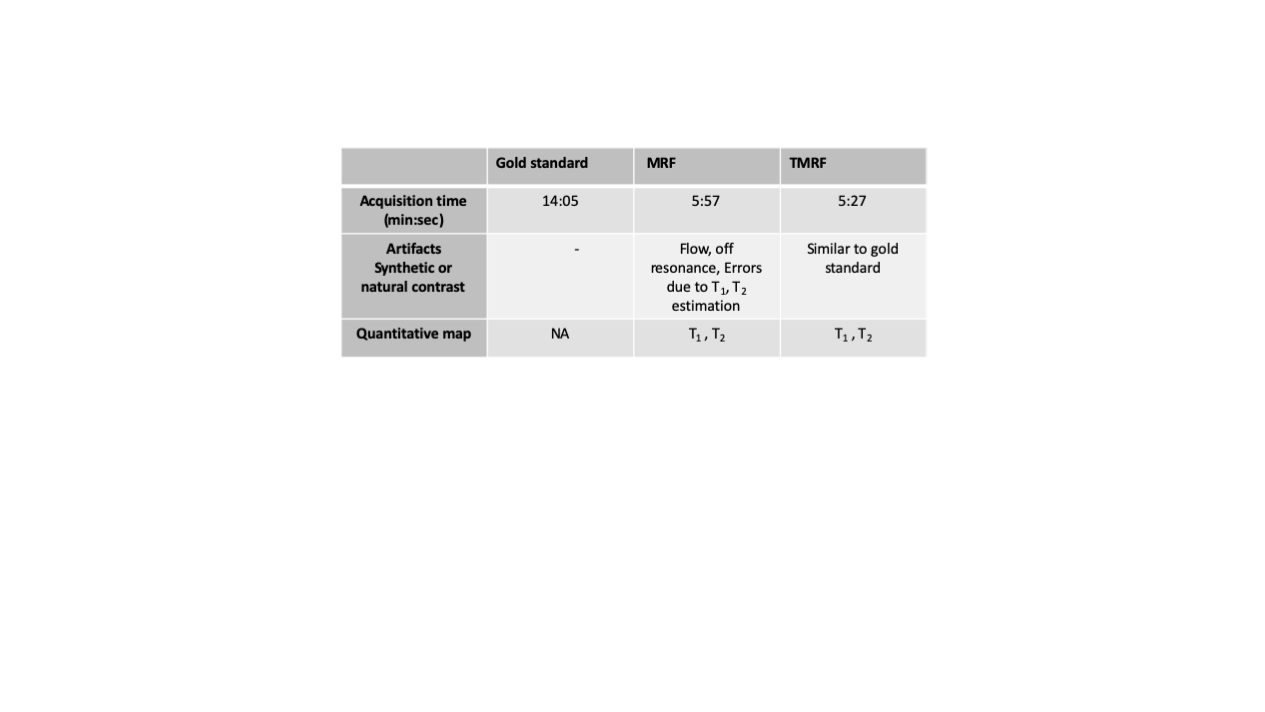
The TR, TE and TI for all the four sequences are tabulated in table 1. Figure 1 shows the representative images obtained from gold standard (natural contrast), MRF (synthetic contrast) and TMRF (synthetic and natural contrast) for the sequences magnetization prepared T1 weighted (shown with red star), T1 FLAIR, T2 weighted and STIR. It can be observed from the figure 1 that the synthetic contrast images have a flow artifact which are shown with yellow arrows. However, the flow artifact is not present in natural contrast obtained from TMRF. All four natural contrast images looks similar to the images obtained with gold standard. Figure 2 shows the T1 and T2 maps of NIST phantom obtained from MRF and TMRF and are compared with ground truth. It can be observed that the maps looks similar to the gold standards except the field of view which is smaller. Figure 3 depicts the T1 and T2 maps generated from MRF and TMRF. Out of 20 slices, only 4 slices are shown from 1 subject to represent the volume coverage. Table 2 shows the comparison of MRF and TMRF with gold standards in terms of acquisition times, artifacts and quantitative maps.Discussion and Conclusion
TMRF currently produces four different natural contrasts simultaneously along with the parametric maps. The obtained natural contrast are resistant to the artifacts and images looks similar to the gold standard as shown in figure 1. From table 2, the total acquisition time for all the four sequences is much higher compared to MRF and TMRF. TMRF combines the features which get from weighted images with MRF by changing the acquisition scheme and also by using sliding window reconstruction. Future work includes including more blocks for contrasts such as T2 FLAIR, water only, fat only and diffusion. Provide these images to the radiologists for the validation.Acknowledgements
GE Healthcare-Columbia Radiology MR Research Partnership Program; PI: GeethanathReferences
1. Ma D, Gulani V, Seiberlich N, et al. Magnetic resonance fingerprinting. Nature 2013 doi: 10.1038/nature11971.
2. Weigel M. Extended phase graphs: Dephasing, RF pulses, and echoes - pure and simple. J. Magn. Reson. Imaging 2015;41:266–295 doi: 10.1002/jmri.24619.
3. Geethanath Sairam et.al., ISMRM - 2018.
4. Tanenbaum LN, Tsiouris AJ, Johnson AN, et al. Synthetic MRI for clinical neuroimaging: results of the Magnetic Resonance Image Compilation (MAGiC) prospective, multicenter, multireader trial. Am. J. Neuroradiol. 2017.
Figures