3765
Dictionary-based Learning in MR Fingerprinting: Statistical Learning versus Deep Learning1Univ. Grenoble Alpes, Inserm, U1216, Grenoble Institut Neurosciences, GIN, 38000, Grenoble, France, 2Univ. Grenoble Alpes, Inria, CNRS, G-INP, 38000, Grenoble, France
Synopsis
In MR Fingerprinting, the exhaustive search in the dictionary may be bypassed by learning a mapping between fingerprints and parameter spaces. In general, the relationship between these spaces is particularly non-linear, which implies the use of advanced regression methods: deep learning frameworks but also methods based on statistical models have been proposed. In this study, we compare reconstruction time, accuracy and noise robustness of the conventional dictionary-matching method and two methods that handle the modelling of the non-linear relashionship with a neural network and a statistical inverse regression model.
INTRODUCTION
To limit MRF reconstruction time and increase accuracy, several studies have proposed to learn the dictionary, either using neural networks1-7, or regression approaches8,9. This study aims to compare a dictionary-based matching10, a dictionary-based deep learning (DB-DL)3, and a dictionary-based statistical learning (DB-SL)11 methods. We analysed the reconstruction time, accuracy and robustness, while increasing the number of parameters. Performances were compared on synthetic signals: toy signals that can scale across parameter dimensions and 2-parameters MRI signals.METHOD
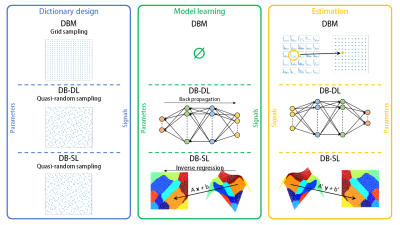
To provide information on parameters of interest x in ℝP given an observed signal y in ℝS, using a dictionary (couples of fingerprints and parameter vector), corresponds to solve an inverse problem. To solve this inverse problem, we can either use dictionary-based matching (DBM) or dictionary-based learning (DBL) methods, see11.Method procedures are illustrated in Figure 1 and detailed bellow:
- Dictionary design:
- Toy signals that can scale with dimension are designed as:
ytoy(xtoy)=|Σi=1:P sin(φi.f0.t) exp(-t/xi)|,
where xtoy=(x1, x2, ..., xP) is the parameter vector, f0 and φ in ℝP are constants and t in ℝS is the sample vector. - MRI signals yMRI are simulated as described in12 from the blood volume fraction (BVf) and the vessel size index (VSI): xMRI=(BVf, VSI). We used 200 values of BVf and 120 values of VSI that results in 24000 grid combinations. As it has shown better results in practice, parameter vectors x are sampled following a grid for DBM or a quasi-random sampling for DBL methods, see11.
- Model learning:
For DBL methods, the dictionary is used to learn a model that maps the relationship from y to x.
Implementing DB-DL, we use the four layer fully-connected neural network as described in3. The hidden layers have 300 nodes and the input and output layer sizes correspond to the lengths of y and x, respectively. The network is trained for 2000 epochs by the ADAM stochastic gradient descent algorithm with the learning rate set to 0.001. The loss function is defined as the mean-square-error. Two activation functions are used: the hyperbolic tangent for the hidden layers and the sigmoid for the output layer.
Implementing DB-SL, we use the Gaussian locally linear mapping method that exploits Gaussian mixture models13. Each y is seen as the noisy image of x obtained from a K-component mixture of affine transformations (K set to 50).
- Estimation:
For DBM, the estimate is the parameter vector xbest used to simulate the fingerprint ybest that best matches y identified according to the dot product. For DBL methods, the model is directly applied on y.
- Performance evaluation:
To compare accuracy, the root-mean-squared-error (RMSE) is computed between estimates and real known values and averaged over dimensions. The robustness is evaluated by adding Gaussian noise on test signals.
RESULTS
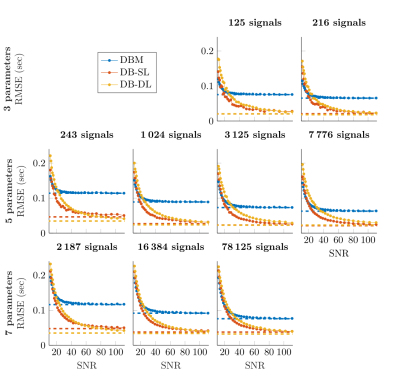
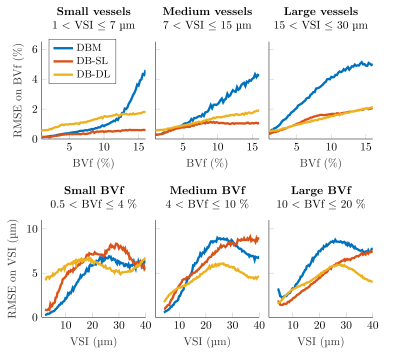
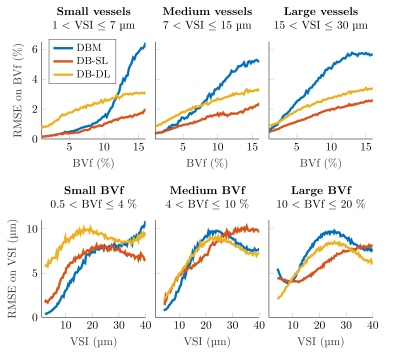
On toy signals, we investigated the impact on the RMSE of the dictionary size (Figure 2) by varying both the number of parameters and the number of signals (total 9 conditions). Additionally, noise was added on the 10000 test signals: SNR between 10 and 110. For all methods, RMSE decreases as SNR increases. DB-DL and DB-SL methods outperform DBM for SNR>30 and SNR>20, respectively. At SNR=50, DB-DL RMSE are lower than DBM RMSE with an average decrease of 44.7%, 41.6% and 39.9% for 3, 5 and 7 parameters, respectively. For DB-SL, average RMSE reductions are 54.7%, 51.0% and 44.7% for 3, 5 and 7 parameters, respectively.On MRI signals, we compared the three dictionary-based methods for SNR=50 (Figure 3) and SNR=100 (Figure 4). For BVf (SNR=100), DBL methods provide RMSE<2.1% while DBM provides an RMSE that goes up to 5.1% and average RMSE are: 2.11% for DBM, 0.88% for DB-SL and 1.25% for DB-DL. For VSI, average RMSE are comparable: 5.69µm for DBM, 5.60µm for DB-SL and 4.89µm for DB-DL. For SNR=50, average RMSE are: 2.79% and 6.88µm for DBM, 1.26% and 6.57µm for DB-SL and 2.25% and 7.43µm for DB-DL.
Average reconstruction times for 10000 test signals were 13.0sec for DBM (20000-signal dictionary), 2.8sec for DB-SL and 2.3sec for DB-DL.
DISCUSSION
DB-SL yields a lower RSME than DB-DL in most cases; however, in noise-free signals, DB-DL is more accurate suggesting that by enhancing the robustness of DB-DL, e.g. data augmentation as suggested in5, we can expect major improvements. For all methods, the error on VSI is large but this comes in part from the measuring sequence: VSI mainly depends on few signal samples. Other acquisition methods could reduce this error. There is a discrepancy between results from toy signals and microvascular signals: for toys signals (3 to 7 parameters), DBL methods provide by far better results than DBM. However, for microvascular signals (2 parameters), DBM can provide similar and even better results. It suggests that DBL methods are sensitive to how fingerprints properly encode information about the parameters of interest. An indicator of the model quality or confidence in estimates could be used to detect these cases.CONCLUSION
Both DBL methods outperform DBM in terms of reconstruction time and accuracy. On average, DBL methods yield comparable results. However, DB-SL is more robust to noise and a major advantage of DB-SL is its explainability and the possibility to provide a confidence index11.Acknowledgements
This work was supported by the French National Research Agency - project cerebrovascular dynamics in epilepsy: endothelial-pericyte interface – Epicyte, ANR-16-CE37-0013. The funders had no role in study design and analysis, decision to publish, or preparation of the abstract.References
[1] Patrick Virtue, X Yu Stella, and Michael Lustig. Better than real: Complex-valued neural nets for mri fingerprinting. In Image Processing (ICIP), 2017 IEEE International Conference on, pages 3953–3957. IEEE, 2017.
[2] Elisabeth Hoppe, Gregor Korzdorfer, Tobias Wurfl, Jens Wetzl, Felix Lugauer, Josef Pfeuffer, and Andreas Maier. Deep learning for magnetic resonance fingerprinting: A new approach for predicting quantitative parameter values from time series. Stud Health Technol Inform, 243:202–206, 2017.
[3] Ouri Cohen, Bo Zhu, and Matthew S Rosen. Mr fingerprinting deep reconstruction network (drone). Magnetic resonance in medicine, 80(3):885–894, 2018.
[4] Fabian Balsiger, Amaresha Shridhar Konar, Shivaprasad Chikop, Vimal Chandran, Olivier Scheidegger, Sairam Geethanath, and Mauricio Reyes. Magnetic resonance fingerprinting reconstruction via spatiotemporal convolutional neural networks. In International Workshop on Machine Learningfor Medical Image Reconstruction, pages 39–46. Springer, 2018.
[5] Marco Barbieri, Leonardo Brizi, Enrico Giampieri, Francesco Solera, Gastone Castellani, Claudia Testa, and Daniel Remondini. Circumventing the curse of dimensionality in magnetic resonance fingerprinting through a deep learning approach. arXiv preprint arXiv: 1811.11477, 2018.
[6] Pingfan Song, Yonina C Eldar, Gal Mazor, and Miguel Rodrigues. Hydra: Hybrid deep magnetic resonance fingerprinting. arXiv preprintarXiv: 1902.02882, 2019.
[7] Mohammad Golbabaee, Dongdong Chen, Pedro A Gomez, Marion I Menzel, and Mike E Davies. Geometry of deep learning for magnetic resonance fingerprinting. In ICASSP 2019-2019 IEEE International Conferenceon Acoustics, Speech and Signal Processing (ICASSP), pages 7825–7829. IEEE, 2019.
[8] Fabien Boux, Florence Forbes, Julyan Arbel, and Emmanuel L. Barbier. Dictionary-free mr fingerprinting parameter estimation via inverse regression. In 26th Annual Meeting ISMRM, Paris, page 4259, 2018.
[9] Gopal Nataraj, Jon-Fredrik Nielsen, Clayton Scott, and Jeffrey A Fessler. Dictionary-free mri perk: Parameter estimation via regression with kernels. IEEE transactions on medical imaging, 37(9):2103–2114, 2018.
[10] Dan Ma, Vikas Gulani, Nicole Seiberlich, Kecheng Liu, Jeffrey L Sunshine, Jeffrey L Duerk, and Mark A Griswold. Magnetic resonance fingerprinting. Nature, 495(7440):187, 2013.
[11] Fabien Boux, Florence Forbes, Julyan Arbel, Benjamin Lemasson, and Emmanuel L. Barbier. Inverse regression in mr fingerprinting: reducing dictionary size while increasing parameters accuracy. Submitted to Magnetic resonance in medicine, 2019. Preprint: https://hal.archives-ouvertes.fr/hal-02314026/document.
[12] Thomas Christen, NA Pannetier, Wendy W Ni, Deqiang Qiu, Michael EMoseley, Norbert Schuff, and Greg Zaharchuk. Mr vascular fingerprinting: a new approach to compute cerebral blood volume, mean vessel radius, andoxygenation maps in the human brain. Neuroimage, 89:262–270, 2014.
[13] Antoine Deleforge, Florence Forbes, and Radu Horaud. High-dimensional regression with gaussian mixtures and partially-latent response variables. Statistics and Computing, 25(5):893–911, 2015.
Figures


Impact of dictionary size and SNR on DBM and dictionary-based learning (DB-SL and DB-DL) methods.
Average RMSE are given as a function of the SNR for different dictionary sizes: the size is the number of parameter values in each dimension raised to the power of the number of parameters for grid samplings. Sizes (top-to-bottom/left-to-right order) are 53=125, 63=216, 35=243, 45=1024, 55=3125, 65=7776, 37=2187, 47=16384 and 57=78125. For DB-SL, the model parameter K is set to 50 (except for dictionary sizes <500, K set to 10)

RMSE on BVf and VSI estimates obtained with DBM and dictionary-based learning methods (DB-SL and DB-DL) applied on noisy synthetic MRI test signal (SNR=100).
Curves represent the RMSE on BVf estimates for the first row and the RMSE on VSI estimates for the second row. Data are represented after 1D sliding window filtering (3% for BVf and 5µm for VSI). Among the 24000 combinations of the grid, only 22836 signals could be produced, due to simulation constraints. The same signal number is used for all dictionaries. 100000-test were divided into 3 parts: small, medium and large.

RMSE on BVf and VSI estimates obtained with DBM and dictionary-based learning methods (DB-SL and DB-DL) applied on noisy synthetic MRI test signal (SNR=50).
Curves represent the RMSE on BVf estimates for the first row and the RMSE on VSI estimates for the second row. Data are represented after 1D sliding window filtering (3% for BVf and 5µm for VSI). Among the 24000 combinations of the grid, only 22836 signals could be produced, due to simulation constraints. The same signal number is used for all dictionaries. 100000-test were divided into 3 parts: small, medium and large.