3763
Accurate estimation of multiple parameters from MRF signals using deep learning1Institute of Applied Physics, University of Tsukuba, Tsukuba, Japan
Synopsis
Ideally, MRF can quantify multiple parameters at a single scan. In some cases, however, these parameters are not separable and additional scans for inseparable parameters are required, which reduces the advantage of the short scan time of MRF. This is remarkable when the large number of parameters are involved in the signal evolution process. Here, we used a pattern matching using a deep neural network called DRONE, and verified the separability of four parameters of T1, T2, B1, and ADC from MRF-FISP signals acquired at a single scan.
INTRODUCTION
MR Fingerprinting (MRF) 1 is a promising approach that enables quantification of multiple tissue parameters at a single scan. However, in some cases, MRF signals for different parameters are quite similar with each other, and it is difficult to distinguish T1 and T2 values from the other parameters, such as B1 and ADC. For example, T2 and ADC are indistinguishable under a strong spoiler gradient in MRF-FISP, especially for high T2 and ADC values 2. In such a case, additional scans of B1 and ADC are needed to accurately estimate T1 and T2 values, which reduces the advantage of the short scan time of MRF.Meanwhile, “DRONE” 3, which is a new pattern matching method using deep learning, has the improved robustness against noise in MRF signals, and has potential to give more accurate estimation than a conventional, direct matching (DM) using inner products. Therefore, indistinguishable MRF signals may be distinguishable by using DRONE. Here, we investigated this idea and verified that T1 and T2 values can be accurately estimated with DRONE from MRF-FISP signals acquired at a single experiment.
METHODS
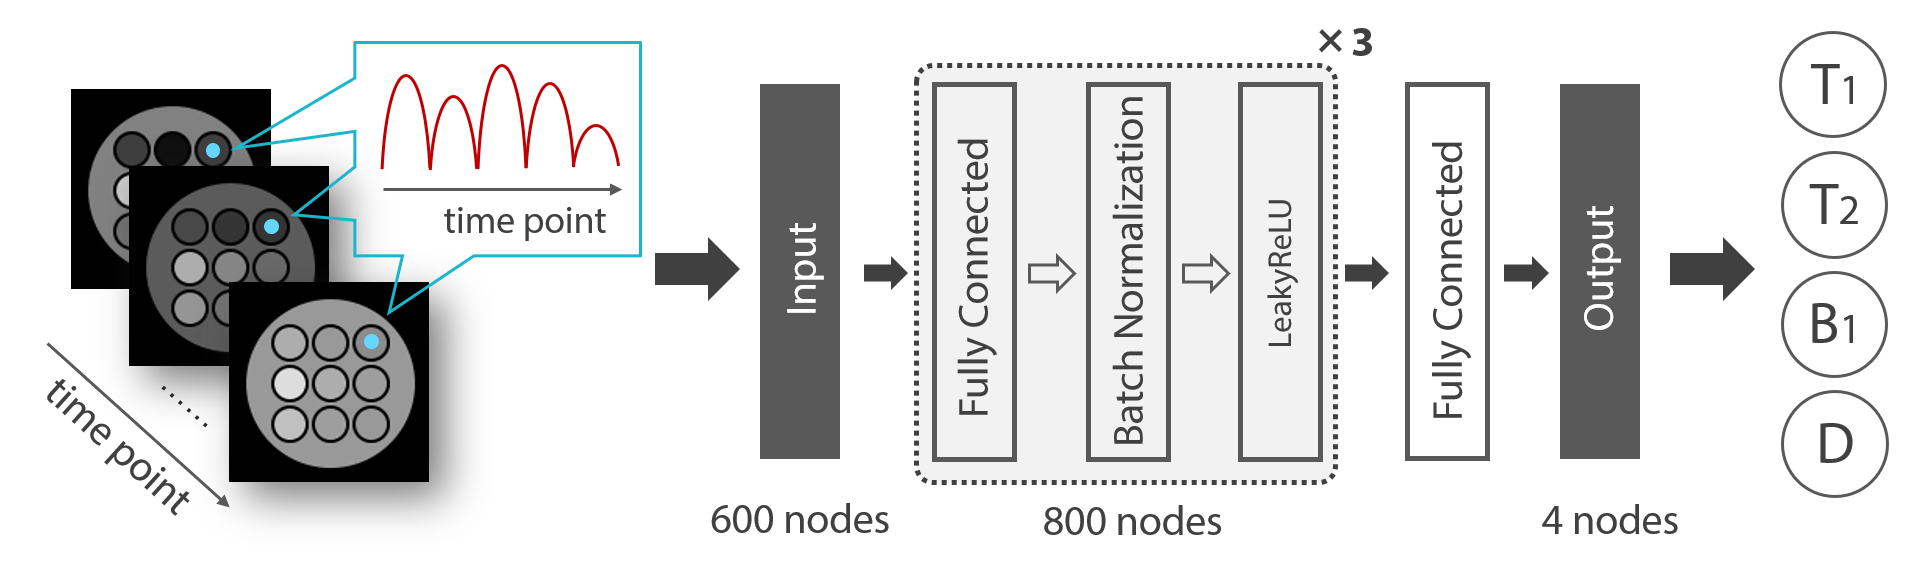
The inversion-recovery FISP sequence was used for MRF scans. The number of time frames was 600. The echo time was held constant (5 ms). The flip angle was varied pseudo-randomly and sinusoidally (5 to 90°) and the repetition time was varied using a Perlin noise pattern (20 to 30 ms). All experiments were performed on a home-built MRI system consisting of a 1.5T/280mm horizontal bore superconducting magnet (JMBT-1.5/280/SS, JASTEC, Kobe, Japan), shim and gradient coils, a birdcage coil, and a digital MRI console 4 (DTRX6, MRTechnology, Tsukuba, Japan). The dictionary with a range of T1 (100-1500 ms, 29 points), T2 (20-1000 ms, 50 points), B1 (0.8-1.2, 9 points), and ADC (0-2.6×10⁻⁹ m2/s, 13 points) was generated using an extended phase graph algorithm.Figure 1 shows a DRONE network used in this study. The output layer consisted of 4 nodes corresponding to the parameters T1, T2, B1, and ADC. The input layer consisted of 600 nodes which corresponded to the number of MRF time points. Each of 3 hidden layers had 800 nodes. Adam was used for the optimizer, mean squared error was used for the loss function, and Leaky ReLU was used for the activation function. The number of epochs was 250 and batch size was 128 in the learning process. Pattern matching results using both the DRONE and DM were compared.
A phantom consisting of 10 test tubes of MnCl2 or GdCl3 solutions with different T1 and T2 values was used for validation study. The spoiler gradient moment was 64π / 5 mm, which was strong enough to induce T2 underestimation using DM.
RESULTS AND DISCUSSION
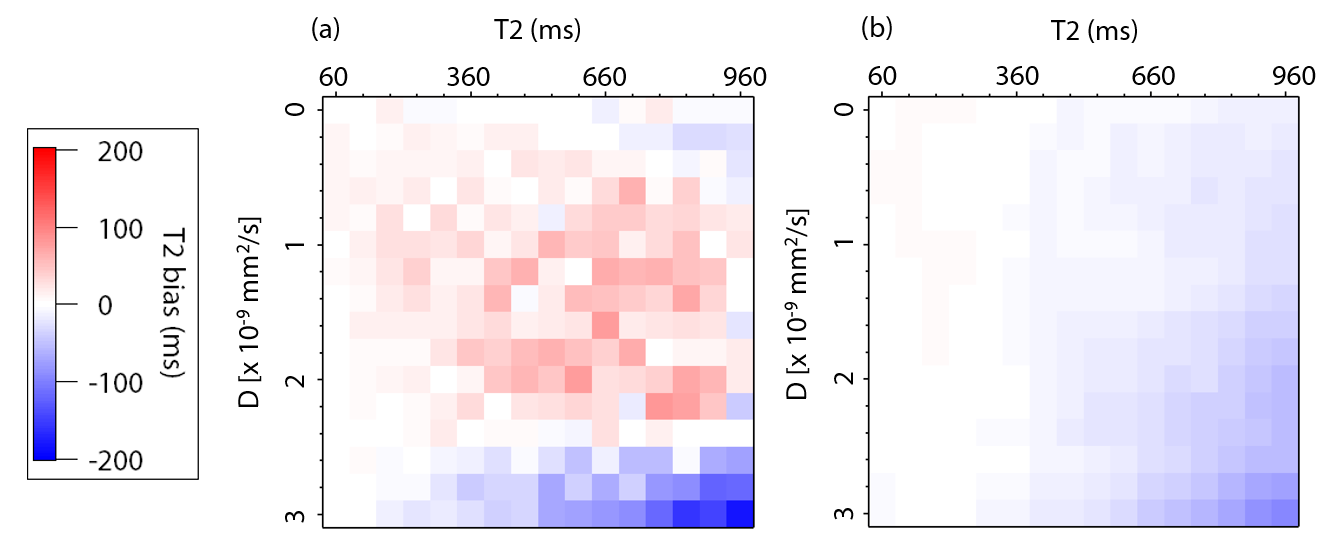
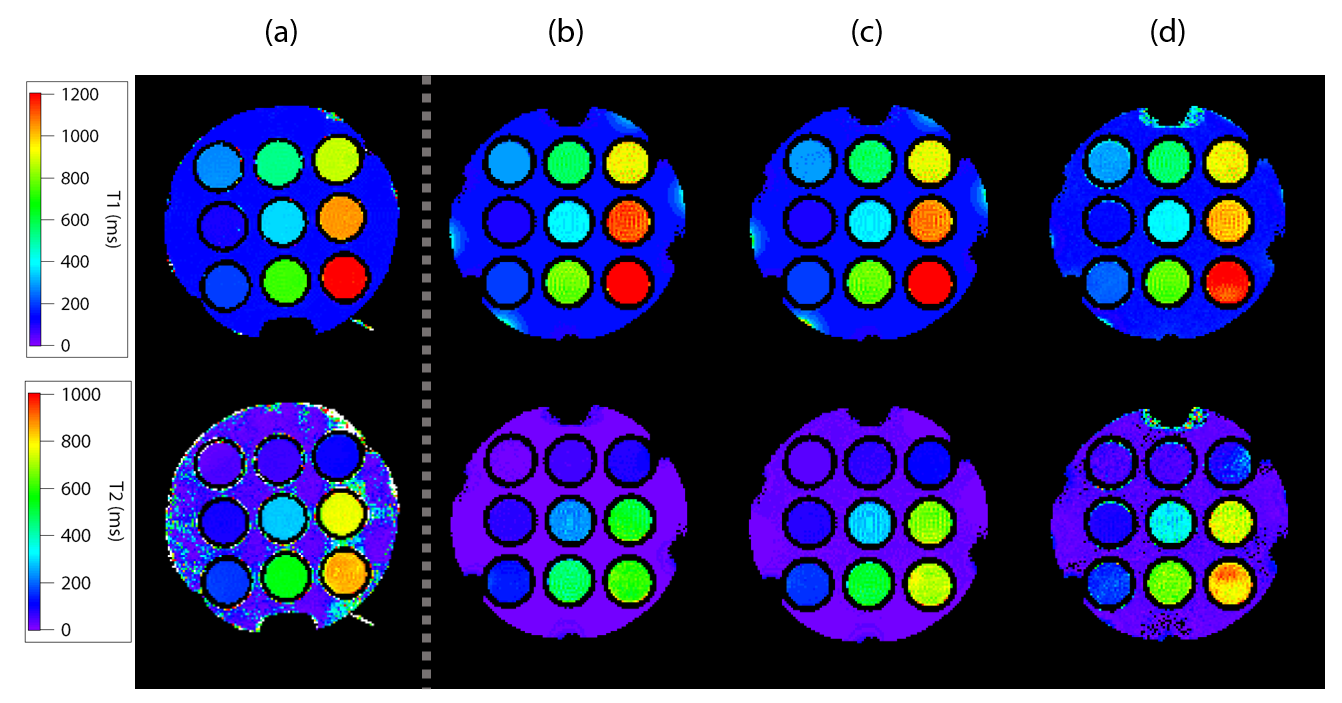
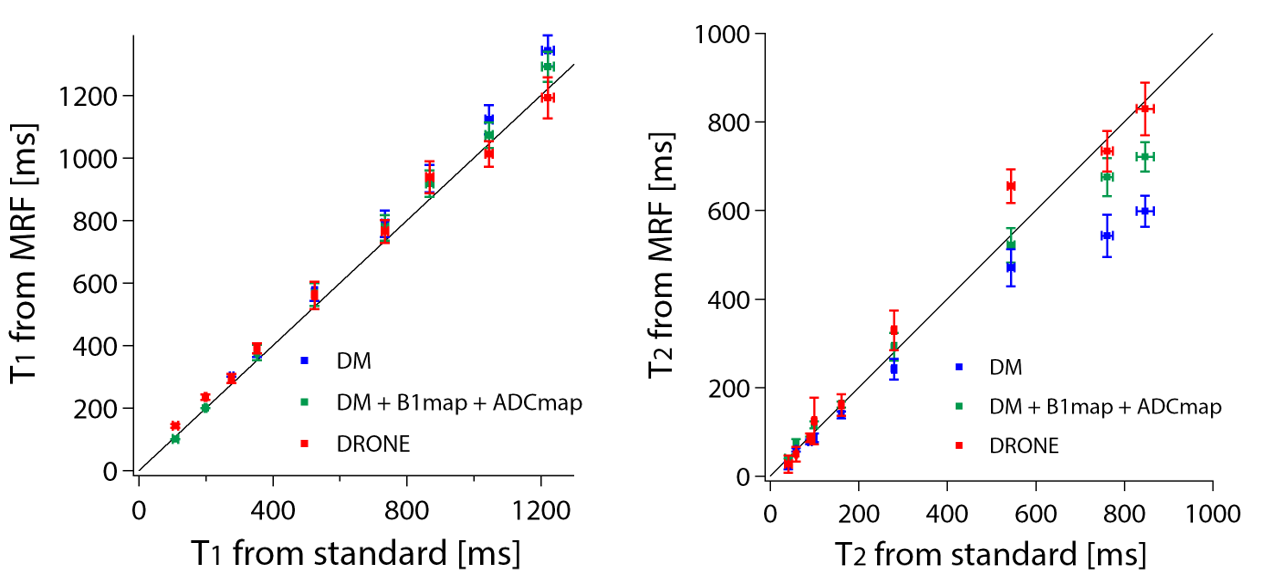
Figure 2 shows the T2 bias for DM and DRONE methods for numerical phantoms with various T2 and ADC values (with a 5 % noise). For DM, there was large errors and underestimation in T2 values, especially in the large T2 and ADC values, which corresponded to the previous study 2. Meanwhile, the bias was greatly suppressed for DRONE.Figure 3 and 4 compares the experimental results of T1 and T2 values obtained by different methods. For the DM, the T1 values were slightly overestimated in the long T1 region, but the overestimation was suppressed for the DRONE. For the DM, the T2 values were influenced by variations in B1 and ADC and significantly underestimated in the long T2 region. This underestimation was alleviated for the DM with the B1 and ADC maps. Meanwhile, the DRONE could suppress underestimation without these maps, and gave the accurate estimation of T1 and T2. These results reveal that the DRONE has high performance in multi-parametric estimation compared with the conventional method, and eliminated the need for additional scans to accurately estimate the relaxation times.
CONCLUSION
We verified the separability of multi-parameter using DRONE. We presented that the method could separate the relaxation times and the other parameters using only the signal evolutions acquired by single scan of MRF.Acknowledgements
No acknowledgement found.References
1. Dan Ma et al., Magnetic resonance fingerprinting, Nature 2013; 495: 187-193.
2. Y. Kobayashi et al., Diffusion-weighting Caused by Spoiler Gradients in the Fast Imaging with Steady-state Precession Sequence May Lead to Inaccurate T2 Measurements in MR Fingerprinting, Magn. Reson. Med. Sci., 2018; Jan 10; 18(1): 96-104.
3. O. Choen, B. Zhu, M. S. Rosen, MR fingerprinting Deep RecOnstruction Network (DRONE), Magn. Reson. Med., 2018; 80: 885-894.
4. S. Hashimoto et al, Development of a pulse programmer for magnetic resonance imaging using a personal computer and a high-speed digital input–output board, Rev. Sci. Instrum. 2012; 83: 053702.
Figures