3761
Comparing FLASH vs GRE for 2D cardiac MR fingerprinting1Biomedical Engineering Department, School of Biomedical Engineering and Imaging Sciences, King's College London, London, United Kingdom, 2Philips Healthcare, Guildford, United Kingdom, 3Philips Research Hamburg, Hamburg, Germany
Synopsis
2D Cardiac Magnetic Resonance Fingerprinting (cMRF) has been previously proposed to provide co-registered T1/T2 maps from a single breath-hold scan. Gradient Spoiled gradient echo (GRE) readout is conventionally employed for 2D cMRF. RF-spoiled readouts (FLASH) have reduced signal-to-noise ratio but are less sensitive to field inhomogeneities that may bias the parametric maps (if not encoded in the MRF sequence). Here we compare the performance of FLASH and GRE readouts for simultaneous T1/T2 mapping in 2D cMRF. Phantom and in-vivo results showed that both sequences produce comparable maps and reproducible values, however GRE-cMRF presented larger underestimations for T1 and T2.
INTRODUCTION:
Quantitative myocardial tissue characterization is an important diagnostic tool for the assessment of several heart diseases1. ECG-triggered cardiac MR fingerprinting2 (cMRF) has been proposed to provide simultaneous T1/T2 maps in a single breath-hold scan. Cardiac MRF employs variable magnetization preparation with interleaved inversion recovery (IR) and T2 preparation (T2prep) pulses to increase sensitivity to T1 and T2 parameters, commonly using gradient spoiled gradient echo (GRE) readouts. RF-spoiled readouts have reduced signal-to-noise ratio (SNR) but are less sensitive to field inhomogeneities that may bias the parametric maps (when not encoded in the cMRF sequence). Here we compare the performance of FLASH and GRE readouts for simultaneous T1 and T2 mapping in 2D cMRF. Repeatability and reproducibility of both methods were evaluated in a standardised T1/T2 phantom and six healthy subjects. Phantom measurements were compared against reference mapping techniques.METHODS:
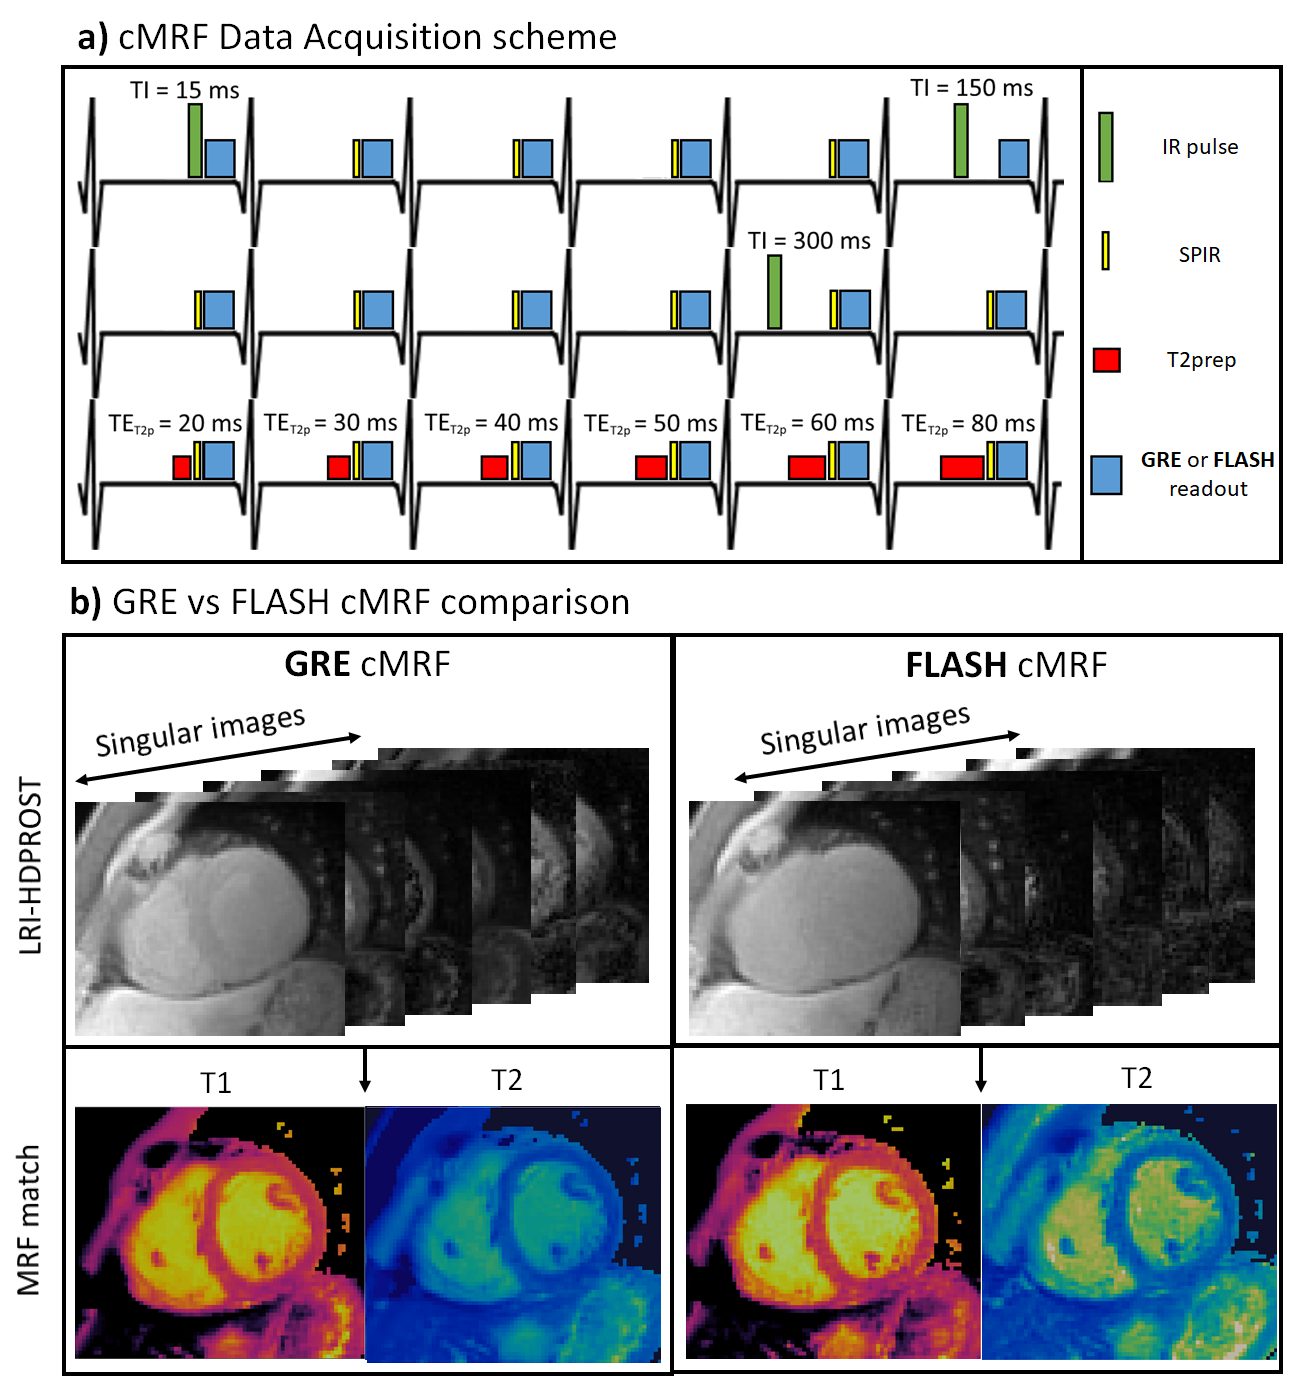
2D cMRF was acquired under breath-hold with ECG-triggering and spiral trajectory. Different IR and T2prep pulses were applied at each heartbeat to encode T1 and T2, following the preparation pattern depicted in Fig.1. A spectral presaturation with IR (SPIR) pulse is used before data acquisition to suppress aliasing artefacts originating from the fat signal. Data was acquired with either a GRE readout with 4π gradient spoiling or FLASH readout with the same gradient spoiling and a 50º quadratic RF phase increment. Data was reconstructed with LRI3 (Low Rank Inversion) – HDPROST4 (high dimensional patch-based reconstruction), solving the following problem:$$\bf{x} = argmin_x \parallel \bf{AU_rFCx-k} \parallel _2^2 + \lambda \sum_b \parallel \bf{T_bx} \parallel _*$$
where $$$A$$$, $$$U_r$$$, $$$F$$$ and $$$C$$$ are sampling, temporal compression (obtained from a truncated singular value decomposition of the MRF dictionary), non-uniform Fast Fourier Transform and coil sensitivity operators; $$$x$$$ are the temporally compressed singular images and $$$k$$$ is the k-space data, whereas $$$T_b$$$ constructs 3D local tensor around each voxel b in the image by concatenating local (within a patch), non-local (between similar patches) and contrast (along the singular value domain) voxels along each dimension. Same reconstruction parameters were used for both acquisitions.
EXPERIMENTS:
A standardised T1/T2 phantom5 and six healthy subjects were scanned at 1.5T (Philips Ingenia). Key parameters included: field of view =315x315mm2; 8 mm slice thickness; resolution=1.75x1.75mm2; TE/TR=0.9/7.1ms; 540 time-points; 5-10º sinusoidally varying flip angle6; acquisition window ~210ms; nominal scan time 18s. Reproducibility and repeatability were investigated for both phantom and in-vivo acquisitions. Three scans were performed for each method (GRE or FLASH readout): scans 1 and 2 were performed sequentially, whereas for scan 3 the phantom/subject was re-inserted and re-positioned in the table. In addition, the same acquisition protocol was repeated three times for the phantom. Phantom measurements were compared against reference inversion recovery spin-echo and multi-echo spin echo measurements for T1 and T2, respectively. Bias and coefficient of variation (CoV) were measured for the phantom. Mean and CoV (as surrogates for accuracy and precision, respectively) were evaluated in-vivo in a region of interest in the septum. Repeatability (difference between scans 1 and 2) and reproducibility (absolute difference between scans 2 and 3) were evaluated for both phantom and healthy subject acquisitions.RESULTS:
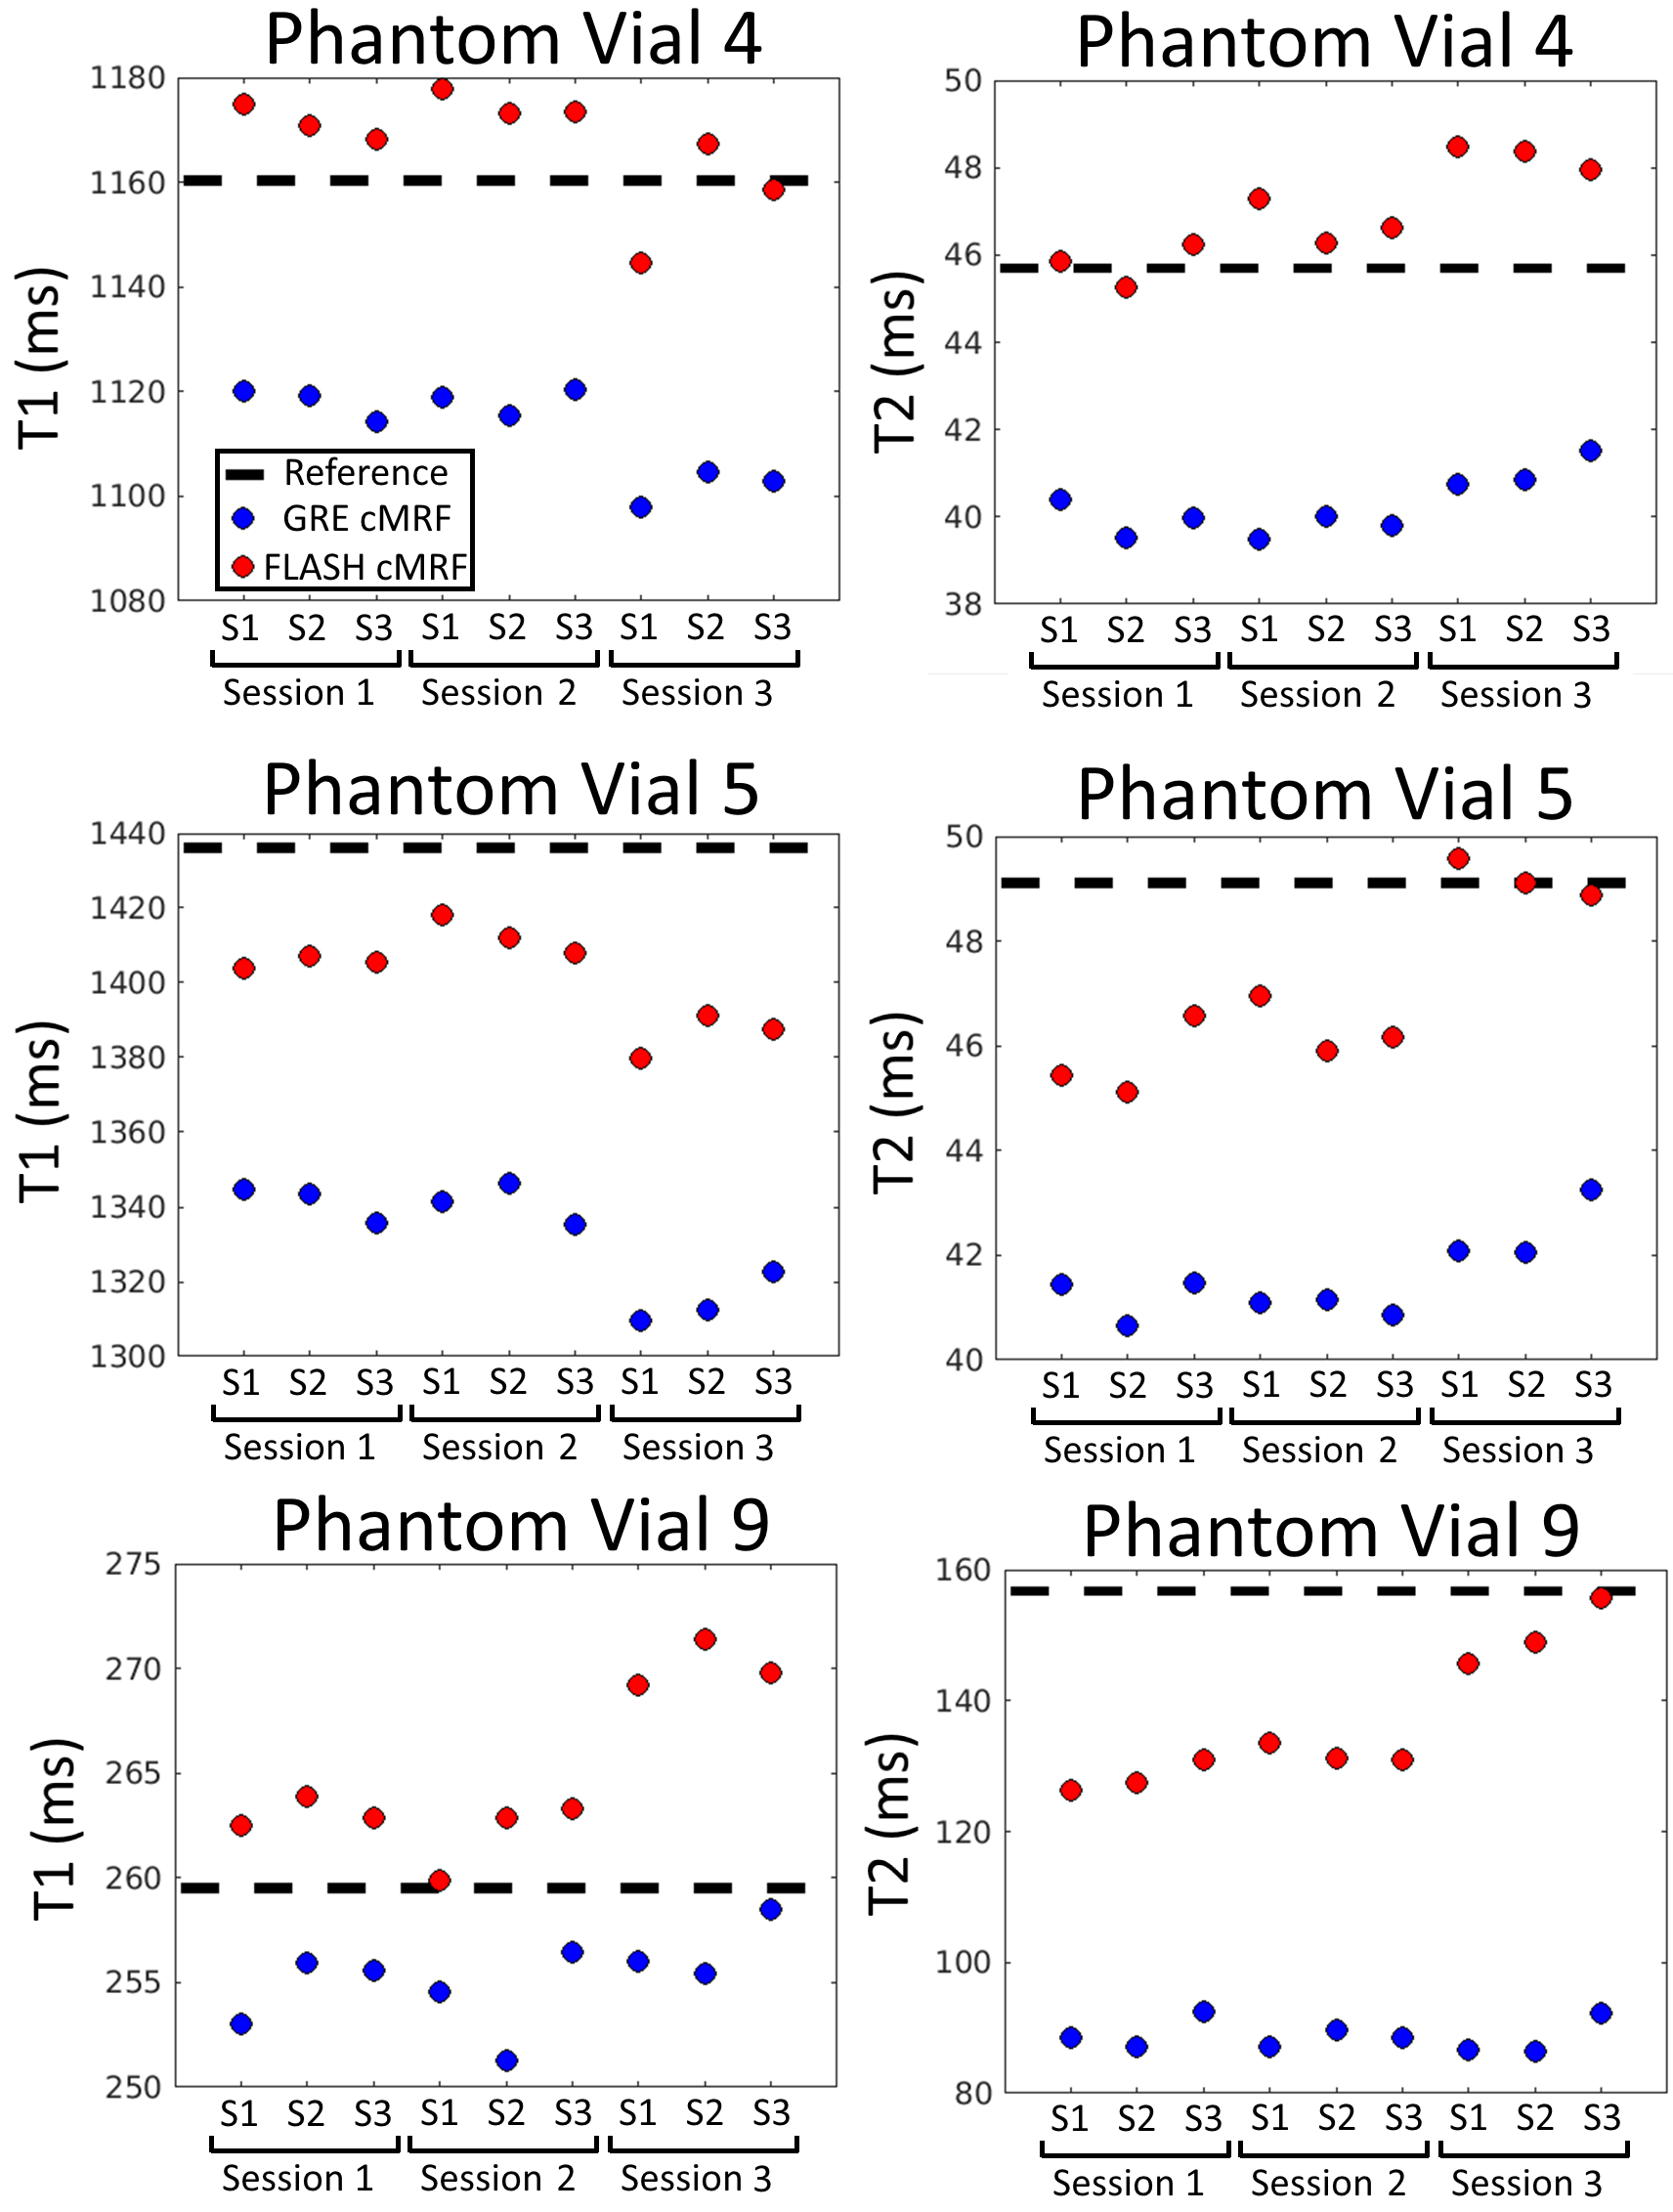
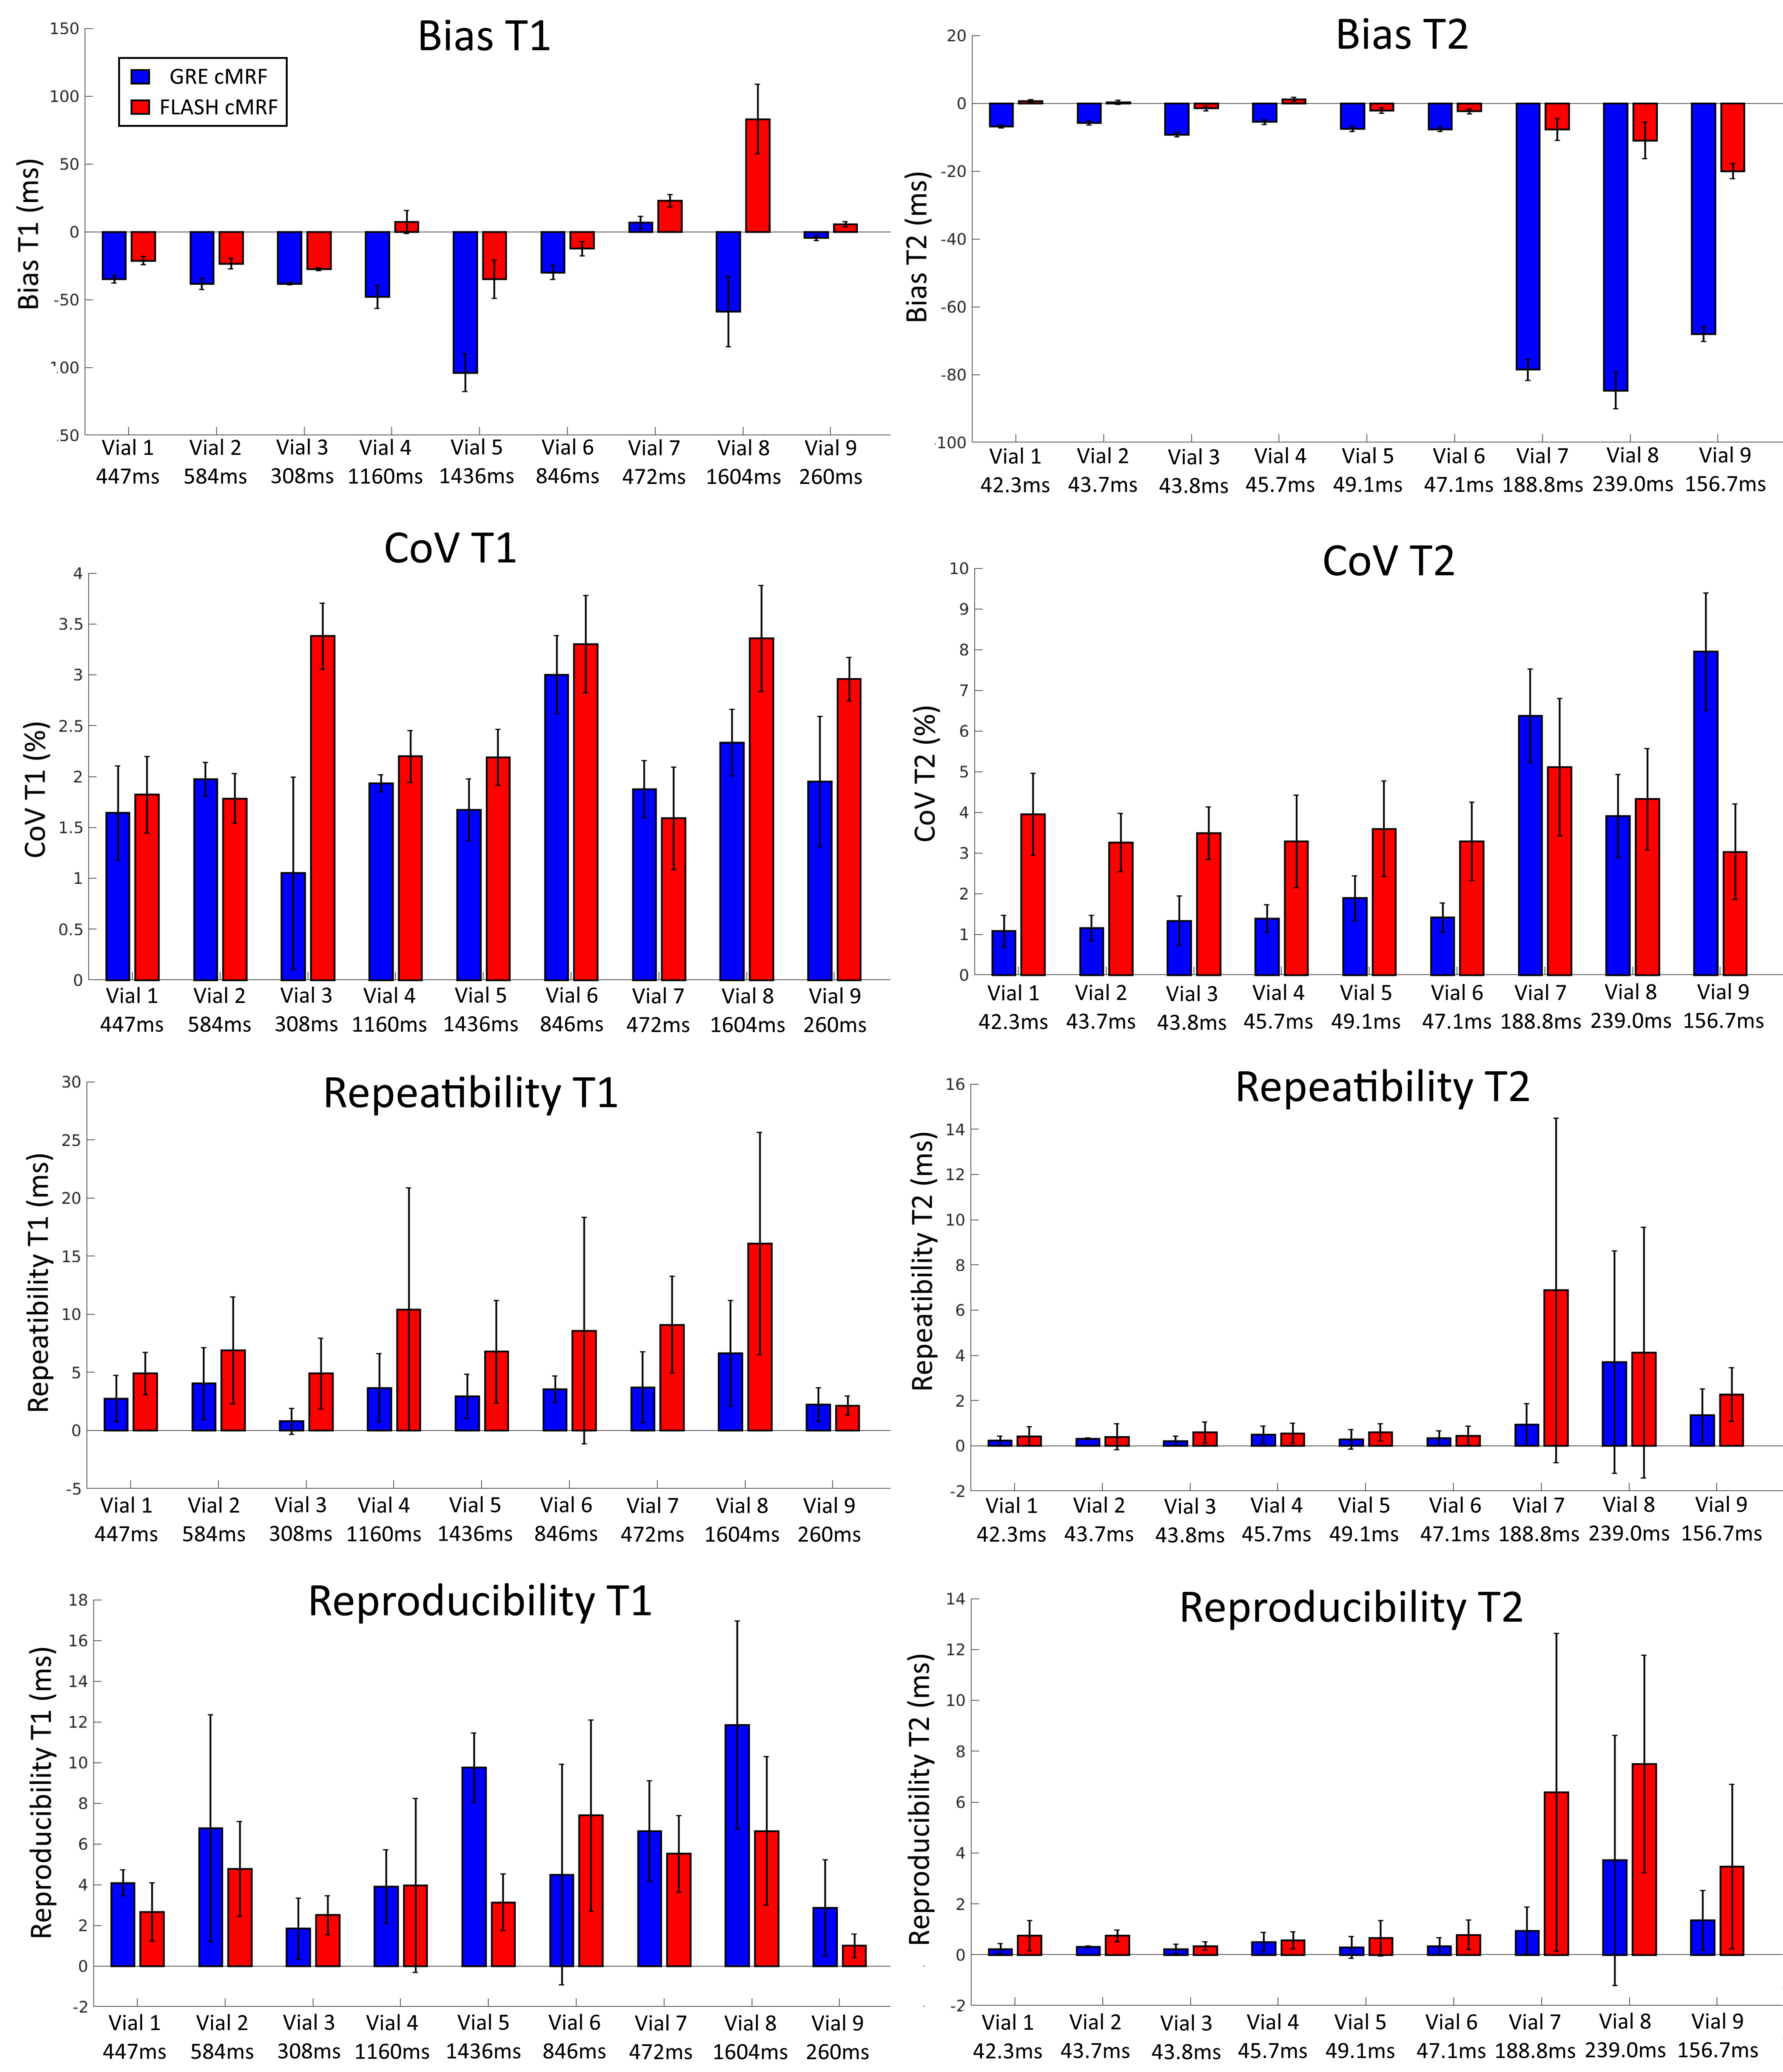
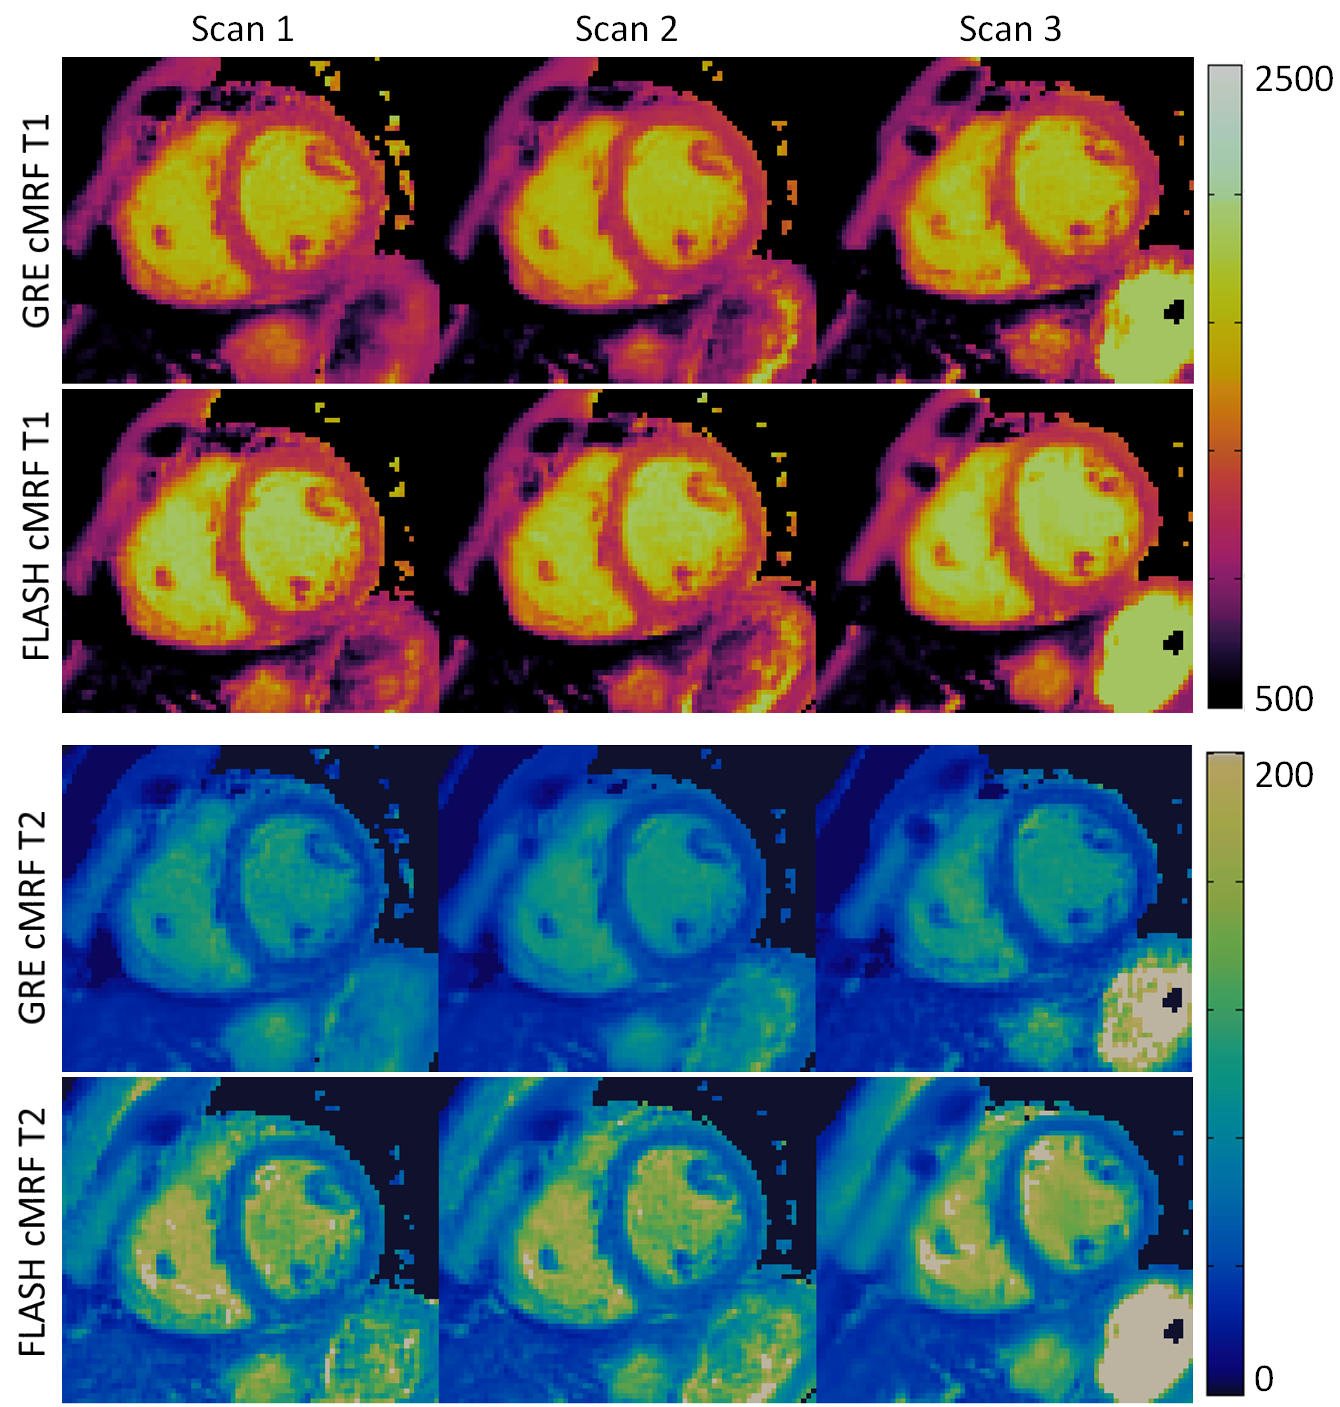
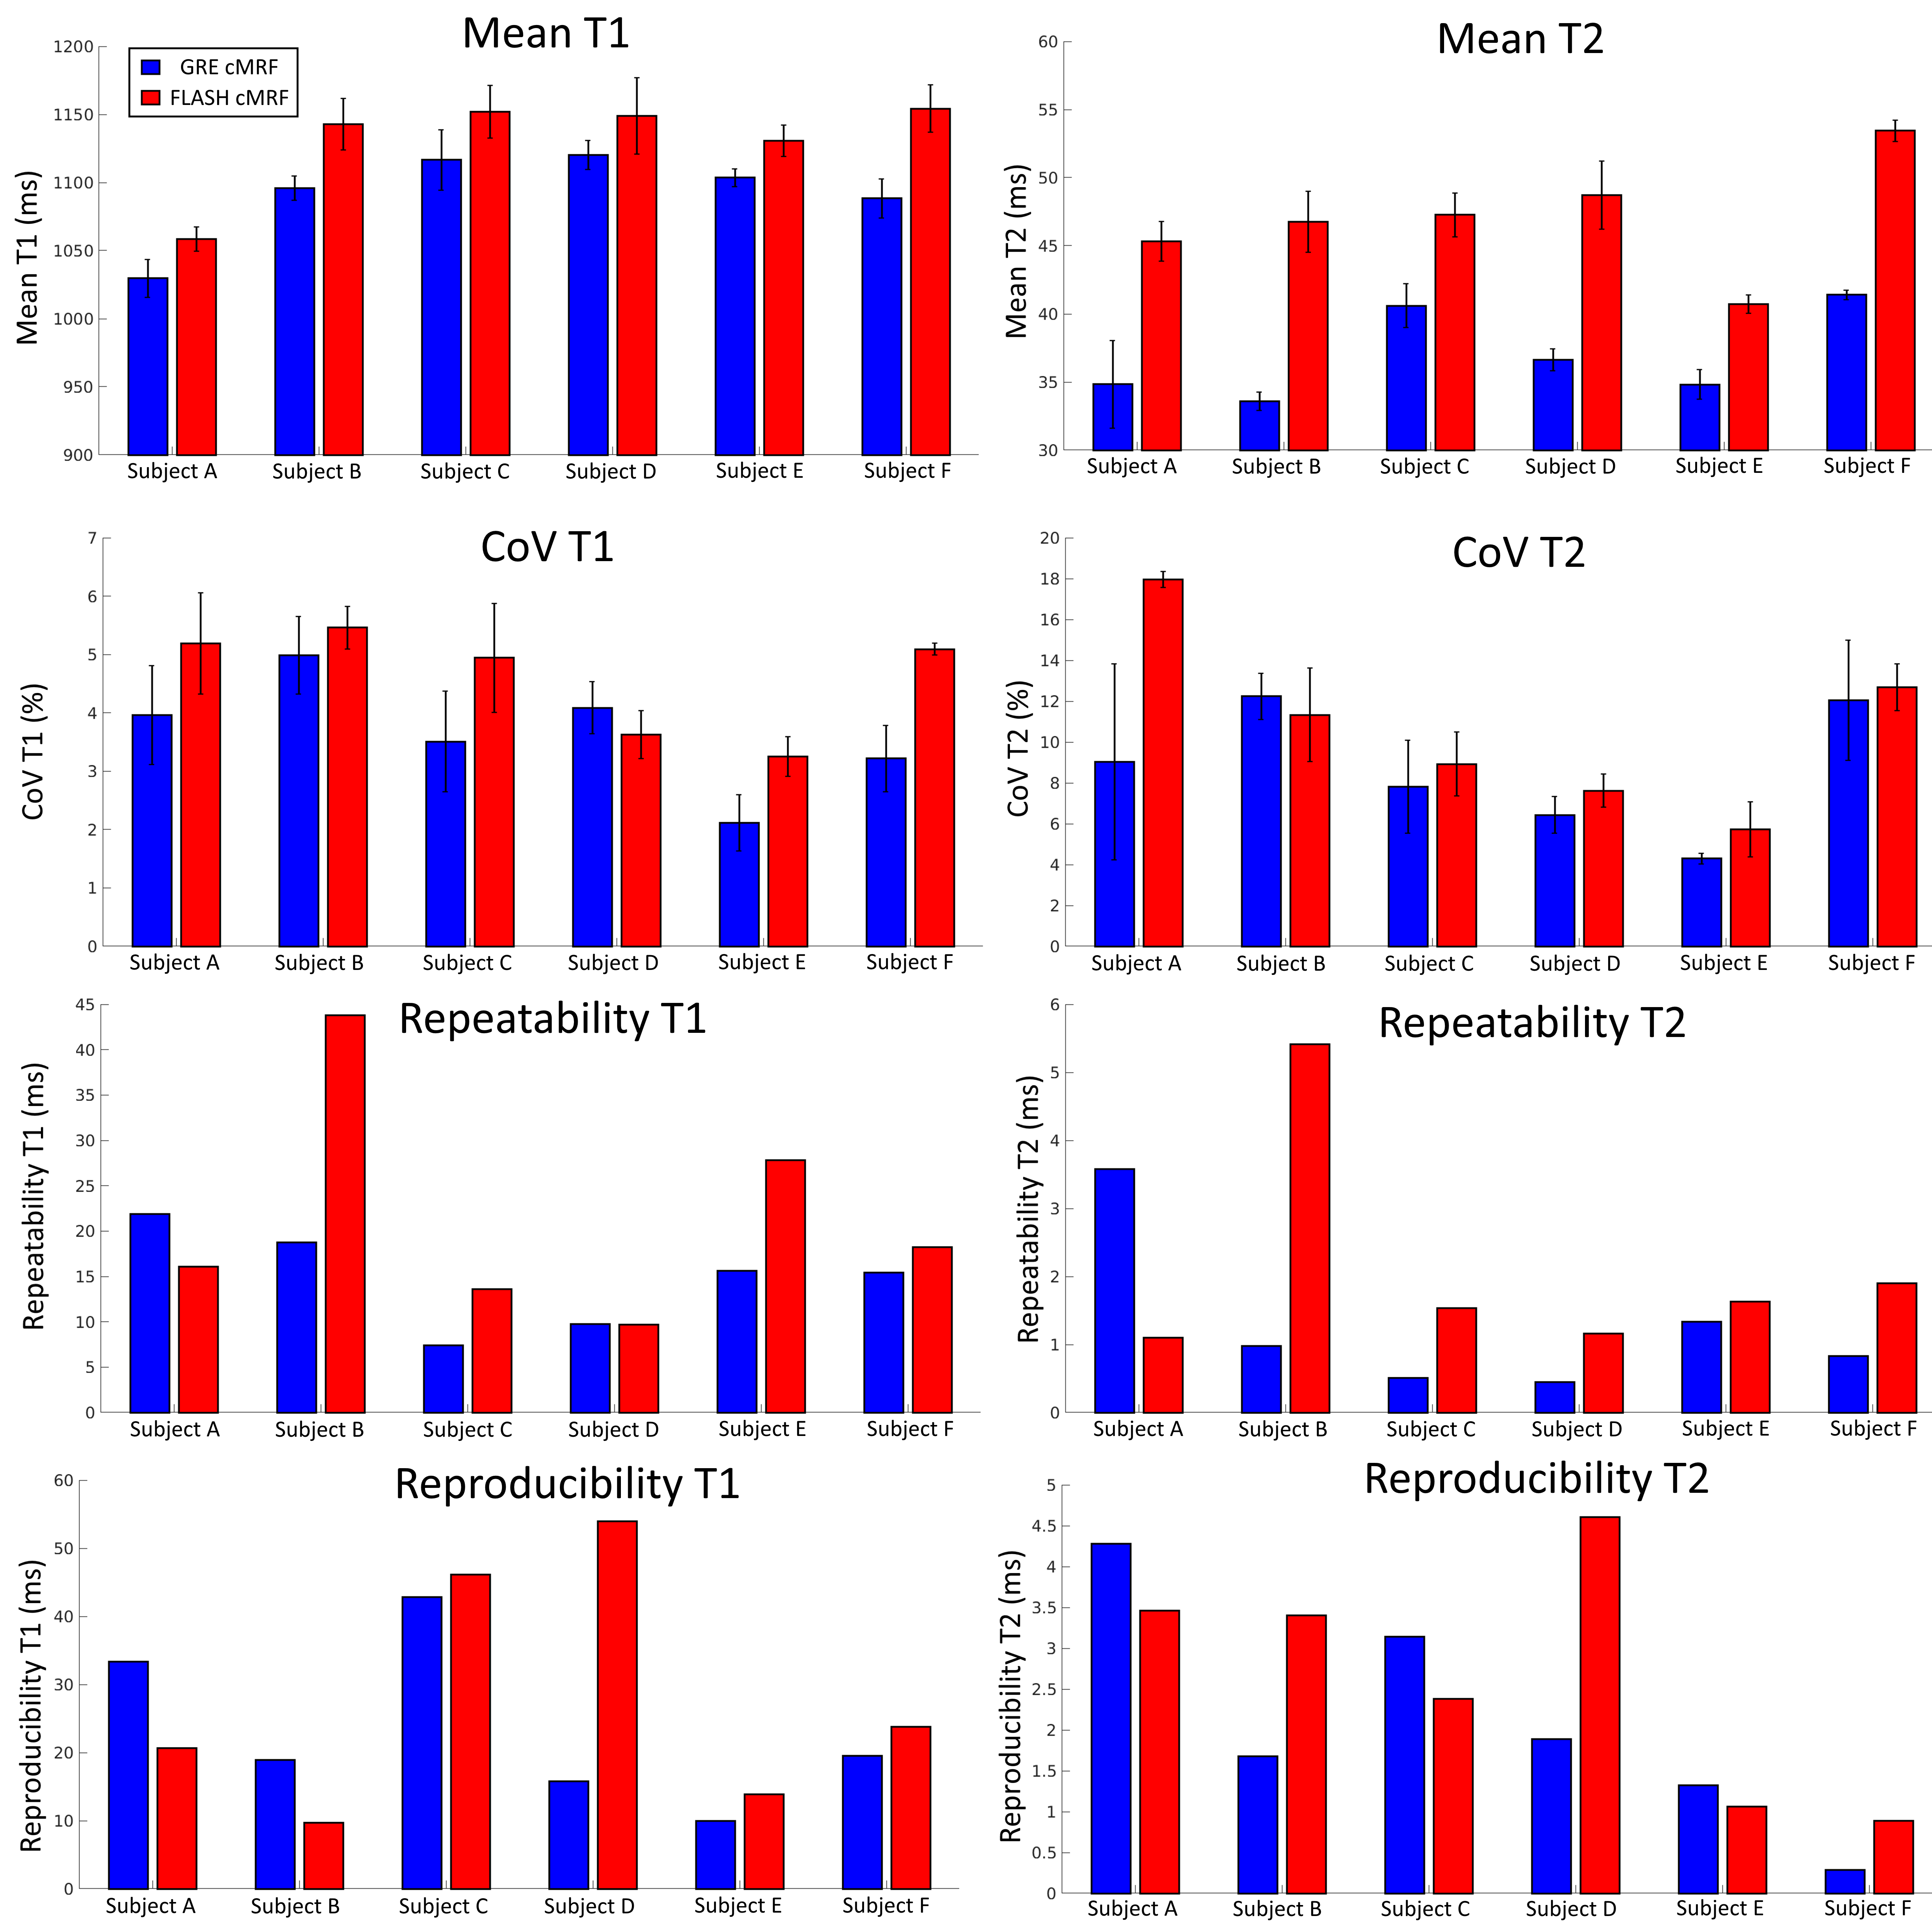
Phantom experiments presented errors of 5.2% and 3.8% in T1 and 14.4% and 3.0% in low T2 (<100 ms) for GRE and FLASH, respectively. A slight underestimation in T1/T2 was observed with both methods, these effects were more pronounced for T2 in GRE cMRF as seen in three representative values of the parametric phantom for all scanning sessions (Fig.2). Bias, coefficient of variation (CoV), repeatability and reproducibility for 2D cMRF with GRE and FLASH are shown in Fig.3 for all phantom vials. Comparing GRE and FLASH, GRE presented higher bias (absolute average 40 ms vs 26 ms for T1 and 7.0 ms vs 1.3 ms for T2), slightly lower CoV (average 1.9% vs 2.5% for T1 and 1.4% vs 3.5% for T2), better repeatability (average 3.4 ms vs 7.8 ms for T1 and 0.4 ms vs 0.5 ms for T2) and similar reproducibility (average 5.8 ms vs 4.2 ms for T1 and 0.4 ms vs 0.6ms for T2). In vivo both approaches produced parametric maps with similar quality, however GRE-based cMRF produced lower T1 and particularly lower T2 values than FLASH-based cMRF (Fig.4). Corresponding metrics comparing GRE and FLASH in a septal region of interest (ROI) are shown in Fig.5. In-vivo GRE estimated lower values (average 1093 ms vs 1131 ms for T1 and 37.0 ms vs 47.0 ms for T2), slightly lower CoV (average 3.6 % vs 4.6 % for T1 and 8.6 % vs 10.6 % for T2), improved repeatability (average 14.8 ms vs 21.6 ms for T1 and 1.3 ms vs 2.1 ms for T2) and slightly improved reproducibility (average 23.4 ms vs 28.1 ms for T1 and 2.1 ms vs 2.6 ms for T2).CONCLUSION:
2D cMRF was assessed in repeated experiments using GRE and FLASH readouts. Both approaches presented good repeatability and reproducibility, however GRE-cMRF presented larger underestimations for T1 and especially for T2. This could be possibly due to modelling errors or hardware errors leading to a dampened response of the stimulated echoes. Future work will further investigate this behavior and proceed towards clinical validation.Acknowledgements
ACKNOWLEGDMENTS: This work was supported by EPSRC (EP/P001009, EP/P032311/1) and Wellcome EPSRC Centre for Medical Engineering (NS/ A000049/1).References
1. Messroghli, D.R., Moon, J.C., Ferreira, V.M. et al. Clinical recommendations for cardiovascular magnetic resonance mapping of T1, T2, T2* and extracellular volume: A consensus statement by the Society for Cardiovascular Magnetic Resonance (SCMR) endorsed by the European Association for Cardiovascular Imaging (EACVI). J Cardiovasc Magn Reson 2017; 19, 75 doi:10.1186/s12968-017-0389-8
2. Hamilton JI, Jiang Y, Chen Y, et al. MR fingerprinting for rapid quantification of myocardial T 1 , T 2 , and proton spin density. MRM 2017;77:1446–1458.
3. Assländer J, Cloos MA, Knoll F, Sodickson DK, Hennig J, Lattanzi R. Low Rank Alternating Direction Method of Multipliers Reconstruction for MR Fingerprinting. MRM 2017; 79:83-96. doi:10.1002/mrm.26639.
4. Bustin A, Cruz G, Jaubert O, Lopez K, Botnar RM, Prieto C. High-dimensionality undersampled patch-based reconstruction (HD-PROST ) for accelerated multi-contrast MRI. Magn. Reson. Med. 2019;3705–3719 doi: 10.1002/mrm.27694.
5. Captur G, Gatehouse P, Kellman P, et al. A T1 and ECV phantom for global T1 mapping quality assurance: The T1 mapping and ECV standardisation in CMR (T1MES) program. J. Cardiovasc. Magn. Reson. 2016;18:4–6 doi: 10.1186/1532-429x-18-s1-w14.
6. Hamilton JI, Jiang Y, Ma D, Lo WC, Gulani V, Griswold M, Seiberlich N. Investigating and reducing the effects of confounding factors for robust T1 and T2 mapping with cardiac MR fingerprinting. Magnetic resonance imaging. 2018 Nov 1;53:40-51.
Figures