3759
Accuracy, reproducibility and temperature variability of Magnetic Resonance Fingerprinting using the ISMRM/NIST system phantom1Imperial College London, London, United Kingdom, 2Medical Research Council, London Institute of Medical Sciences, London, United Kingdom, 3Department of Imaging, Imperial College Healthcare NHS Trust, London, United Kingdom, 4Department of Bioengineering, Imperial College London, London, United Kingdom, 5Department of Surgery and Cancer, Imperial College London, London, United Kingdom
Synopsis
Magnetic Resonance Fingerprinting (MRF) is a technique which produces multiple parametric maps during a single fast acquisition. Before MRF can be adopted clinically, quantitative values derived from these maps must be proven accurate and reproducible over a range of T1 and T2 values and temperatures. The aim of this study was to investigate the accuracy and reproducibility of T1and T2 values derived from two different methods of MRF compared to conventional quantitative maps using the ISMRM/NIST system phantom.
Introduction
Magnetic Resonance Fingerprinting (MRF) is a technique which produces multiple parametric maps during a single fast acquisition1. Before MRF can be adopted clinically, quantitative values derived from these maps must be proven accurate and reproducible over a range of T1 and T2 values and temperatures. The aim of this study was to investigate the accuracy and reproducibility of T1and T2 values derived from two different methods of MRF compared to conventional quantitative maps using the ISMRM/NIST system phantom.Methods
This study was performed on the ISMRM/NIST system phantom using a 3T Magnetom Prisma scanner (Siemens Healthcare, Erlangen, Germany) and a 64-channel head/neck coil. The protocol comprised a 2D multi-echo spin echo (MESE: TR 3520ms, TE: 24ms, 48ms, 72ms, 96ms, 120ms, 144ms and 168ms, 1x1x5mm voxels)2, a 3D VIBE with 6 different flip angles (VFA: TR 10ms, TE 1.43ms, FA: 2°, 8°,12°,15°, 20° and 26°, 1x1x5mm voxels)3, a prototype implementation of a 2D FISP MRF with 1x1x5mm voxels and spiral read-out using 1500 measurements (MRF-1500) and 3000 measurements (MRF-3000)4. Each of these four sequences was performed twice during each session and then this same protocol was repeated nine times over the course of two months.The phantom was stored in the scanner room. Before each scanning session the temperature of the deionized water within the phantom was measured using digital thermometer. The phantom was then placed in the coil within the scanner for 30 minutes before acquisition to reduce the effects of the liquid motion.
The mean and standard deviation (SD) of each sphere was measured from a circular region of interest (ROI) of 80 voxels manually drawn to avoid edges on the T1 and T2 maps. As the B1 field correction in the current implementation of the MRF sequence is only accurate above a T1 relaxation time of 400ms, only those spheres with a value greater than this were included in the analysis5.
The repeatability of the T1 and T2 measurements from each of the methods, expressed as the coefficient of variation, was calculated as the ratio of the standard deviation to the mean of the T1 and T2 values over all the scanning sessions. The mean bias and limits of agreement (LoA) between the T1 and T2 values derived from each of the methods was assessed by Bland Altman analysis. Correlation between temperature of the phantom and T2 and T1 values was also performed.
Results
The mean, standard deviation and coefficient of variation for each of the methods is summarized in Table 1 and examples for two spheres of T1 and T2 shown in Figures 1 and 2 respectively.Bland-Altman analysis (Figure 3) revealed a mean bias for T1 measurements between the MRF-1500 and the VFA of 113ms (95% LoA, -50ms to 277ms), between the MRF-3000 and the VFA of 109ms (95% LoA, -46ms to 256ms) and between the MRF-1500 and MRF-3000 of 3.8ms (95% LoA, -16.6ms to 24.3ms). The mean bias for T2 measurements between the MRF-1500 and MESE was 13ms (95% LoA, -37ms to 63ms), between the MRF-3000 and MESE of 14ms (95% LoA, -29ms to 57ms) and between the MRF-1500 and MRF-3000 of -1ms (95% LoA, -13ms to 11ms).
There was a statistically significant correlation between the measured T1 and the temperature of the phantom for sphere 2 (T1=1398ms) for the VFA (R2=0.46, p<0.05)), the MRF-1500 (R2=0.67, p<0.05) and the MRF-3000 (R2=0.53, p<0.05) (Figure 4a). Noticeably there was a steeper slope for the VFA (31x) compared to the MRF-1500 (18.6x) and MRF-3000 (17.2x). For sphere 3 (T1=998.3) there was a statistically significant correlation between the measured T1 and the temperature for the VFA (R2=0.31, p=0.01) but not for either of the MRF methods (Figure 4b). There was no significant correlation found between the temperature and any of the other T1 values derived from conventional mapping technique or MRF, neither was there any significant correlation between the temperature and the derived T2 values for any of the techniques (examples Figure 4c,d).
Discussion
MRF derived T1 values in the range 1838ms to 509ms varied less than 2.1%, and T2 values in the range 645ms to 31ms varied less than 5% in 9 sessions over two months using the ISMRM/NIST system phantom. The T2 measurements had greater variation than the T1 measurements which agrees with previously published results6. Agreement between the two MRF techniques was excellent, suggesting that the use of the 1500 dictionary could be more practical in clinical practice as it can be acquired in half the time and is a significantly quicker to reconstruct. The T1 values derived from the MRF were less susceptible to temperature variations than the VFA method, especially at the T1 values which would be encountered clinically in the brain. This finding would need to be studied more thoroughly in future work.Conclusion
MRF is a highly reproducible method for T1 and T2 mapping with seemingly less temperature variation than conventional methods. There is very little difference in derived T1 and T2 values from the MRF method using the 1500 dictionary and that using the 3000 dictionary.Acknowledgements
The authors would like to acknowledge funding from the Imperial CRUK Centre and the Imperial NHS Imaging Department. Thanks also to the Imperial MRI Physics Collective, Iulius Dragonu and Mathias Nittka, Siemens Healthineers, UK and Germany.References
1. Ma D, et al. Magnetic resonance fingerprinting. Nature 2013; 495: 187–192.
2. Liberman G, et al. T1 mapping Using Variable Flip Angle SPGR Data with Flip Angle Correction. Magn Reson Imaging 2014; 40:171-180.
3. Pei M, et al. An Algorithm for Fast Mono-exponential Fitting Based on Auto-Regression on Linear Operations (ARLO) of Data. J Magn Reson Med. 2015; 73(2):843-850.
4. Jiang Y, et al. MRI Fingerprinting Using Fast Imaging with Steady State Precision (FISP) with Spiral Readout. Magn Reson Med. 2015; 74:1621-1631.
5. Chung S, Kim D, Breton E, Axel L. Rapid B1+ mapping using a preconditioning RF pulse with turboFLASH readout. Magn. Reson. Med. 2010;64:439–446.
6. Jiang Y, et al. Repeatability of magnetic resonance fingerprinting T1 and T2 estimates assessed using the ISMRM/NIST MRI system phantom. J Magn Reson Med. 2015; 78(4);’1452-1457.
Figures

Table 1.
Mean, standard deviation (SD) and coefficient of variation (CV) for T1 and T2 values obtained over 9 sessions from the MESE,VFA, MRF-1500 and MRF-3000 sequences alongside the reference values provided by the manufacturer for the ISMRM/NIST phantom.

Figure 1.
(a) and (c). T1 values from 2 spheres with a reference T1 value (dotted red line) similar to that found in vivo from the T1 array of the phantom measured over 9 separate scanning sessions. The two repeats in each session marked by triangle and circle. (b) and (d) boxplots comparing mean T1 estimates derived from VFA, MRF-1500 and MRF-3000 in those same spheres.
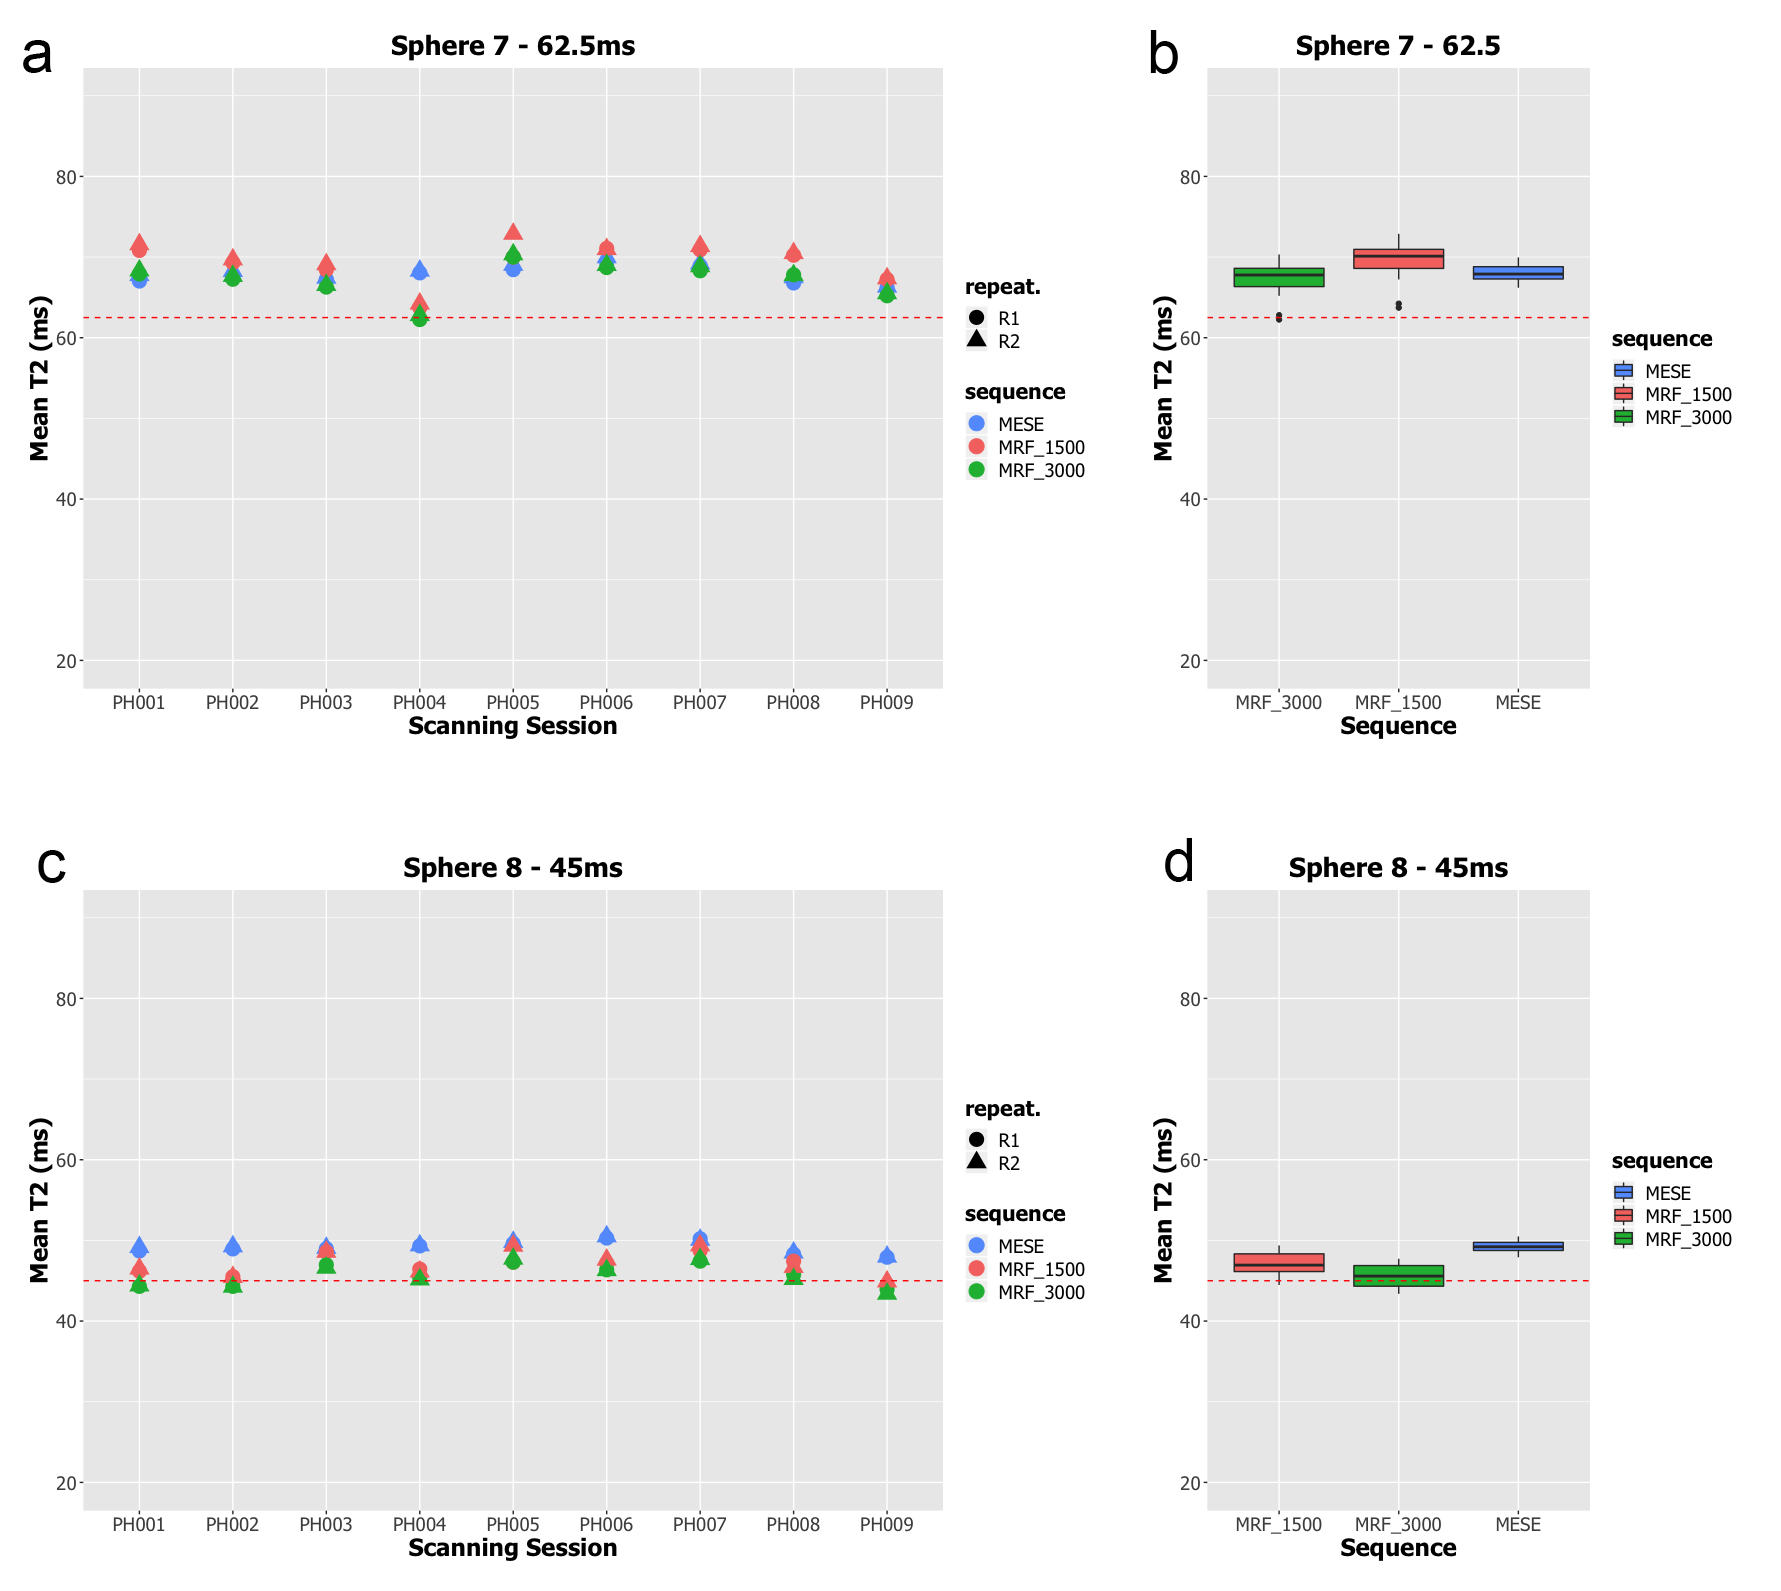
Figure 2.
(a) and (c). T2 values from 2 spheres with a reference T2 value (dotted red line) similar to that found in vivo from the T2 array of the phantom measured over 9 separate scanning sessions. The two repeats in each session marked by circle and triangle. (b) and (d) boxplots comparing mean T1 estimates derived from VFA, MRF-1500 and MRF-3000 in those same spheres.

Figure 3.
Bland-Altman plots comparing T1 values derived from the VFA, MRF-1500 and MRF-3000 acquisitions (a,b,c), and T2 values derived from the MESE, MRF-1500 and MRF-3000 acquisitions (d,e,f).

Figure 4.
Correlation plots displaying temperature variation of the measured T1 in two sample spheres from the T1 array (a and b) and variation of the measured T2 in two sample spheres from the T2 array (c and d), red dotted line represents respective expected T1 and T2 value.