3758
Two-site repeatability study of Tailored Magnetic Resonance Fingerprinting (TMRF)1Columbia Magnetic Resonance Research Center, New York, NY, United States, 2Memorial Sloan Kettering Cancer Center, New York, NY, United States, 3GE Healthcare Applied Sciences Laboratory East, New York, NY, United States
Synopsis
This work evaluates repeatability of T1 and T2 estimation of the TMRF method compared to MRF and the gold standard measurements at two sites. In this work, we acquired data for 10 days on ISMRM/NIST phantom using the three methods at the two sites with the same vendor and field strength. The data was reconstructed and matched with an EPG simulated dictionary. ROI analysis was performed to extract T1 and T2 estimation for each sphere. The results and statistical analysis are presented here.
Introduction
Magnetic resonance fingerprinting (MRF) is a framework that allows for simultaneous quantification of tissue properties1. However, one challenge is that image contrasts are synthetically generated from parametric maps and are affected by artifacts due to flow, off-resonance, and inaccurate estimation of tissue properties. Tailored magnetic resonance fingerprinting (TMRF) mitigates this challenge by tailoring natural contrast from raw data yet maintains the fingerprinting acquisition scheme2. To evaluate the consistency and accuracy of TMRF compared to the gold standard measurements and MRF, we conduct a repeatability study over 10 days using ISMRM/NIST MRI system phantom to evaluate the T1 and T2 estimates of both MRF and TMRF methods in two sites.Method
The ISMRM/NIST phantom (QalibreMD Inc, CO, USA) has three layers of spheres with a large range of T1, T2, and PD values3. In this study, we use a phantom with a series number higher than 0042. Gold standard T1 and T2 measurements were conducted using inversion recovery spin echo (IRSE) and spin echo (SE) sequences on a GE 3T Discovery 750w scanner. T1 gold standard measurements from T1 array was acquired using inversion recovery spin echo (IRSE) sequence with inversion time (TI) of 50 ms, 100 ms, 200 ms, 400 ms, 800 ms, 1600 ms and 3200 ms with a repetition time (TR) of 10000 ms, an echo time (TE) of 12 ms, a matrix size of 256x256, a field of view (FOV) of 17 cm, and a slice thickness of 5 mm. T2 gold standard measurements from T2 array was acquired using multiple spin echo (SE) sequence with echo time (TE) of 12 ms, 22 ms, 42 ms, 62 ms, 102 ms, 152 ms, and 202 ms with a repetition time (TR) of 10000 ms, a matrix size of 256x256, a field of view (FOV) of 21 cm, and a slice thickness of 5 mm. A pixel-based curve fitting was used to estimate the T1 and T2 gold standard measurements. The magnitude of T1 images was fitted to the model $$$S_0(1-2exp(-TI/T1)+exp(-TR/T1))+b$$$. The magnitude of T2 images was fitted to the model $$$S_0exp(-TE/T2)$$$. For repeatability experiments, the phantom was placed in the scanner room the night before experiments to minimize temperature variations. Temperature was measured before and after each experiment. Data was acquired using ISMRM/NIST phantom on GE 3T Discovery 750w scanner with an 8-channel head coil. 20 slices were acquired each time to cover all three layers of the phantom. The collected data from each coil was then sliding window reconstructed using Michigan Image Reconstruction Toolbox (MIRT) for Non-Uniform Fast Fourier reconstruction of spiral k-space data. The reconstructed data of each channel was corrected for phase and then combined to form the final image. The final image data was matched with EPG-generated dictionary using vector dot product. Manual ROI analysis was conducted on all datasets by experts. 70 pixels were selected for each sphere in T1 and T2 maps.Results
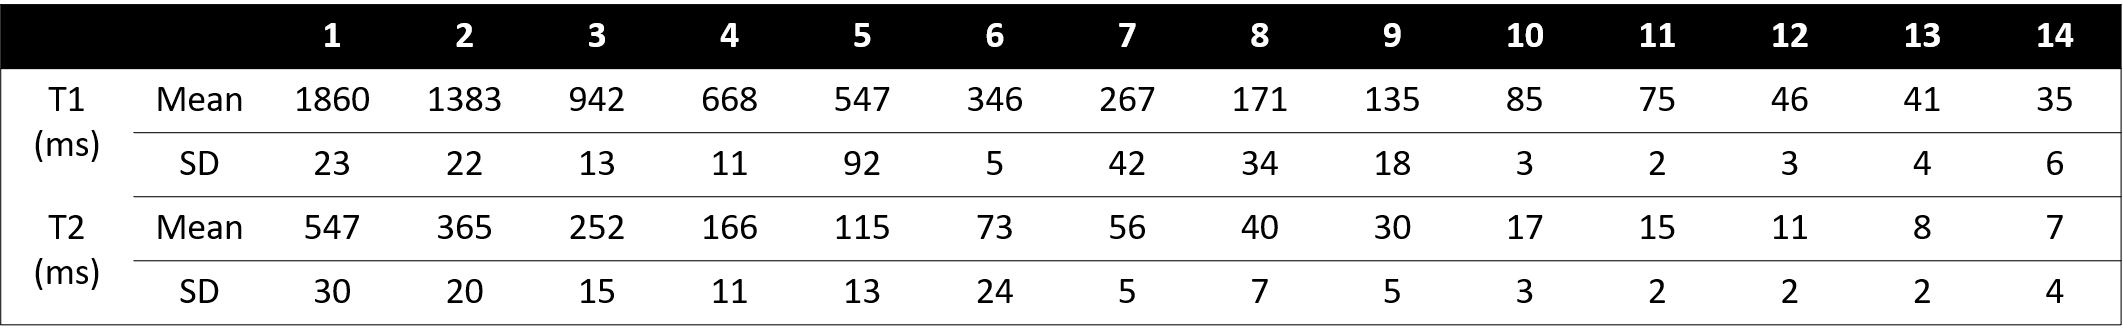
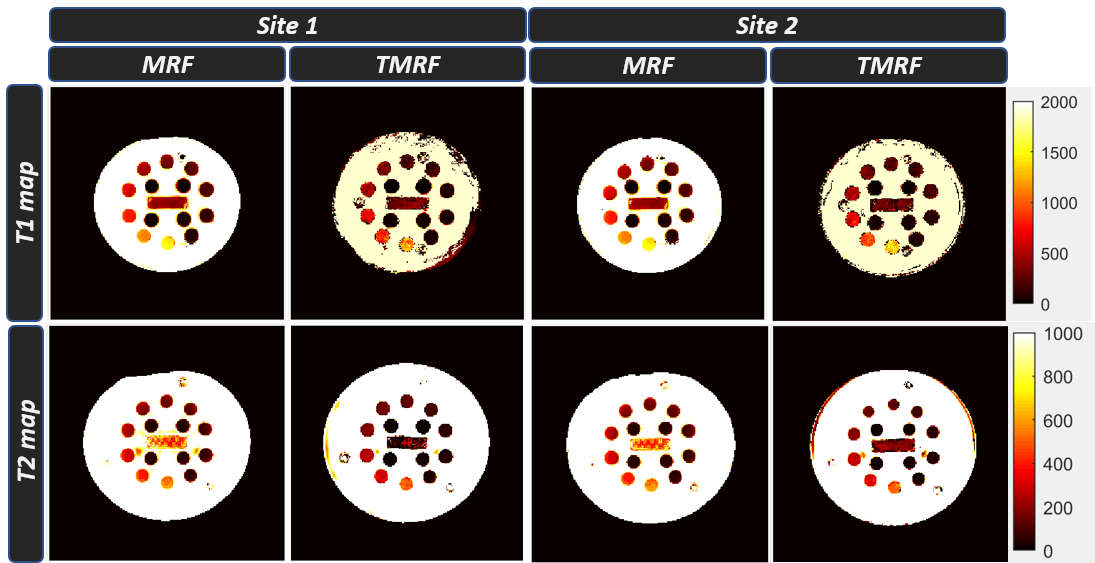
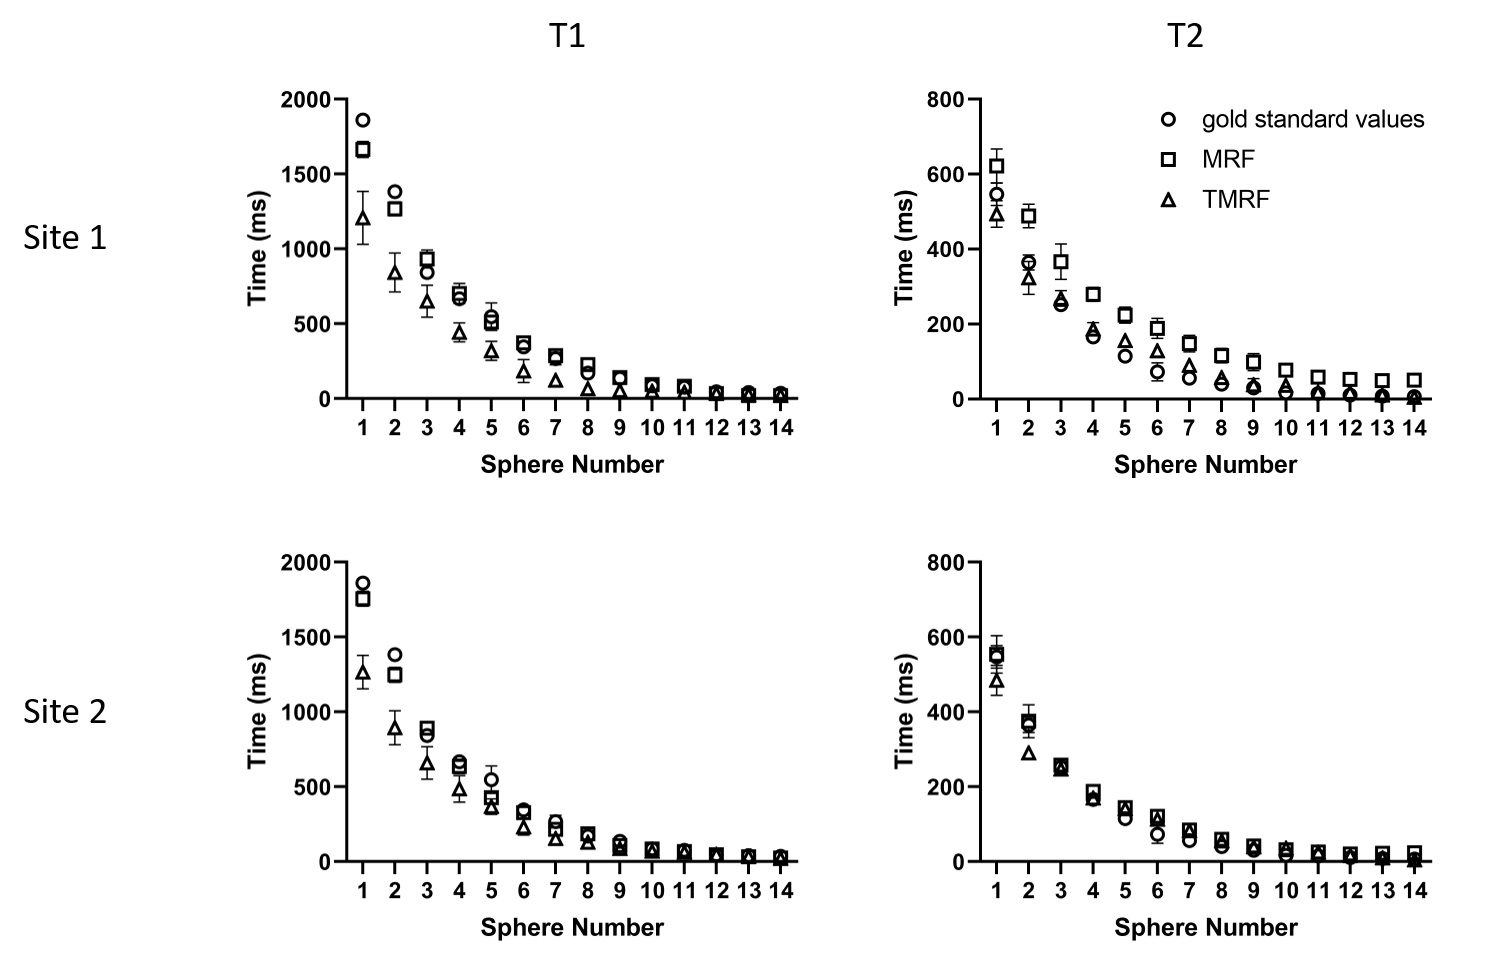
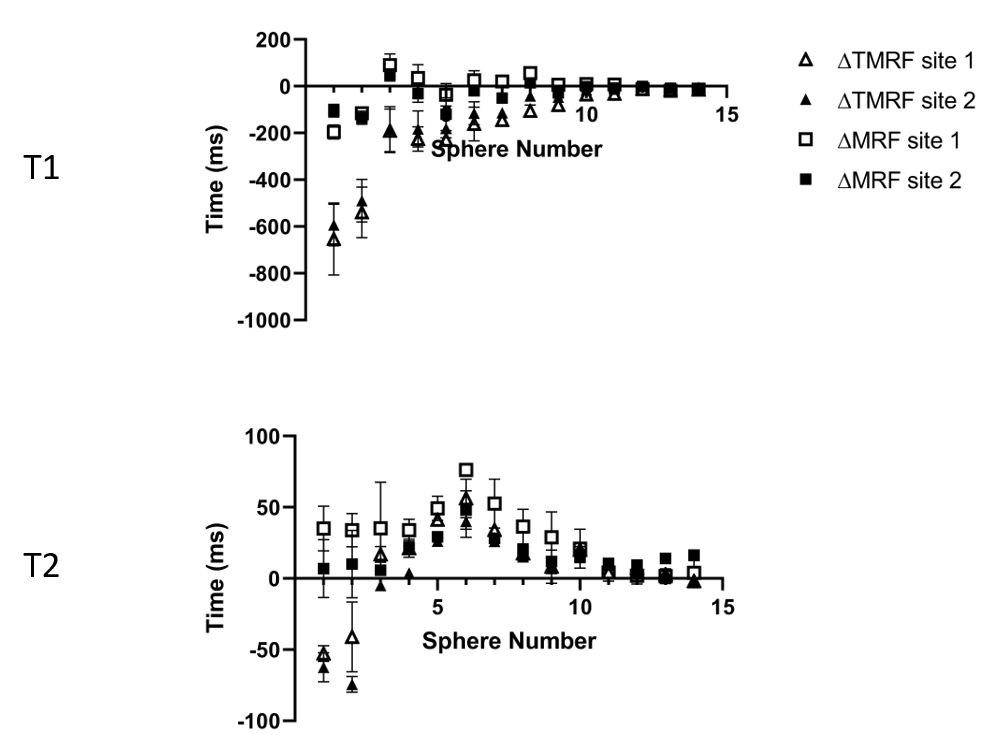
Figure 1 compares gold standard contrasts, MRF synthetic, TMRF synthetic, and TMRF natural contrasts. MRF and TMRF synthetic contrasts were generated from T1, T2 and proton density maps. TMRF natural contrasts were generated by selecting TMRF schedule tailored to that contrast. Figure 2 shows the mean and standard deviation of gold standard measurements. The T1 values from gold standard measurements were within 5% of the values reported by NIST3. The T2 gold standard values underestimated reported values. Figure 3 shows eight datasets of MRF and TMRF from two sites. T1 and T2 maps were calculated for their respective plates. Figure 4 compares gold standard values, MRF and TMRF data from two sites for both T1 and T2 values. MRF and TMRF data were averaged from 10-day repeatability scans. It can be observed that TMRF consistently underestimated long T1 gold standard values across two sites. MRF also underestimated but to a lesser degree. Figure 5 shows the difference between MRF and TMRF data with gold standard values for both T1 and T2 values from two sites. ΔMRF and ΔTMRF were calculated by subtracting gold standard value from 10-day repeatability scans. Two sites have similar estimations for T1 values, but T2 values differ with higher order of standard deviation.Conclusion
In this study, we evaluated the repeatability and accuracy of TMRF compared to MRF. The underestimation by T2 gold standard scans may be attributed to inhomogeneous coil sensitivity. We are analyzing coil sensitivity maps to address this issue. The underestimation of TMRF of long T1 values may be corrected by a constant bias term. For T2 MRF values, site 1 is close to reported values by NIST while site 2 is close to gold standard values. The higher order of standard deviation in T2 values may be due to B1 variations from day to day. We are analyzing our B1 maps to resolve this issue. Our study suggests that MRF is more accurate than TMRF in estimating longer T1 values, but similar to or worse than TMRF in estimating T2 values.Acknowledgements
No acknowledgement found.References
[1] Ma D, Gulani V, Seiberlich N, Liu K, Sunshine JL, Duerk JL, Griswold MA: Magnetic resonance fingerprinting. Nature 2013, 495:187–192.
[2] Balsiger F. et al. (2018) Magnetic Resonance Fingerprinting Reconstruction via Spatiotemporal Convolutional Neural Networks. In: Knoll F., Maier A., Rueckert D. (eds) Machine Learning for Medical Image Reconstruction. MLMIR 2018. Lecture Notes in Computer Science, vol 11074. Springer, Cham
[3] Russek SE, Boss M, Jackson EF, Jennings DL, Evelhoch JL, Gunter JL, Sorensen AG. Characterization of NIST/ISMRM MRI system phantom. In Proceedings of the 20th Annual Meeting of ISMRM, Melbourne, Austraia, 2012. Abstract 2456.
Figures