3757
Validity and reproducibility of Magnetic Resonance Fingerprinting in the healthy human brain at 3T1Department of Imaging, Imperial College Healthcare NHS Trust, London, United Kingdom, 2Department of Bioengineering, Imperial College London, London, United Kingdom, 3MRC London Institute of Medical Sciences, Imperial College London, London, United Kingdom, 4Department of Surgery and Cancer, Imperial College London, London, United Kingdom
Synopsis
Obtaining quantitative measurements in a 7-minute acquisition could improve the sensitivity of MR diagnosis. We investigated the validity and reproducibility of magnetic resonance fingerprinting (MRF) relaxometry in 12 tissue compartments in the human brain through comparison to standard mapping techniques: variable flip angle for T1 and multi-echo spin echo for T2. Statistically significant strong and moderate correlations were found between the MRF and standard mapping methods for T1 and T2, respectively. The MRF results were shown to be highly reproducible and in agreement with values found within the literature. However, a bias was found between MRF and standard relaxometry methods.
Introduction
Quantitative MR could offer increased sensitivity to pathologic changes in tissue before morphologic changes are apparent on qualitative standard imaging. However, due to the difficulty in reproducibility of measurement and consistency between scanners, quantitative MR relaxometry has remained under-investigated and under-utilised. Magnetic Resonance Fingerprinting (MRF) permits whole brain quantitative measurements of multiple parameters (T1, T2, B1, M0) from a single 7-minute acquisition, which is considerably faster than the current standard mapping methods. Our aim was to investigate the validity and reproducibility of the relaxation maps from an MRF prototype sequence in various brain tissue compartments by comparing them to quantitative maps produced using established methods.Methods
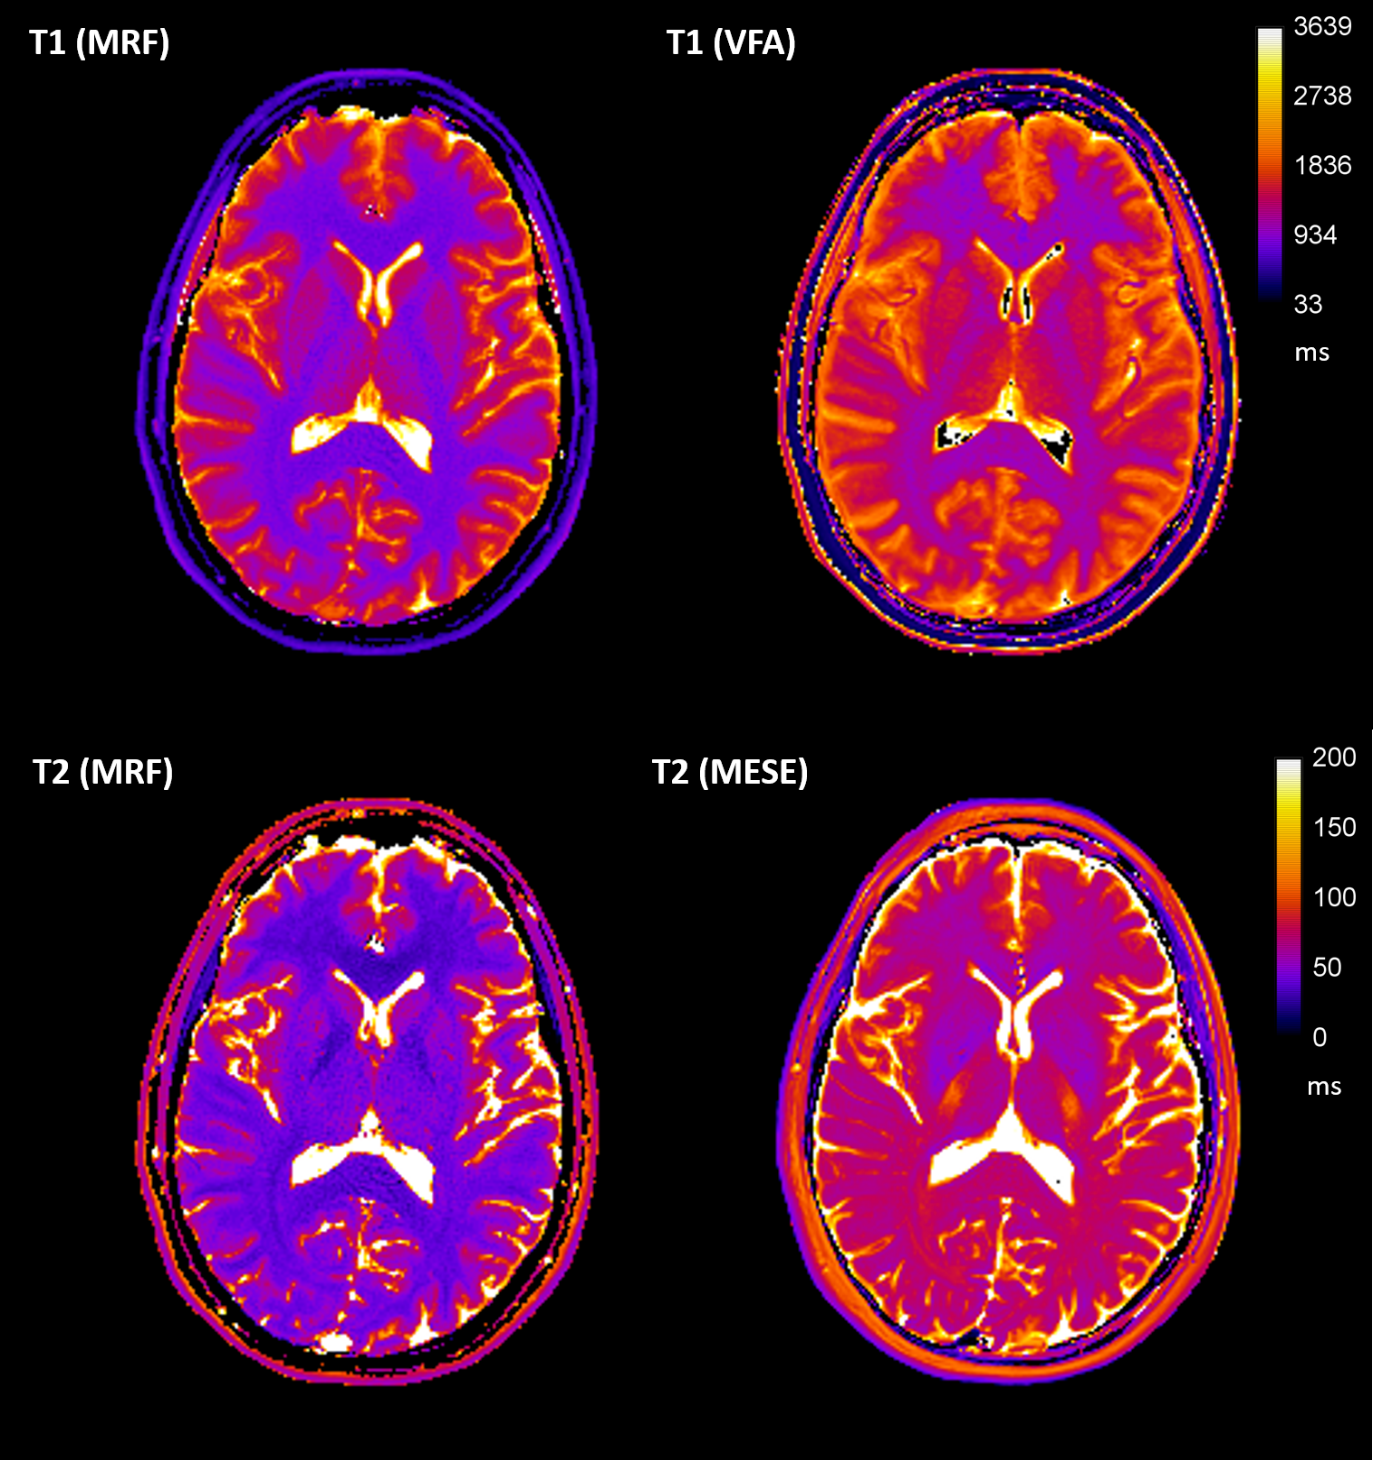
10 healthy volunteers (7 female, 3 male, 27-35 years, mean 30.3 years) underwent MRI on a 3T MAGNETOM Prisma (Siemens Healthcare, Germany). The protocol included: 3D MPRAGE (1x1x1 mm3), 2D multi-echo spin echo (MESE: TR 3520 ms, TE: 24, 48, 72, 96, 120, 144 and 168 ms, 1x1x5 mm3 voxels), six 3D VIBE with variable flip angles (VFA: TR 10 ms, TE 1.43 ms, FA: 2°, 8°,12°,15°, 20° and 26°, 1x1x5 mm3 voxels), two repeats of a 2D spiral FISP MRF prototype sequence with 1500 measurements and 1x1x5 mm3 voxels[1]. T1 and T2 maps were produced using MRF and the established methods (VFA[2] and MESE[3], respectively) (Figure 1).Brain extraction and segmentation was performed on the high resolution MRPAGE in FreeSurfer using the Desikan-Killiany brain atlas. MRF and MR relaxometry maps were registered to the segmented MPRAGE using FSL. T1 and T2 values in 12 of the brain regions were extracted, after eroding the brain regions mask using a threshold of 0.9, and analysed in MATLAB (R2018b, MathWorks). MRF data were compared to the established methods and the reproducibility of MRF assessed using Bland-Altman (BA) statistics.
Results
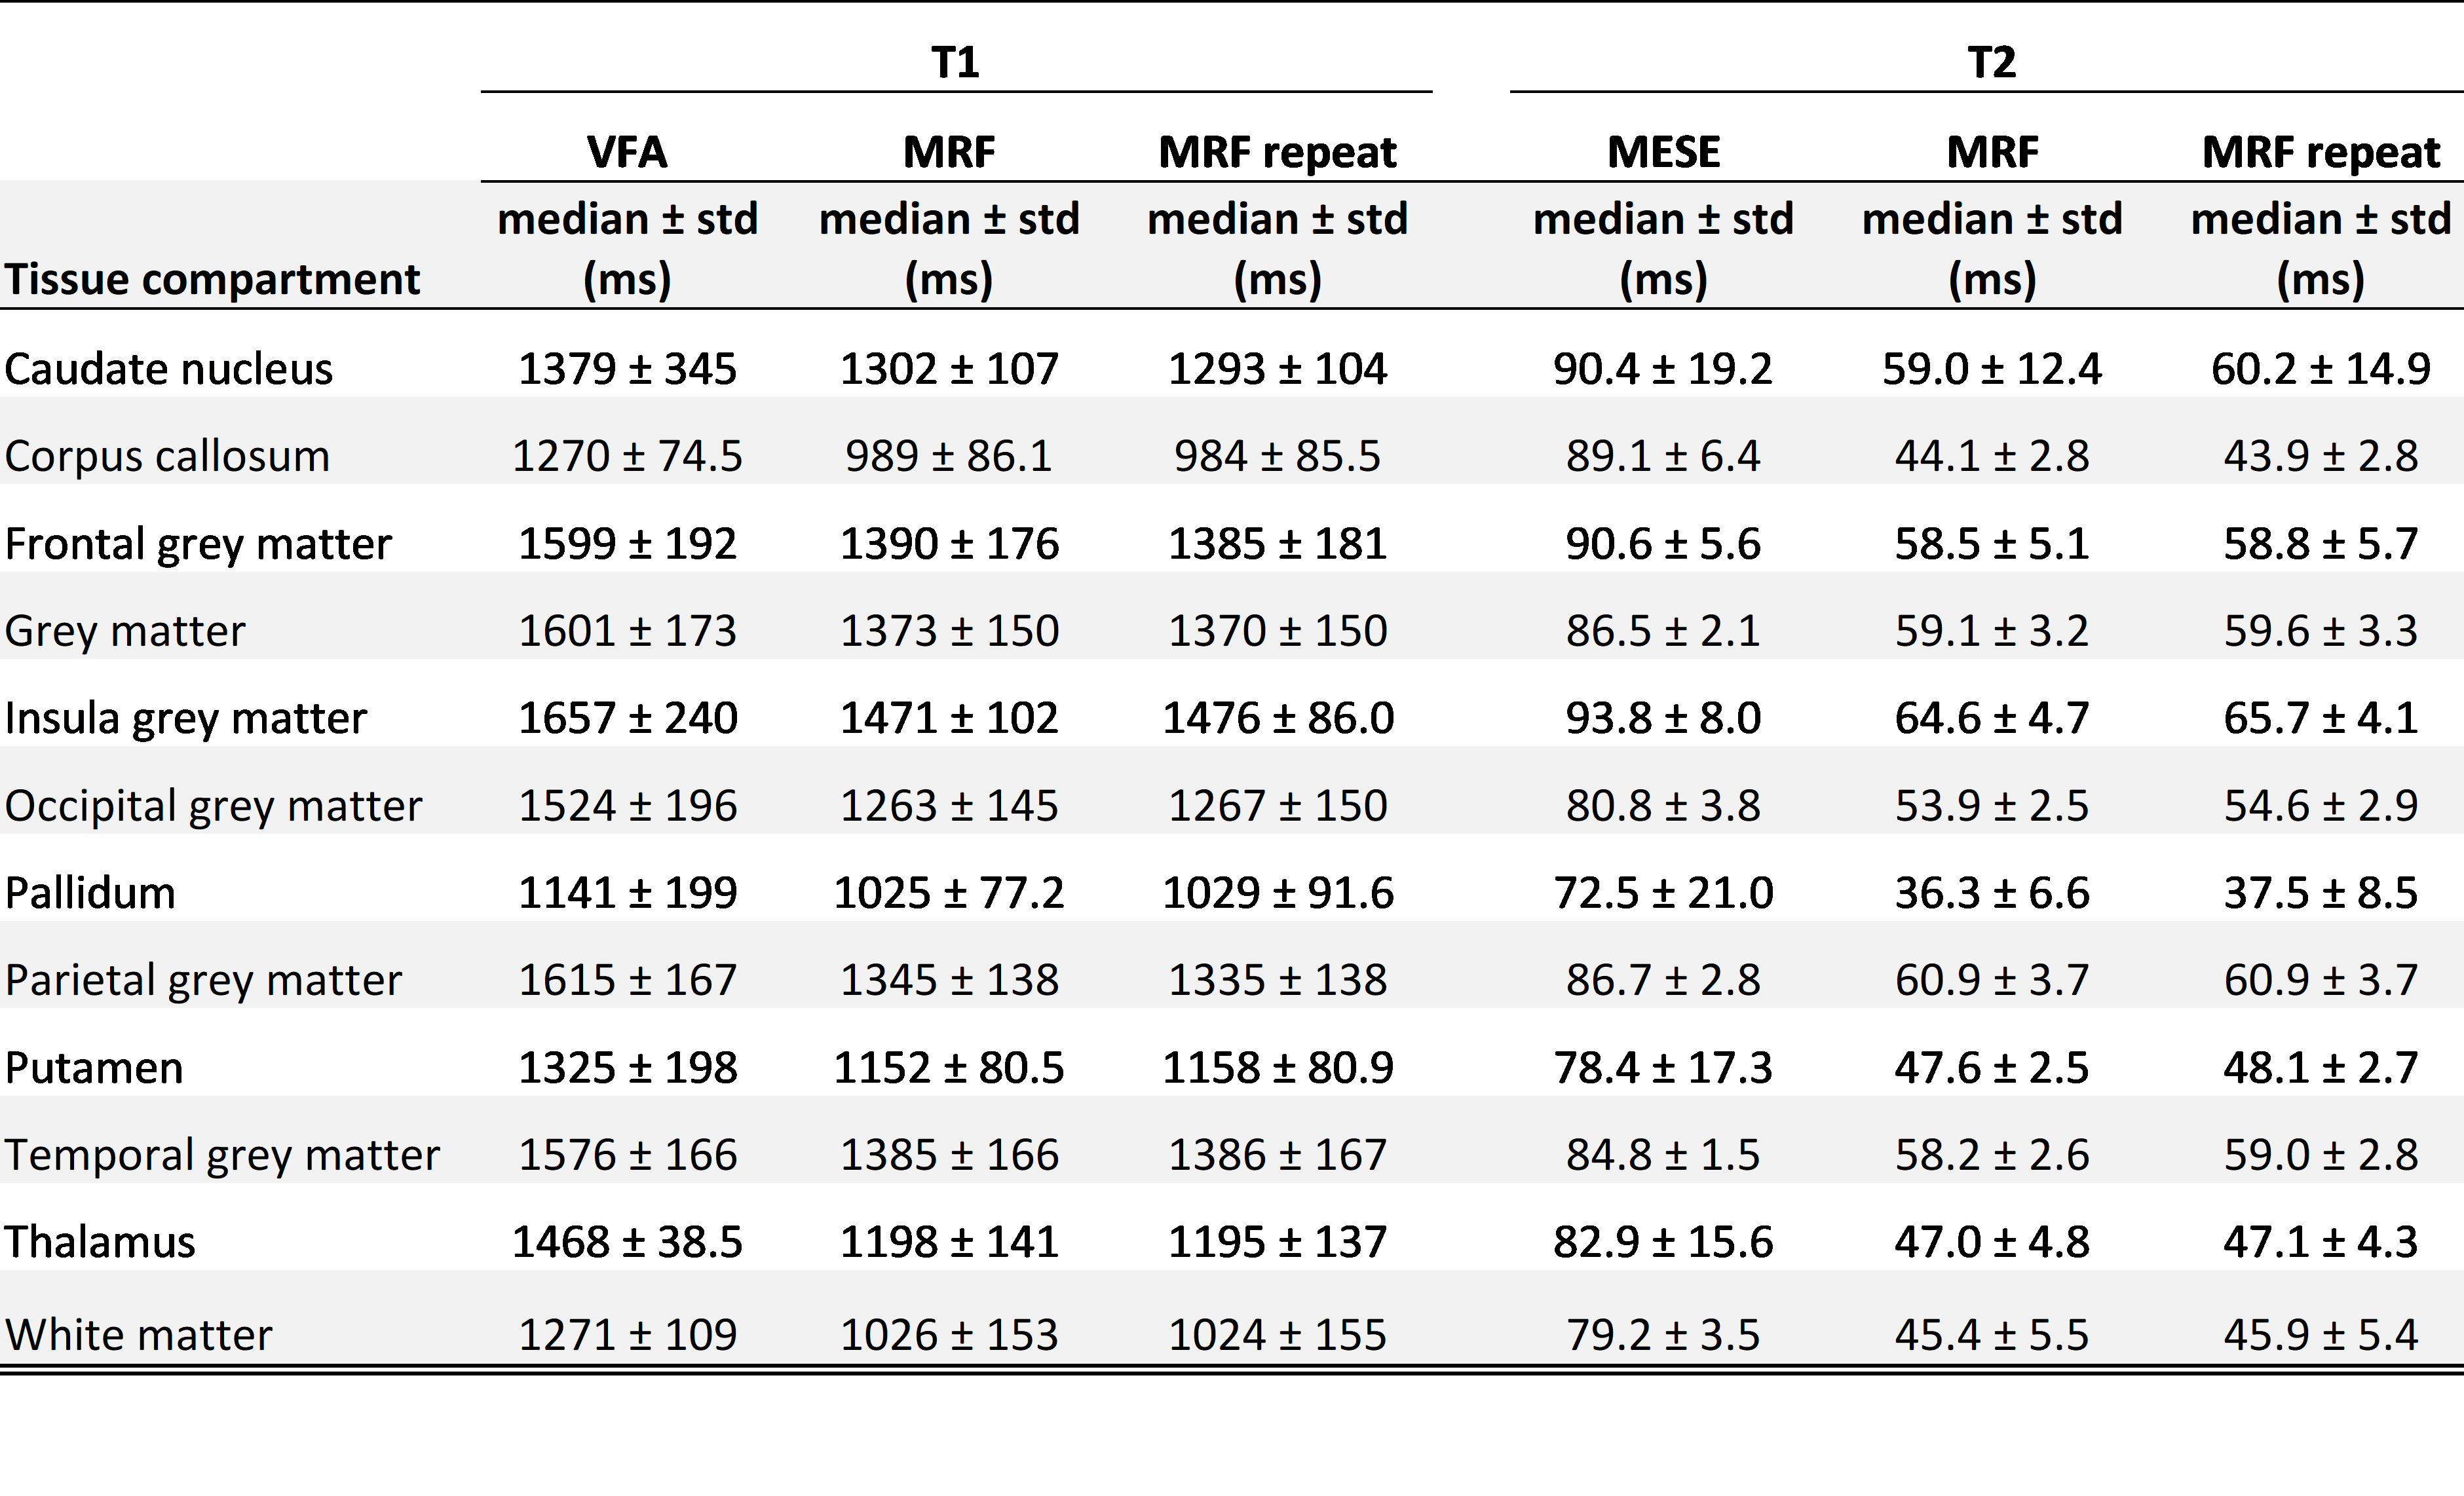
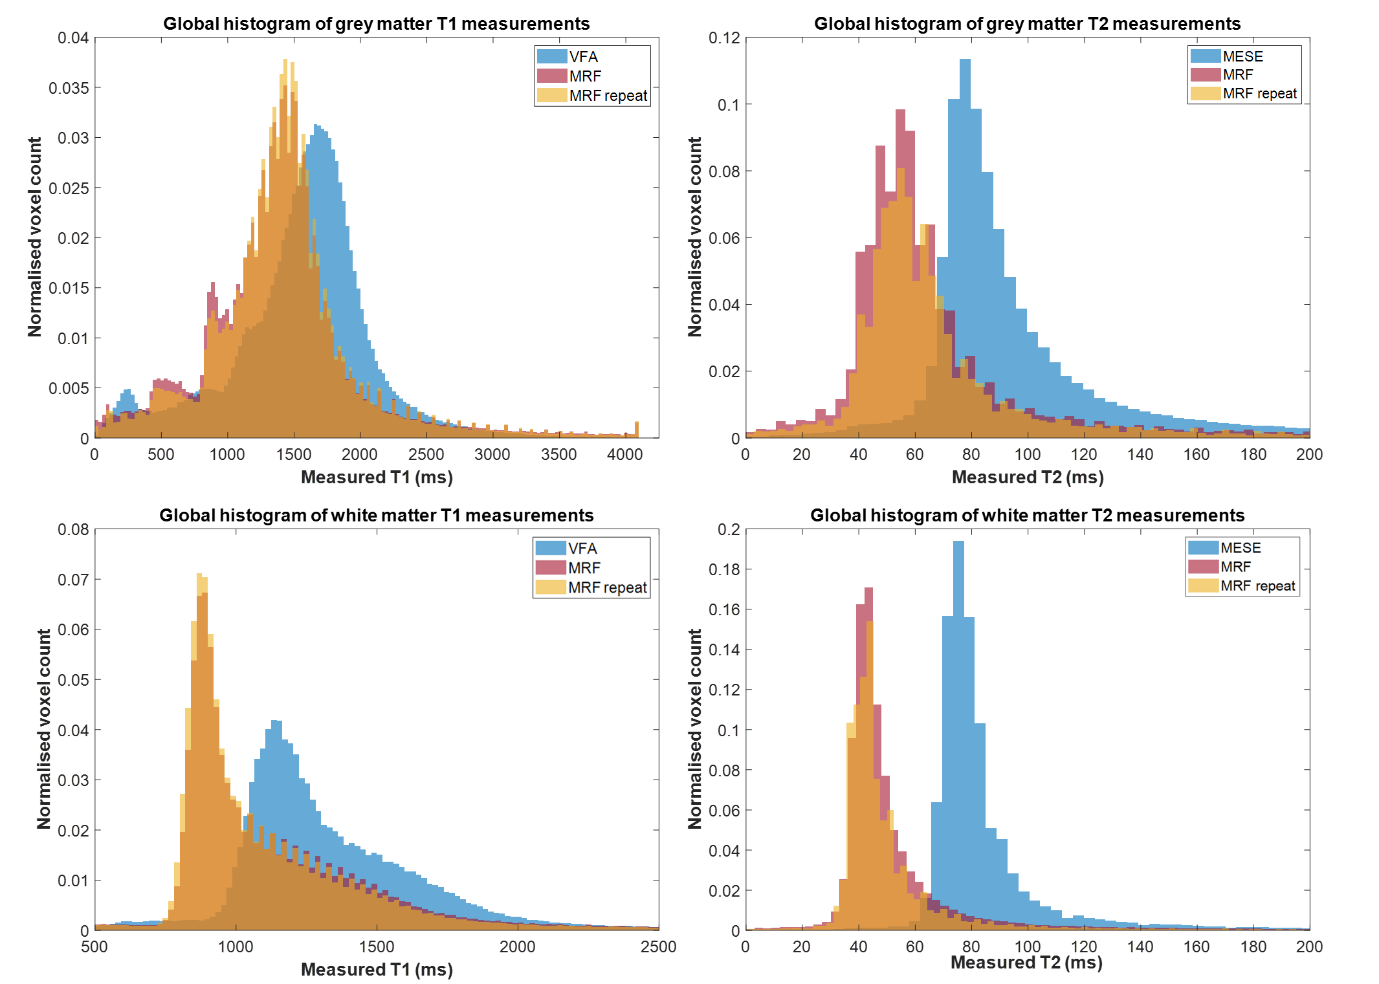
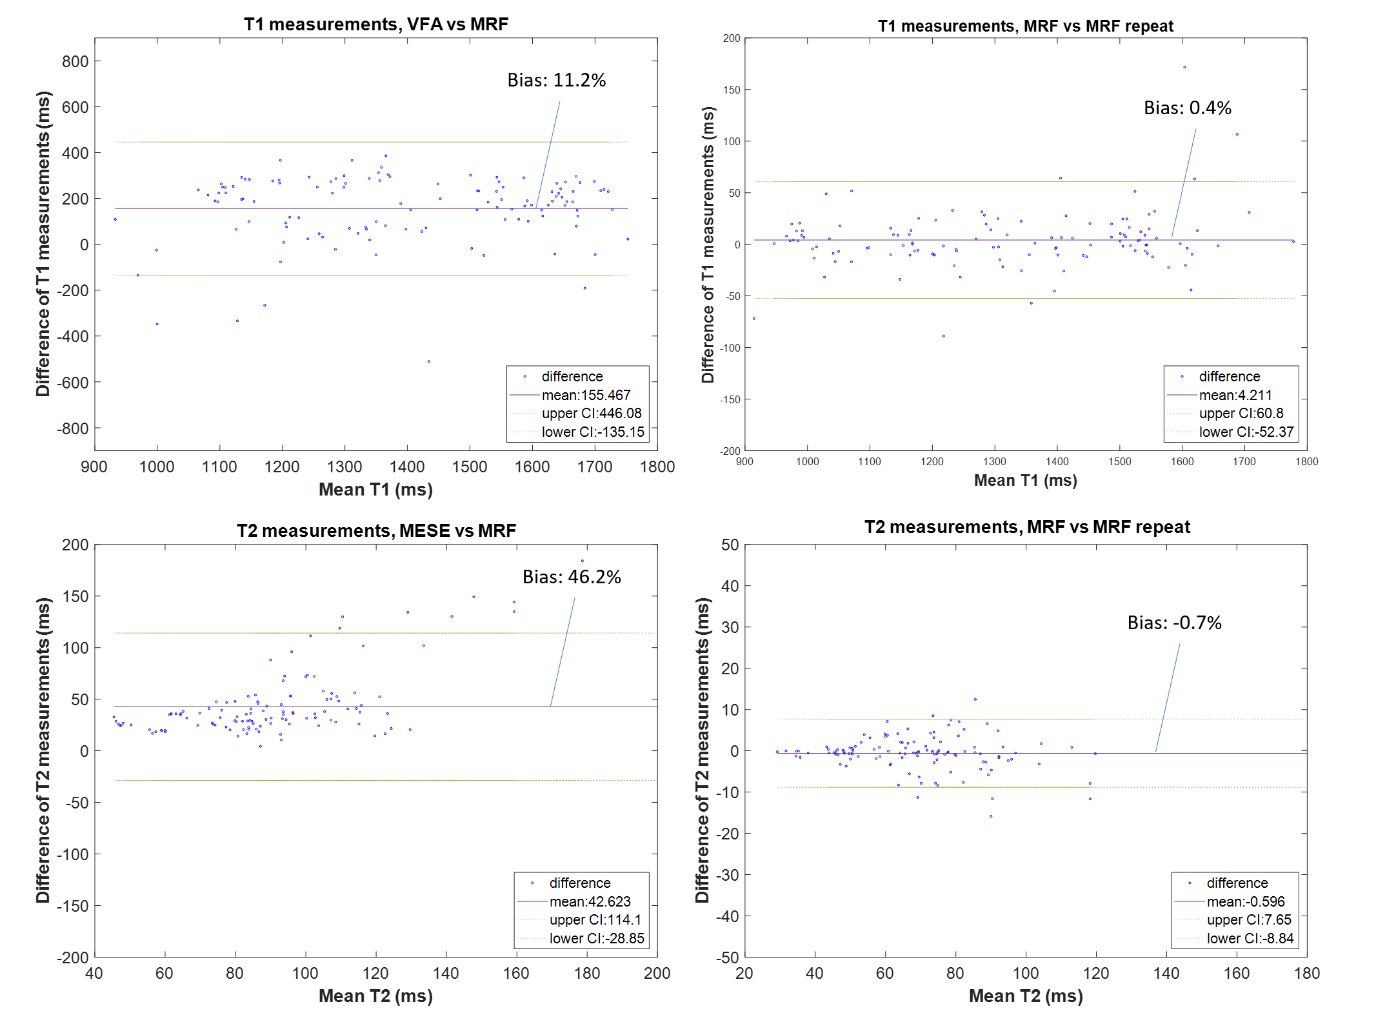
Descriptive statistics of the measured relaxation times in the 12 brain regions are shown in Table 1. In all 12 brain regions there was a statistically significant difference between results from MRF and the standard mapping procedures; VFA and MESE over-estimated the relaxation time in comparison to the MRF values (Table 1). Global grey and white matter histogram analysis shows high reproducibility of MRF and a bias compared to standard methods (Figure 2). BA analysis (Table 2, Figure 3) showed an overall bias of 156 ms for T1 values (VFA vs MRF) and 43 ms for T2 values (MESE vs MRF). BA and Wilcoxon signed rank testing between the two MRF repeats showed no statistically significant variation. Spearman’s Rho correlation testing showed a significant correlation between the standard mapping techniques and MRF as well as between MRF techniques (Table 2).Discussion
Median T1 and T2 values produced by the MRF protocol for the segmented tissue regions agreed well with those seen in the literature[2-7].Global BA comparison between VFA and MRF T1 values showed an overall bias of 11.2%, with VFA over-estimating the T1 value compared to MRF. This trend was seen in a separate phantom study, where a 9.4% bias was measured between the techniques in the range 782–1961 ms. The increased bias could be due to the heterogenous range of T1 values in vivo compared to a more homogeneous phantom, field inhomogeneities and partial volume effects. There was a strong statistically significant correlation between T1 values from VFA and MRF (Spearman’s Rho correlation coefficient, ρ=0.832; p<0.001) showing that MRF is comparably sensitive to changes in T1.
BA analysis of T2 results showed an overall bias of 46.2% between MESE and MRF values. In a separate phantom study MESE and MRF results showed strong agreement with a small bias of 1.4% for a T2 range of 31.0–94.4 ms. However, it is difficult to draw conclusions about the accuracy of MRF T2 measurements in the brain as compared to those using the MESE method, as results using both methods agreed with the wide range of values found in the literature[2-7]. In-vivo, the MESE technique showed a larger variance of T2 within tissue regions as compared to MRF. Some of this variation can be accounted for by the heterogeneity within brain regions, field inhomogeneities and partial volume effects. There was a moderate but statistically significant correlation between the MESE and MRF T2 measurements (Spearman’s Rho correlation coefficient, ρ=0.481; p<0.001) suggesting that MRF is sensitive to relative T2 differences similarly as to standard methods.
MRF T1 and T2 values were highly reproducible. The BA analysis for each tissue compartment gave biases of <1% for T1 and <3% for T2. Wilcoxon signed rank two-tailed testing between the repeats gave no significant difference for all compartments. This result agreed with a separate phantom study.
Conclusion
MRF was shown to be highly reproducible and correlated with standard quantitative mapping techniques in brain regions. It offers a clinically feasible method to quantify relaxation times in vivo with a single 7-minute acquisition and further work on its clinical use within brain tumours is currently being investigated.Acknowledgements
The authors would like to thank the volunteers who participated in the study; Funding from the Imperial CRUK Centre and the Imperial NHS Imaging Department, the Imperial NHS ImRes Group, the Imperial MRI Physics Collective, Iulius Dragonu and Mathias Nittka, Siemens Healthineers, UK and Germany.References
1. Jiang Y, et al. MRI Fingerprinting Using Fast Imaging with Steady State Precision (FISP) with Spiral Readout. Magn Reson Med. 2015; 74:1621-1631.
2. Liberman G, et al. T1 mapping Using Variable Flip Angle SPGR Data with Flip Angle Correction. Magn Reson Imaging 2014; 40:171-180.
3. Pei M, et al. An Algorithm for Fast Mono-exponential Fitting Based on Auto-Regression on Linear Operations (ARLO) of Data. J Magn Reson Med. 2015; 73(2):843-850.
4. Wansapura J.P, et al.NMR Relaxation Times in the Human Brain at 3.0 Tesla. Magn Reson Imaging. 1999; 9:531-538.
5. Stanisz G.J, et al. T1, T2 Relaxation and Magnetization Transfer in Tissue at 3T. Magn Reson Med. 2005; 54:507-512.
6. Ethofer T, et al. Comparison of longitudinal metabolite relaxation times in different regions of the human brain at 1.5 and 3 Tesla. Magn Reson Med. 2003; 50(6):1296-301.
7. Gelman G.N, et al. MR imaging of human brain at 3.0 T: Preliminary report on transverse relaxation rates and relation to estimated iron content. Radiology. 1999; 210(3):759-767.
Figures