3756
Quantitative Tracking of T1 and T2* in DCE-MRI by Dynamic MR Fingerprinting1Institute of Science and Technology for Brain-inspired Intelligence, Fudan University, Shanghai, China, 2MR Collaboration, Siemens Healthcare Ltd., Shanghai, China, 3Human Phenome Institute, Fudan University, Shanghai, China
Synopsis
Precise quantification of the contrast agent uptake in DCE-MRI is still challenging. Here, we redesigned the reconstruction scheme of MR fingerprinting by introducing a sliding window into the process of dictionary matching, which allows dynamic quantification of T1 and T2* in DCE-MRI with high temporal resolution. The performance of this proposed dynamic MRF method is simulated and tested on MATLAB. The time-varying trajectories of T1 and T2* have been successfully captured with a temporal resolution of 4.5 seconds. This method may open the door of utilizing MR fingerprinting to quantify time-varying variable with adjustable temporal resolution.
Introduction
Magnetic resonance fingerprinting (MRF)1 is a novel quantitative imaging approach that allows simultaneous measurements of multiple tissue properties during a single scan. It has been applied to DCE-MRI studies for dynamic T1 and T2* mapping with a two-minute temporal resolution2. Although quantitative T1 and T2* can be addressed at the same time, the temporal resolution is still not enough for human DCE-MRI.The existing idea of DCE-MRF2 is doing MRF sequence repeatedly to achieve dynamic tracking and the temporal resolution is restricted by the acquisition time of a single MRF sequence. Here, we redesigned the reconstruction scheme by introducing a sliding window into the dictionary matching process of MRF, in which the time-varying T1 and T2* can be calculated dynamically within a single MRF acquisition. And by doing this, high temporal resolution can be achieved without much changes in MR sequence, because the temporal resolution will merely depend on the step length of the sliding window.
Theory
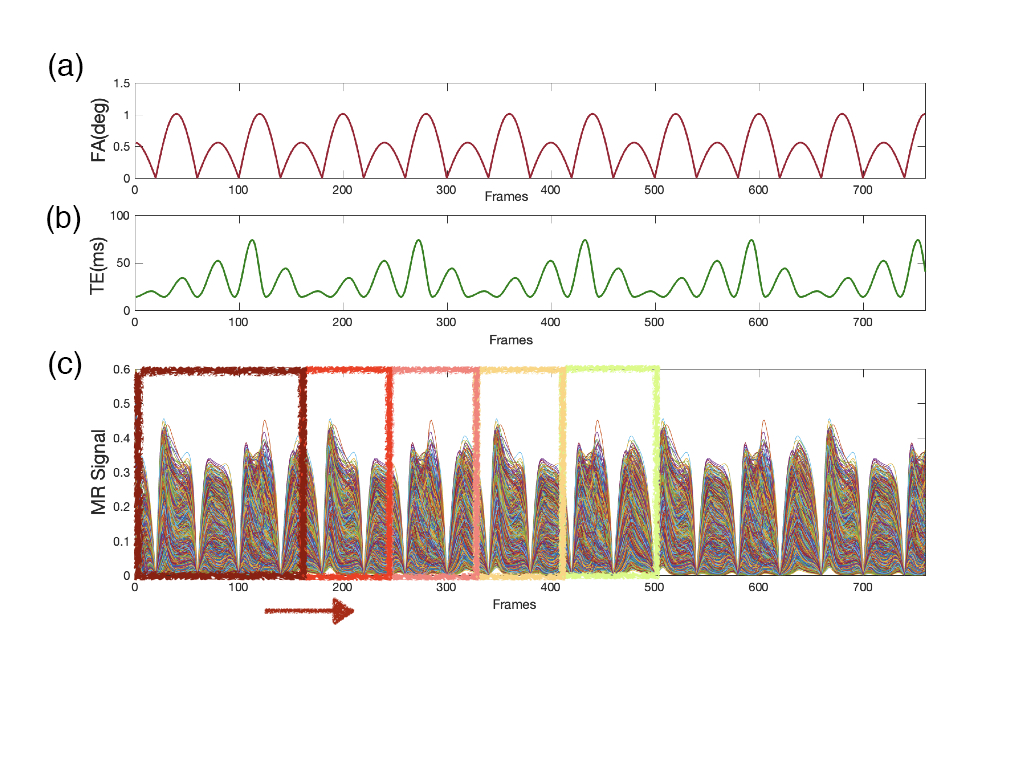
Inspired by the application of the sliding window in MR data acquisition3, in which the K-space data can be shared between time-consecutive images, we found that the data frames used for the dictionary matching of MRF can also be shared.As a proof-of-principle implementation, we adopted an EPI-based MRF sequence with varying FAs and TEs4. The data frames are composed of a series of GE-EPI images. The design for dynamic reconstruction is illustrated in Figure 1(c). The data frames used for dictionary matching will be selected by a sliding window. This window will start at the beginning of our acquired data frames, then gradually slides with a step length.
For each window position, T1 and T2* values at the center of the window will be reconstructed through dictionary matching, a matching between the data frames selected by this window and a calculated dictionary. Then the obtained T1 and T2* values will be used to calculate the initial magnetization as well as the corresponding dictionary of the next window.
Methods
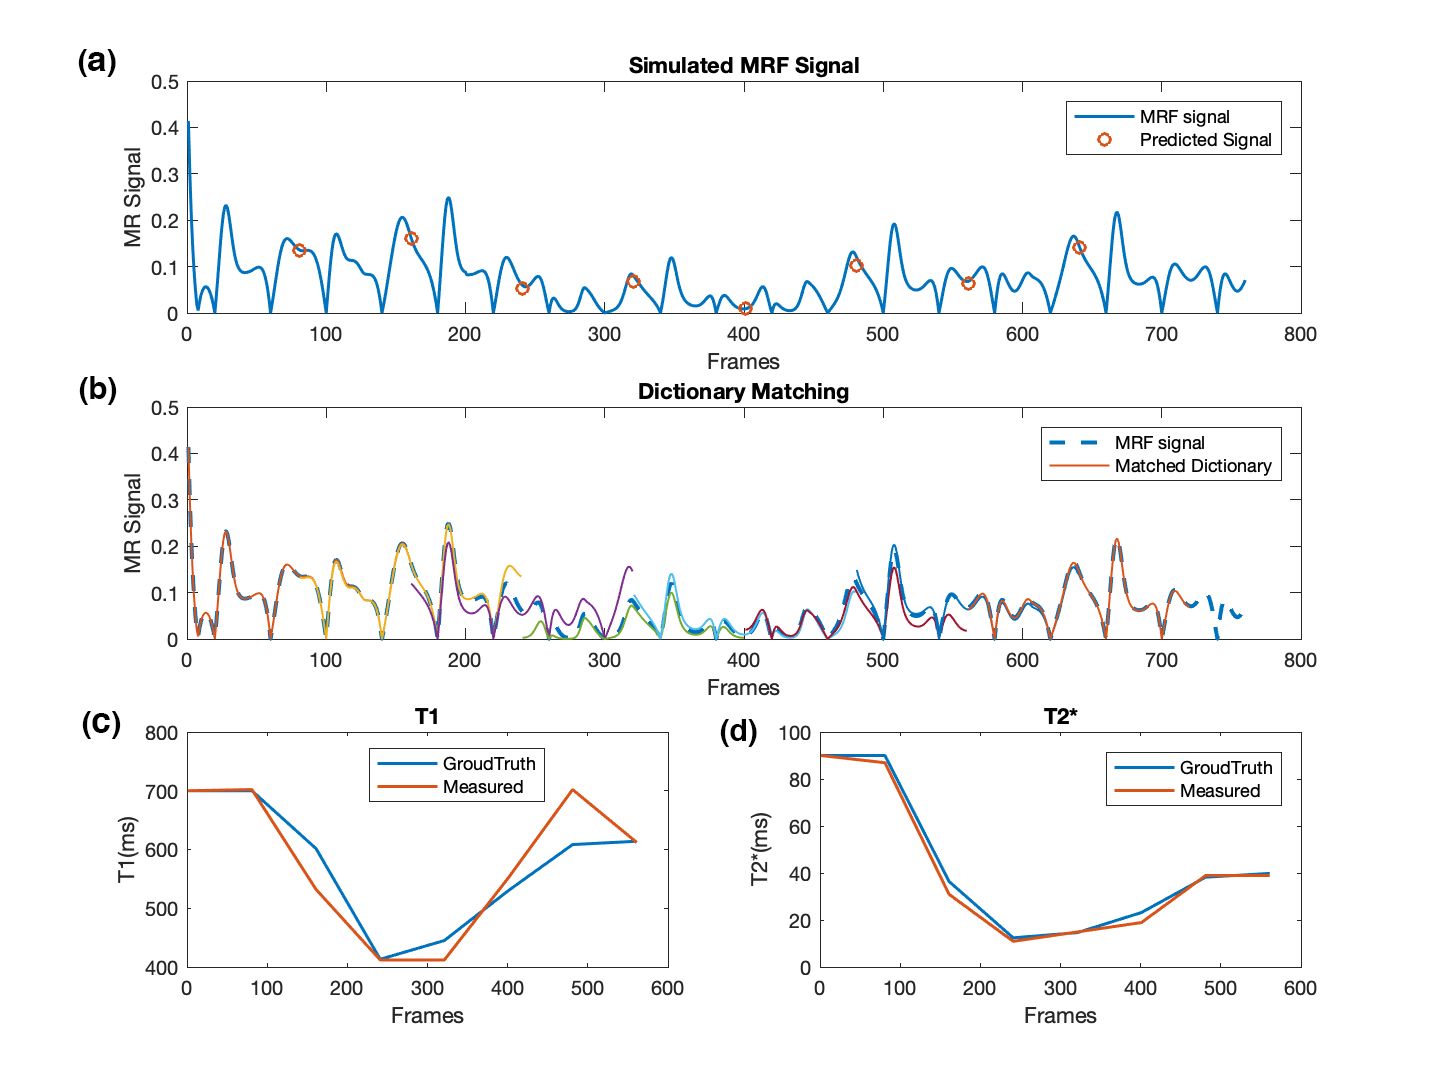
Our MRF sequence has 760 frames in total, covering 41.59 seconds. The FAs and TEs patterns are shown in Figure 1(a-b). Minimal TR was chosen for any given TE. The width and step length of the sliding window are 160 and 80 frames, separately.The MR signal of the DCE experiment was simulated as follows. First, the time-varying T1 and T2* curves were calculated based on the empirical concentration of contrast agents during DCE-MRI in human brain5. The blue lines in Figure 2 (c-d) shows the simulated T1 and T2* curves. Then, we simulated the measured MR signal under the specific FA and TE patterns above using the Bloch equation. At last, the time-varying T1 and T2* were reconstructed by our proposed reconstruction scheme without any prior knowledge including the characteristics of the bolus, the initial T1 or T2* value, etc.
Results
The simulated MR signal under the time-varying T1 and T2* is exhibited as the blue line in Figure 2(a). The red circles represent the predicted magnetization of each window calculated during the dynamic reconstruction process, which shows a high agreement of the blue line. The goodness of dictionary matching is illustrated in Figure 2(b), where the dashed blue line represents the acquired MR signal, and the best matching curve from dictionary matching are superposed. The final reconstructed T1 and T2* curves are shown in Figure 2(c-d). The trend of the time-varying relaxation time has been successfully captured especially for T2*.Discussion
The results in Figure 2 showed that it is possible to track time-varying variables through this sliding window aided dictionary matching scheme. The temporal resolution is only determined by the step length of the sliding window. In the present demonstration, the temporal resolution is 4.5 seconds approximately, based on our choice of 80-frame step length. There is no limit to the choice of step length, which means in principle, the temporal resolutions of our propose method can reach as high as we want.Inconsistence in dictionary matching was found around frame #200~300 in Figure 2(b), which may be addressed by further adjusting the width and step length of the sliding window. This choice of window parameters should be optimized together with the MRF sequence design, because the matching process will be influenced by the coherence between them. Also, a sliding window with different weights over frames could be used for further studies. Besides, the transmit magnetic field B1 can also be included in the dictionary calculation and be retrieved along with T1 and T2*. Last but not least, experimental data will be added in our future results, to fully evaluate the performance of this dynamic reconstruction scheme.
Conclusion
Our proposed dynamic reconstruction scheme of MRF has shown promising simulation results of capturing the time-varying T1 and T2* curve without any prior knowledge. This may open the door of dynamic MRF, which can be used to quantify the contrast agent uptake with high temporal resolution.Acknowledgements
This work was supported by Shanghai Municipal Science and Technology Major Project (No.2017SHZDZX01), Shanghai Municipal Science and Technology Major Project (No.2018SHZDZX01) and ZJLab, Shanghai Natural Science Foundation (No. 17ZR1401600) and the National Natural Science Foundation of China (No. 81971583).References
1. Ma D, Gulani V, Seiberlich N, et al. Magnetic resonance fingerprinting. Nature. 2013;495(7440):187-92.
2. Gu Y, Wang CY, Anderson CE, et al. Fast magnetic resonance fingerprinting for dynamic contrast-enhanced studies in mice. Magn Reson Med. 2018;80(6):2681-2690.
3. Cao X, Liao C, Wang Z, et al. Robust sliding-window reconstruction for accelerating the acquisition of MR fingerprinting. Magn Reson Med. 2016;78(4):1579-1588.
4. Rieger B, Zimmer F, Zapp J, et al. Magnetic resonance fingerprinting using echo-planar imaging: Joint quantification of T1 and T2∗ relaxation times. Magn Reson Med. 2017;78(5):1724-1733.
5. Lind E, Knutsson L, Kämpe R, et al. Assessment of MRI contrast agent concentration by quantitative susceptibility mapping (QSM): application to estimation of cerebral blood volume during steady state. MAGMA. 2017;30(6):555–566.
Figures