3753
Validation of a water and fat separation framework for Liver MR Fingerprinting1Biomedical Imaging Center, Pontificia Universidad Catolica de Chile, Santiago, Chile, 2Millennium Nucleus for Cardiovascular Magnetic Resonance, Santiago, Chile, 3School of Biomedical Engineering and Imaging Sciences, King’s College London, London, United Kingdom, 4Radiology Department, School of Medicine, Pontificia Universidad Catolica de Chile, Santiago, Chile, 5Instituto de Ingeniería Matemática y Computacional, Pontificia Universidad Catolica de Chile, Santiago, Chile, 6Millennium Nucleus Center for the Discovery of Structures in Complex Data, Santiago, Chile
Synopsis
In this work we validated a liver MR Fingerprinting technique which allows to simultaneously estimate T1, T2, Proton Density Fat Fraction (PDFF) and T2*. This technique is based on a novel water and fat separation optimisation scheme, which includes l2-norm of the fieldmap gradient, TV regularisation on T2* and l1-norm denoising of the water and fat concentrations. We presented results on T1/T2 and water/fat phantoms and in 11 volunteers. This approach showed to be robust and it is ready to be applied on more clinical challenging cases.
Introduction
MR Fingerprinting allows the simultaneous acquisition of quantitative maps, such T1 and T21 maps. This is achieved by varying the sequence parameters during the acquisition, codifying the tissue properties. To recover the quantitative maps the signal at each pixel is matched to a pre-computed dictionary; from the matched signal the tissue properties can be determined. Despite the success of this approach in several applications, clinical settings present unique challenges. For instance, medical conditions such as obesity produce a degradation of the signal for liver imaging (Fig. 1).In this work we present the validation of a liver MRF approach to calculate T1, T2, Proton Density Fat Fraction (PDFF) and T2* in single acquisition.
This framework is based on a water and fat separation framework which can robustly deal with condition of low SNR.
Methods
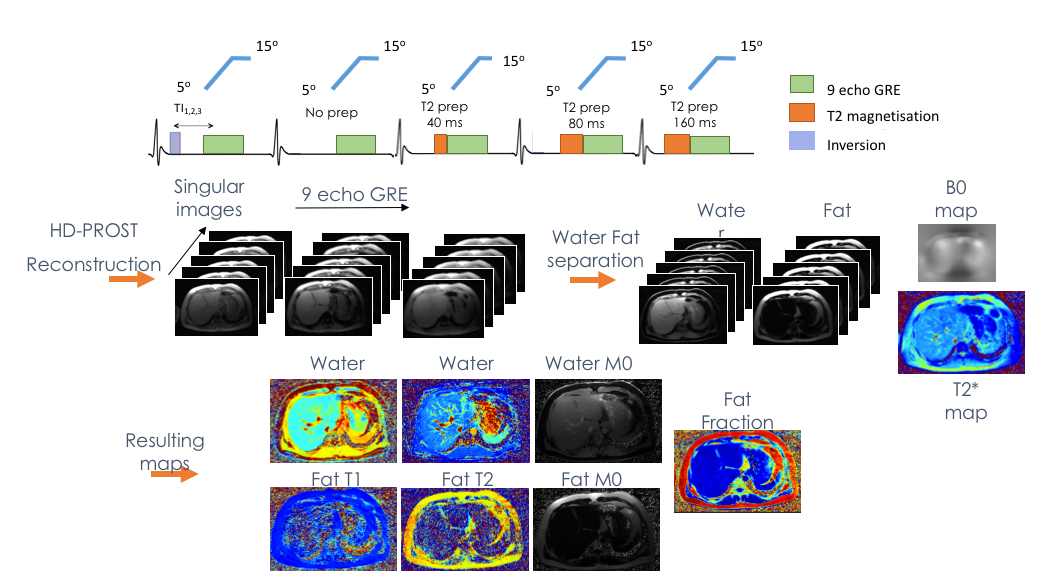
The MRF sequence consists on a golden angle radial nine echo gradient echo (GRE) sequence with variable flip angle (5º to 15º), three inversion recovery pulses and four T2 preparation pulses2,3 (Fig. 2). This signal is reconstructed using HD-PROST4 algorithm with SVD dictionary temporal compression (6 singular images). The water and fat separation is then applied to the first singular image, and with the estimated fieldmap (B0) and T2* are used to correct and separate water from fat over the other five singular images.We proposed a Gauss Newton Trust Region5 optimization scheme combined with l2 norm of the gradient of B0, TV regularization on R2* and an l1-norm denoising on the water and fat concentrations.
To estimate the parameters of interest, we use the Gauss Newton Trust Region method proposed by Sing-Log et al5. This method allows us to regularize the gradient of B0 with the l2-norm squared, regularize R2* with TV, and regularize the water and fat concentrations with the l1-norm.
Water and Fat singular images are matched separately to the dictionary, obtaining T1, T2 of the water and the final PDFF is obtained from the M0 of water and fat.
We tested our algorithm in standard T1/T2 and water/fat 17 vials phantoms and in a group of 11 healthy volunteers. We compare our results with a 12 echoes IDEAL6 sequence for PDFF and T2* and T1 IRSE and T2 MESE on phantoms, and T1 MOLLI, T2 GRASE on volunteers.
Results
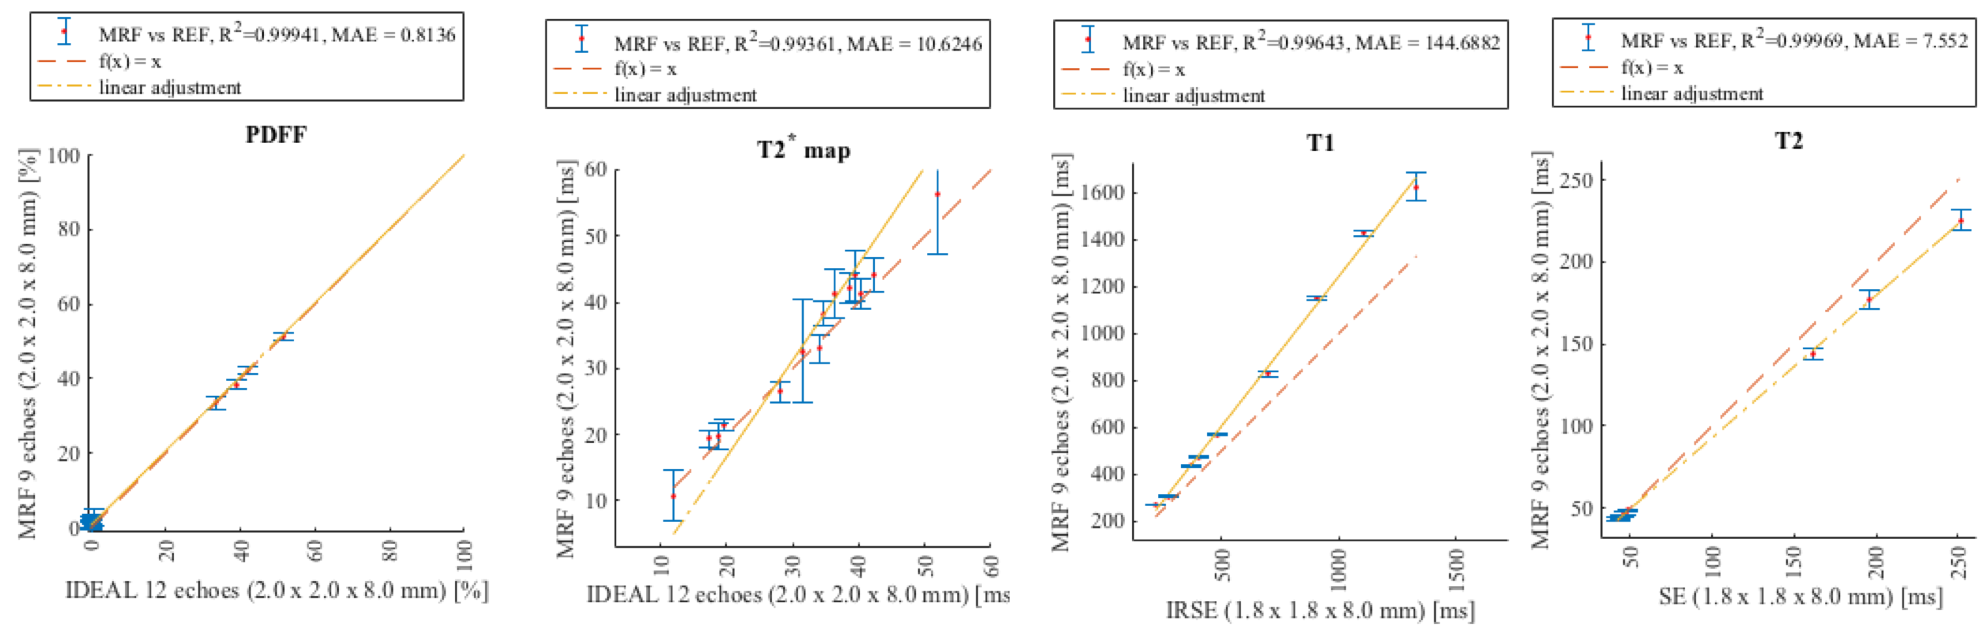
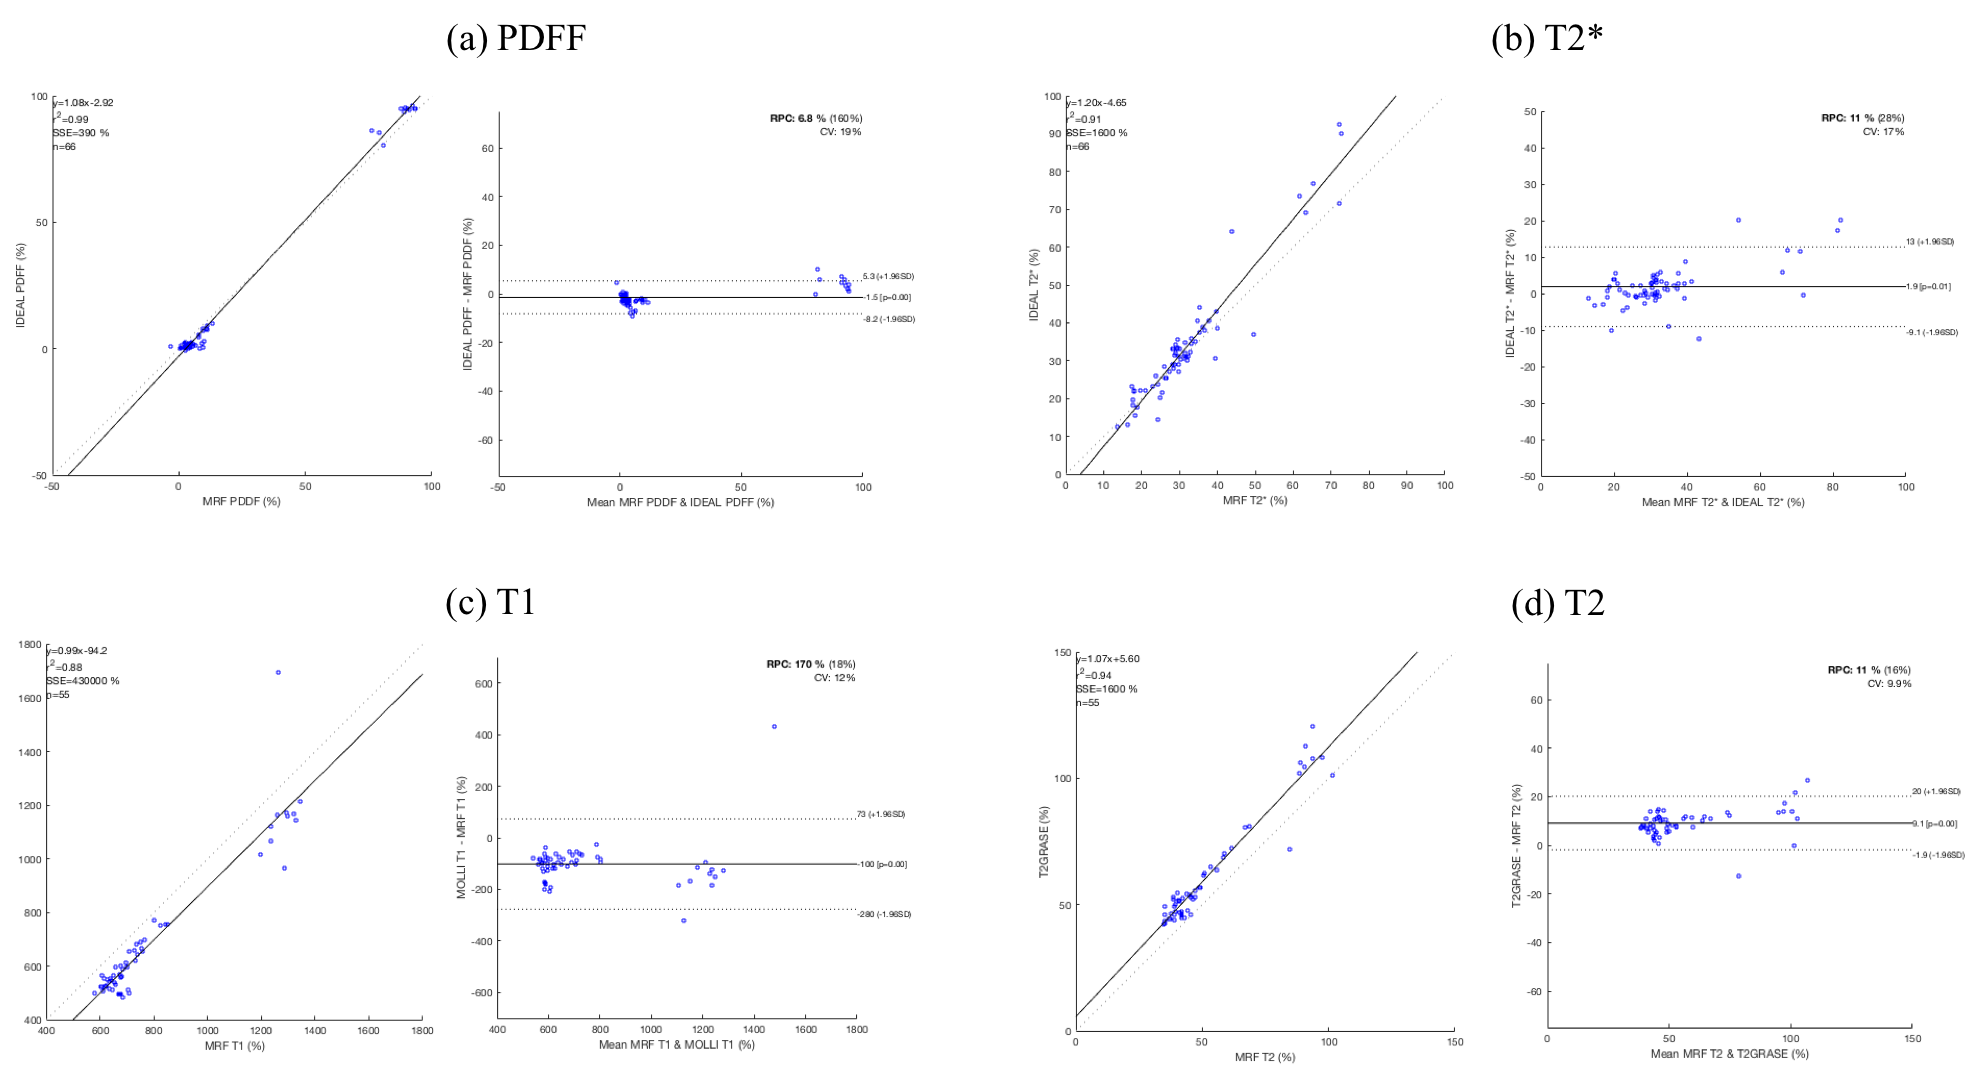
Phantoms were evaluated using one ROI per vial. These results showed a high correlation coefficient between standard measurements and our the MRF method (r2 0.99 for all the maps), and a good linear relation for all maps, with a mean absolute error of 0.81% of fat for PDFF, 10.62 ms for T2*, 144.69 ms for T1 and 7.5 ms for T2 (Fig. 3). Volunteers were evaluated using 6 ROIs, 4 in the liver, 1 in the subcutaneous fat and 1 in the spleen. These results showed good correlation coefficient and Bland Altman plot showed good interval of agreement and low bias (Fig. 4).Conclusion
We proposed and validated a liver MRF framework based on a robust water and separation method, using phantoms and 11 healthy volunteers. This is the first step for applying this methodology on challenging clinical settings, particularly in obesity studies using MRF.Acknowledgements
This work was supported by EPSRC (EP/L015226/1, EP/P001009/1, EP/P032311/1) and Wellcome EPSRC Centre for Medical Engineering (NS/ A000049/1) and received funding from Millennium Science Initiative of the Ministry of Economy, Development and Tourism, Government of Chile, grant Nucleus for Cardiovascular Magnetic Resonance and grant Millennium Nucleus Center for Discovery of Structures in Complex Data. CSL was partially funded by Fondecyt #11160728. CA was partially funded by Fondecyt Postdoctorado 2019 #3190763. CSL and CA were funded by CONICYT PCI-REDES180090.References
1. Ma, D. et al. Magnetic resonance fingerprinting. Nature 495, 187–92 (2013).
2. Hamilton, J. I. et al. Investigating and reducing the effects of confounding factors for robust T1 and T2 mapping with cardiac MR fingerprinting. Magnetic Resonance Imaging 53, 40–51 (2018).
3. Jaubert, O. et al. Water/Fat Dixon Cardiac Magnetic Resonance Fingerprinting. Magnetic Resonance in Medicine Accepted/I, (2019).
4. Bustin, A. et al. High-Dimensionality Undersampled Patch-Based Reconstruction (HD-PROST) for Accelerated Multi-Contrast Magnetic Resonance Imaging. Magnetic Resonance in Medicine 81, 3705–3719 (2019).
5. Sing‐Long, C., et al. Water and fat separation using a Gauss-Newton Trust-Region based algorithm. ISMRM annual meeting, Abril 22-27th, Honolulú, USA (2017).
6. Hernando, D., Kellman, P., Haldar, J. P. & Liang, Z.-P. Robust water/fat separation in the presence of large field inhomogeneities using a graph cut algorithm. Magnetic Resonance in Medicine 63, 79–90 (2010).
Figures