3752
Renal magnetic resonance fingerprinting for simultaneous T1 and T2* quantification1Computer Assisted Clinical Medicine, Medical Faculty Mannheim, University Heidelberg, Mannheim, Germany, 2Magnetic Resonance Systems Lab, Department of Imaging Physics, Delft University of Technology, Delft, Netherlands
Synopsis
We implemented and validated a MRF sequence for simultaneous T1 and T2* quantification in the kidneys covering 4 slices within one breath-hold. Therefore, we used an echo-planar-imaging readout with fully sampled k-space and 35 measuremets for the matching process. We achieved promising results in phantom and in 8 healthy volunteers compared with conventional methods as MOLLI and GRE and with reference scans. Additionally, we performed smoothing on the baseline images to further improve the image qualitiy of the MRF parametric maps.
Introduction
Chronical kidney disease (CKD), as the most significant kidney disease, is induced by several pathologies as tissue inflammation, fibrosis and oedema. These processes tend to increase T1 [1]. Furthermore, changes in T2* are observed in CKD due to decreased tissue deoxyhaemoglobin level [2] and reduced oxygen supply stating the importance of quantitative kidney imaging.Magnetic resonance fingerprinting (MRF) is a promising method to quantify multiple tissue parameters in a short time period [3]. Multiple weighted images are generated by varying echo time TE, repetition time TR and flip angle α and the pseudo-randomized magnetization evolution is compared with a dictionary containing different tissue parameters. Compared to conventional MRF methods, MRF using echo planar imaging (EPI) to acquire a smaller number of baseline images with fully sampled k-space was proposed [4] which allows monitoring for patient specific artifacts and motion during the acquisition.
In this study we implemented a MRF-EPI sequence to simultaneously quantify T1 and T2*, covering four slices of the kidneys in a single breath-hold.
Methods
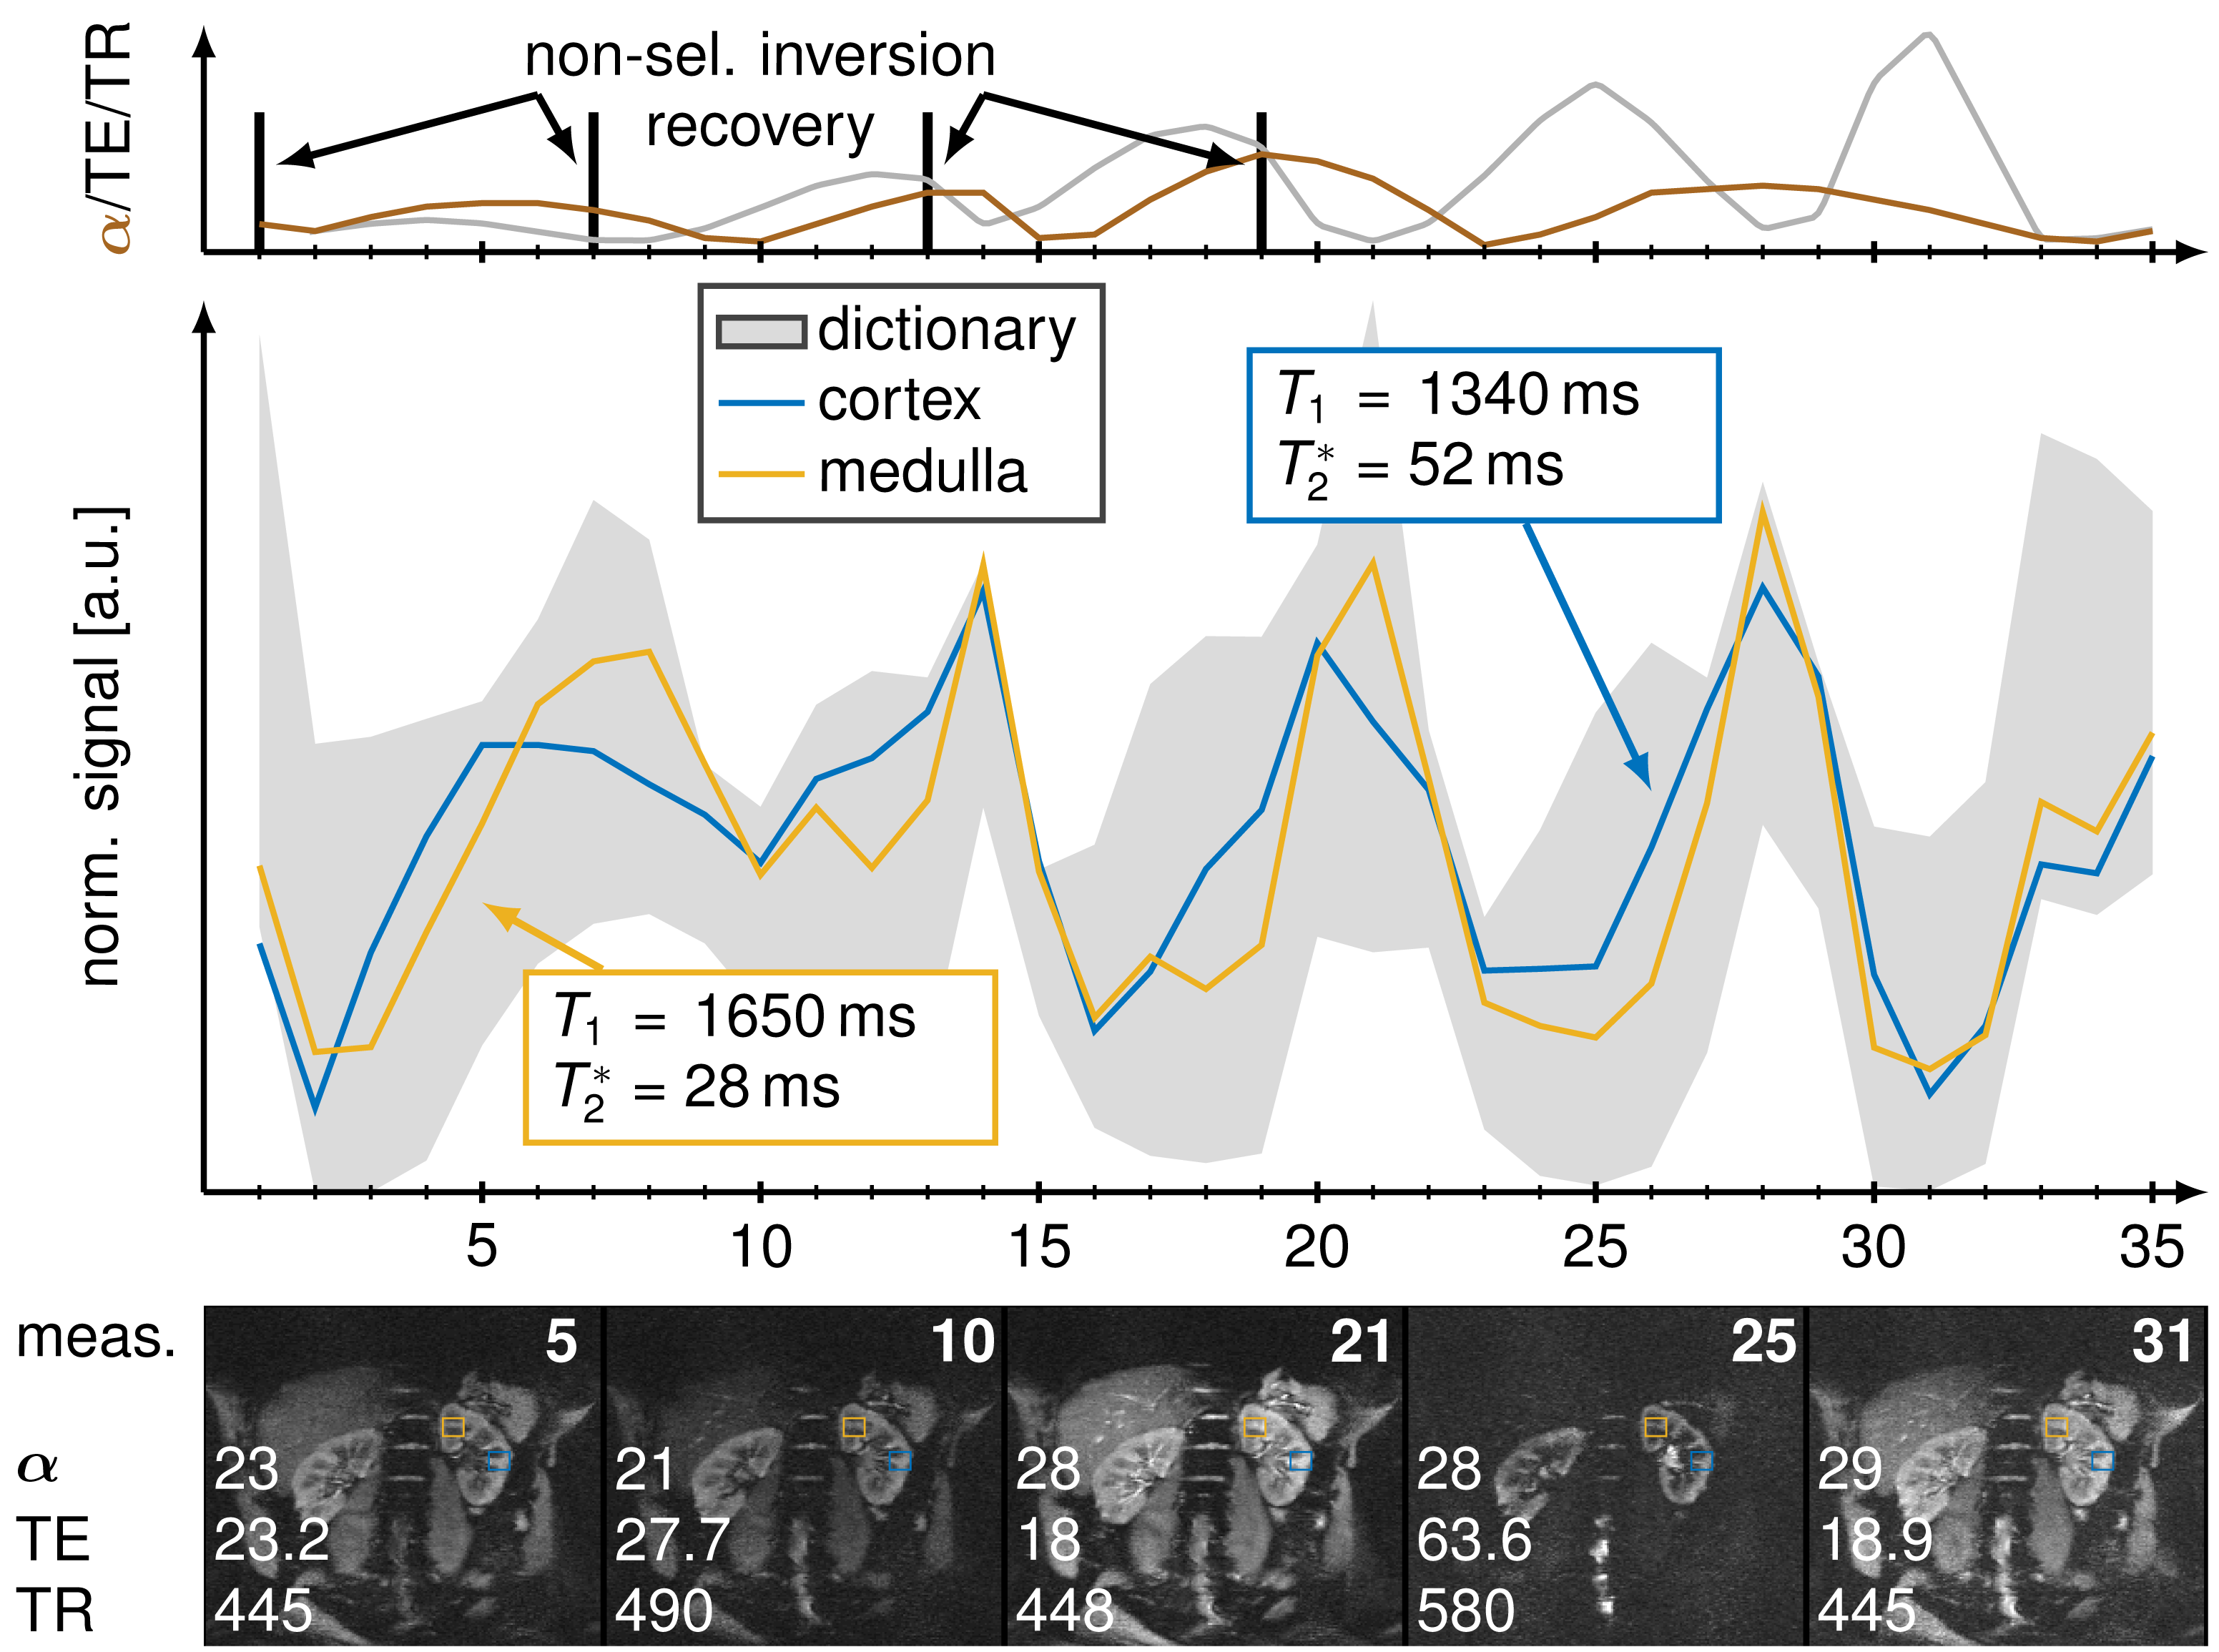
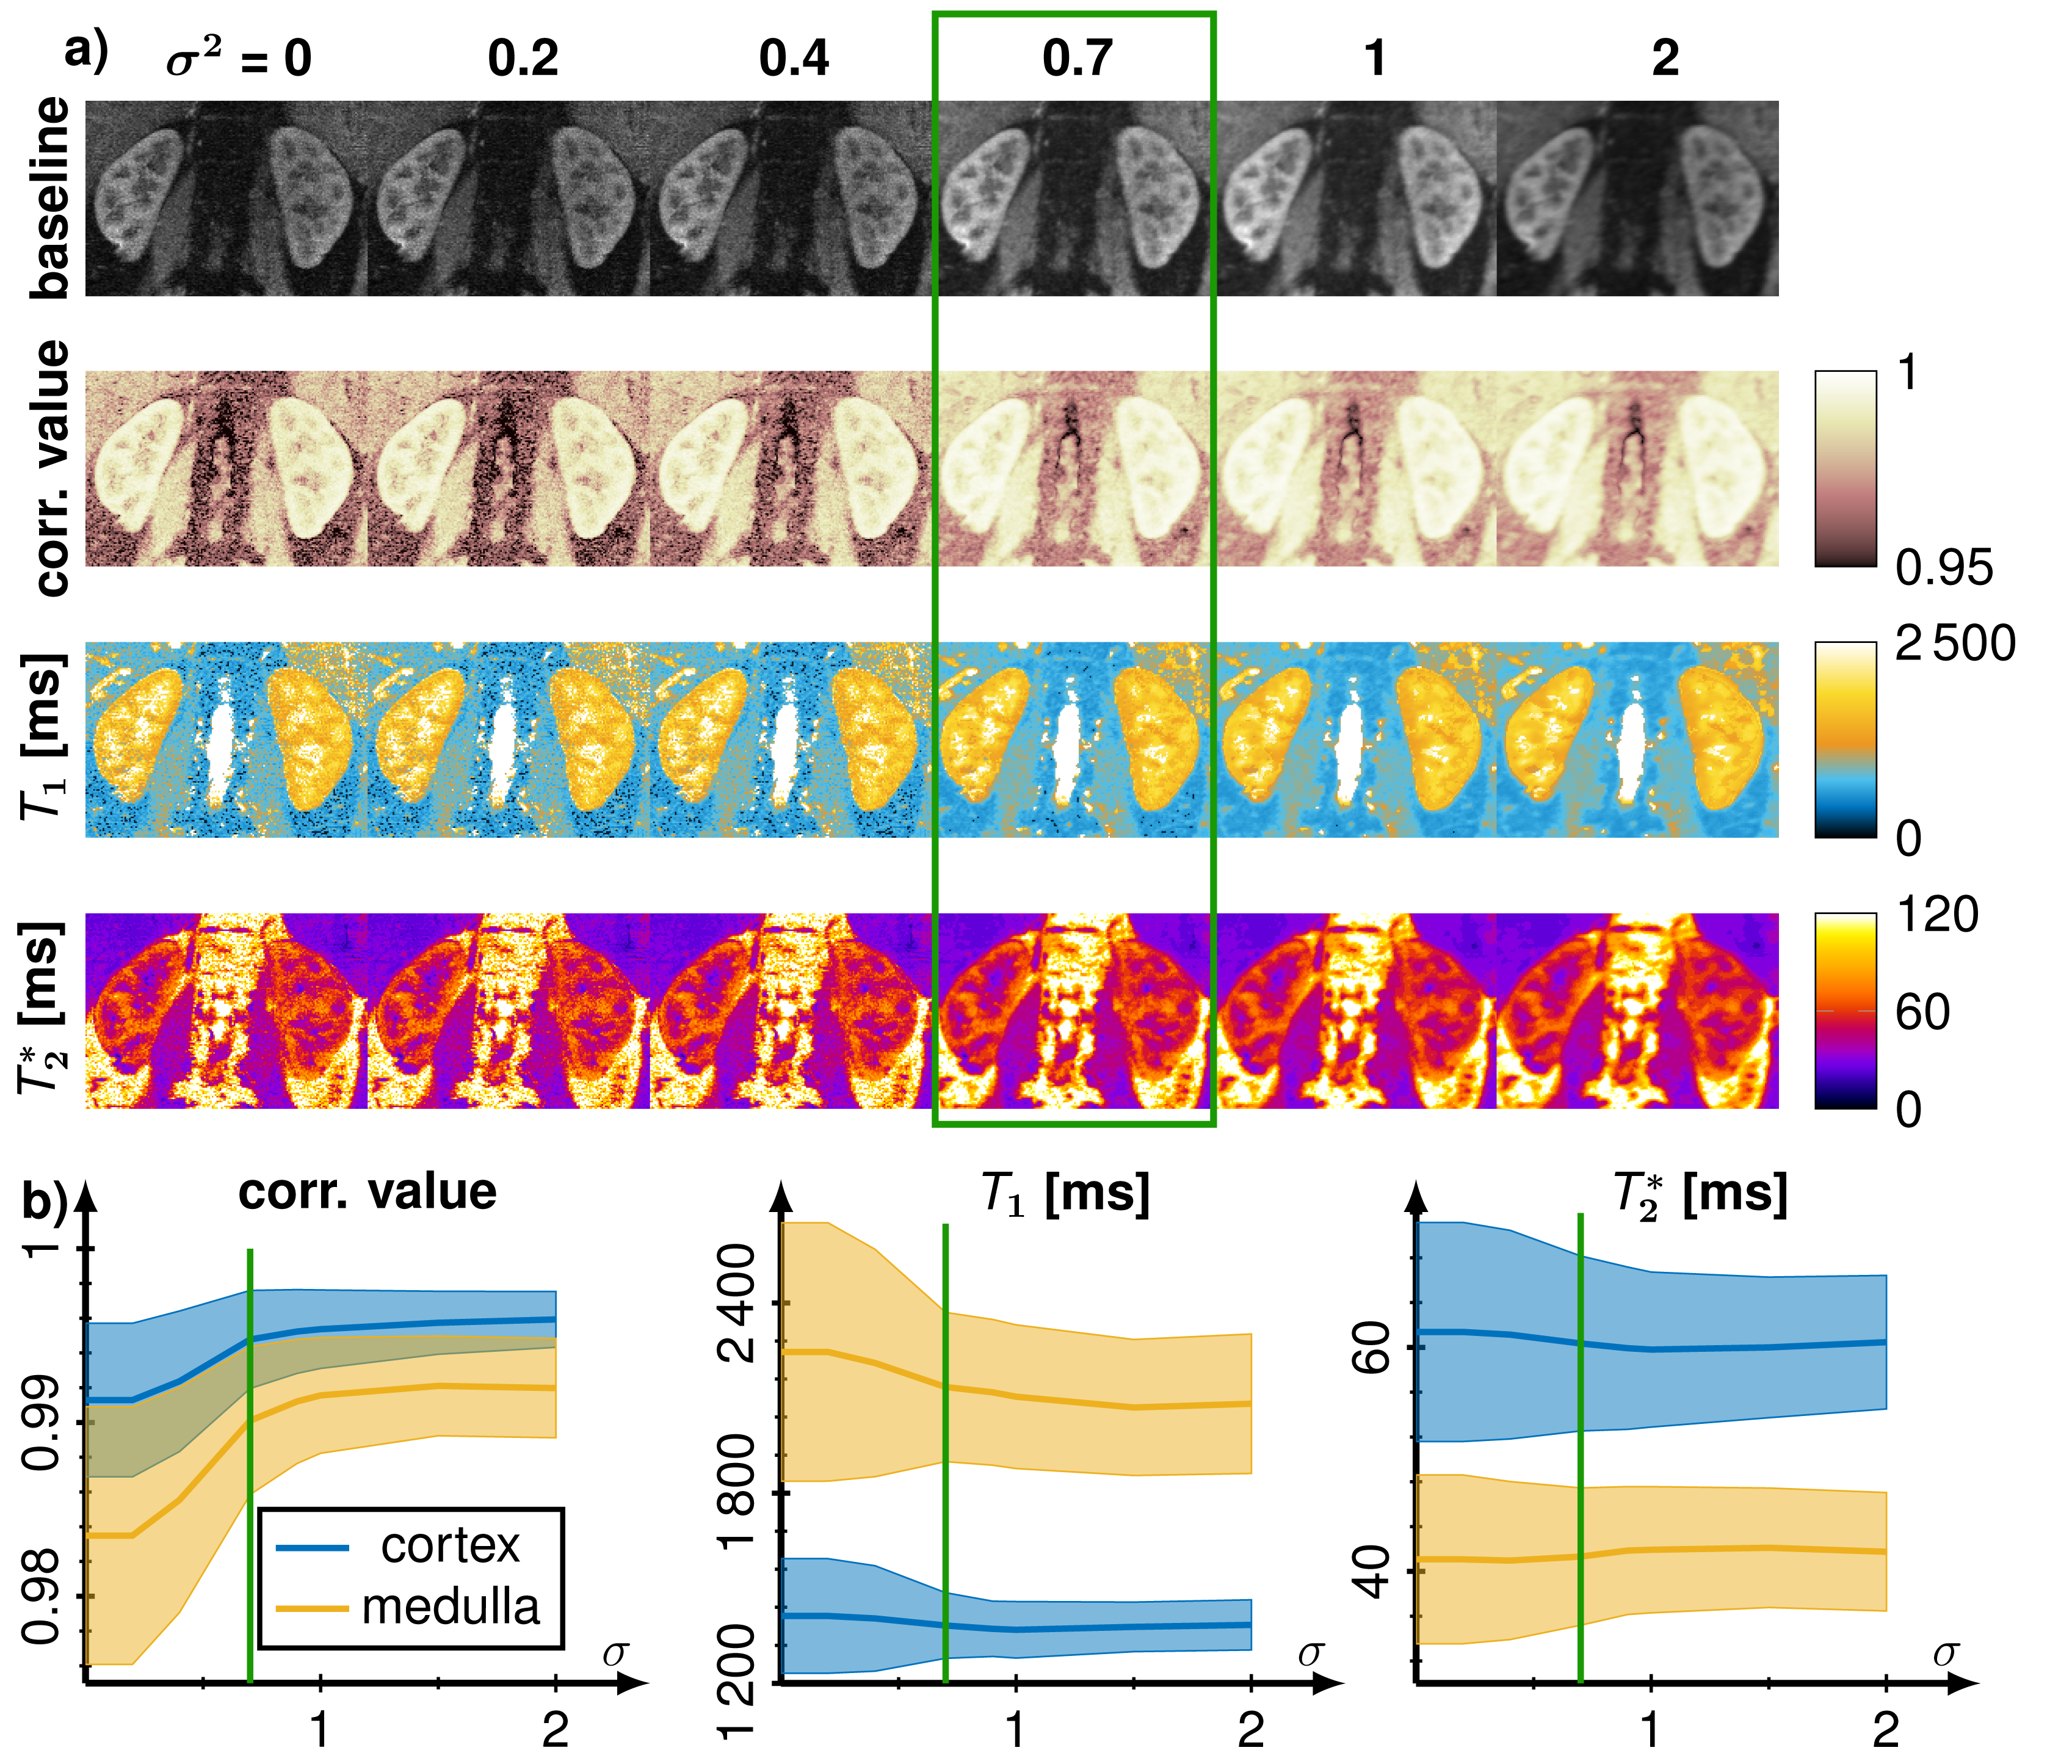
A MRF sequence based on an echo-planar imaging (EPI) readout proposed by Rieger et al. [4] with an in-line group matching reconstruction was implemented at a 3T scanner (Magnetom Skyra, Siemens Healthineers) with a 28-channel receiver coil array. The sequence parameters were FOV = 380 x 380 mm, matrix size = 256 x 256, slice thickness = 5 mm, bandwidth = 1148 Hz/px, GRAPPA factor = 3, partial fourier = 5/8, fat saturation and varying flip angle α (17°- 43°), TE (16 - 76.5 ms), TR (383 - 625 ms) as shown in Fig. 1. Dictionary were generated using MATLAB (The MathWorks; Natick, MA) consisting of 70,236 entries with T1 (100-3500 ms), T2* (10-2000 ms) and flip angle efficiency B1+ (0.7 - 1.2). This dictionary was splitted into 4682 groups containing 15 entries each and the measured signal was match with the best fitting 200 groups. Acquisition time was 15.4 seconds for acquiring 35 baseline images in one breath-hold covering 4 slices and online reconstruction took less than 30 seconds. Additionally, T1 maps were generated using 5(3s)3 MOLLI scheme and T2* using multi gradient echo (multi GRE) using 12 contrasts (2 - 40 ms). Images were acquired in a phantom and in vivo in 8 healthy volunteers (6 male, 22-33 years old) in coronal orientation.To evaluate our approach region of interests were drawn in the kidneys to segment the renal medulla and cortex to calculate mean values and standard deviations of the T1 and T2* times. Gaussian smoothing was applied on the baseline images to increase fit stability and decrease noise. The kernel size was set to 5x5 with variance 0.7.
Results
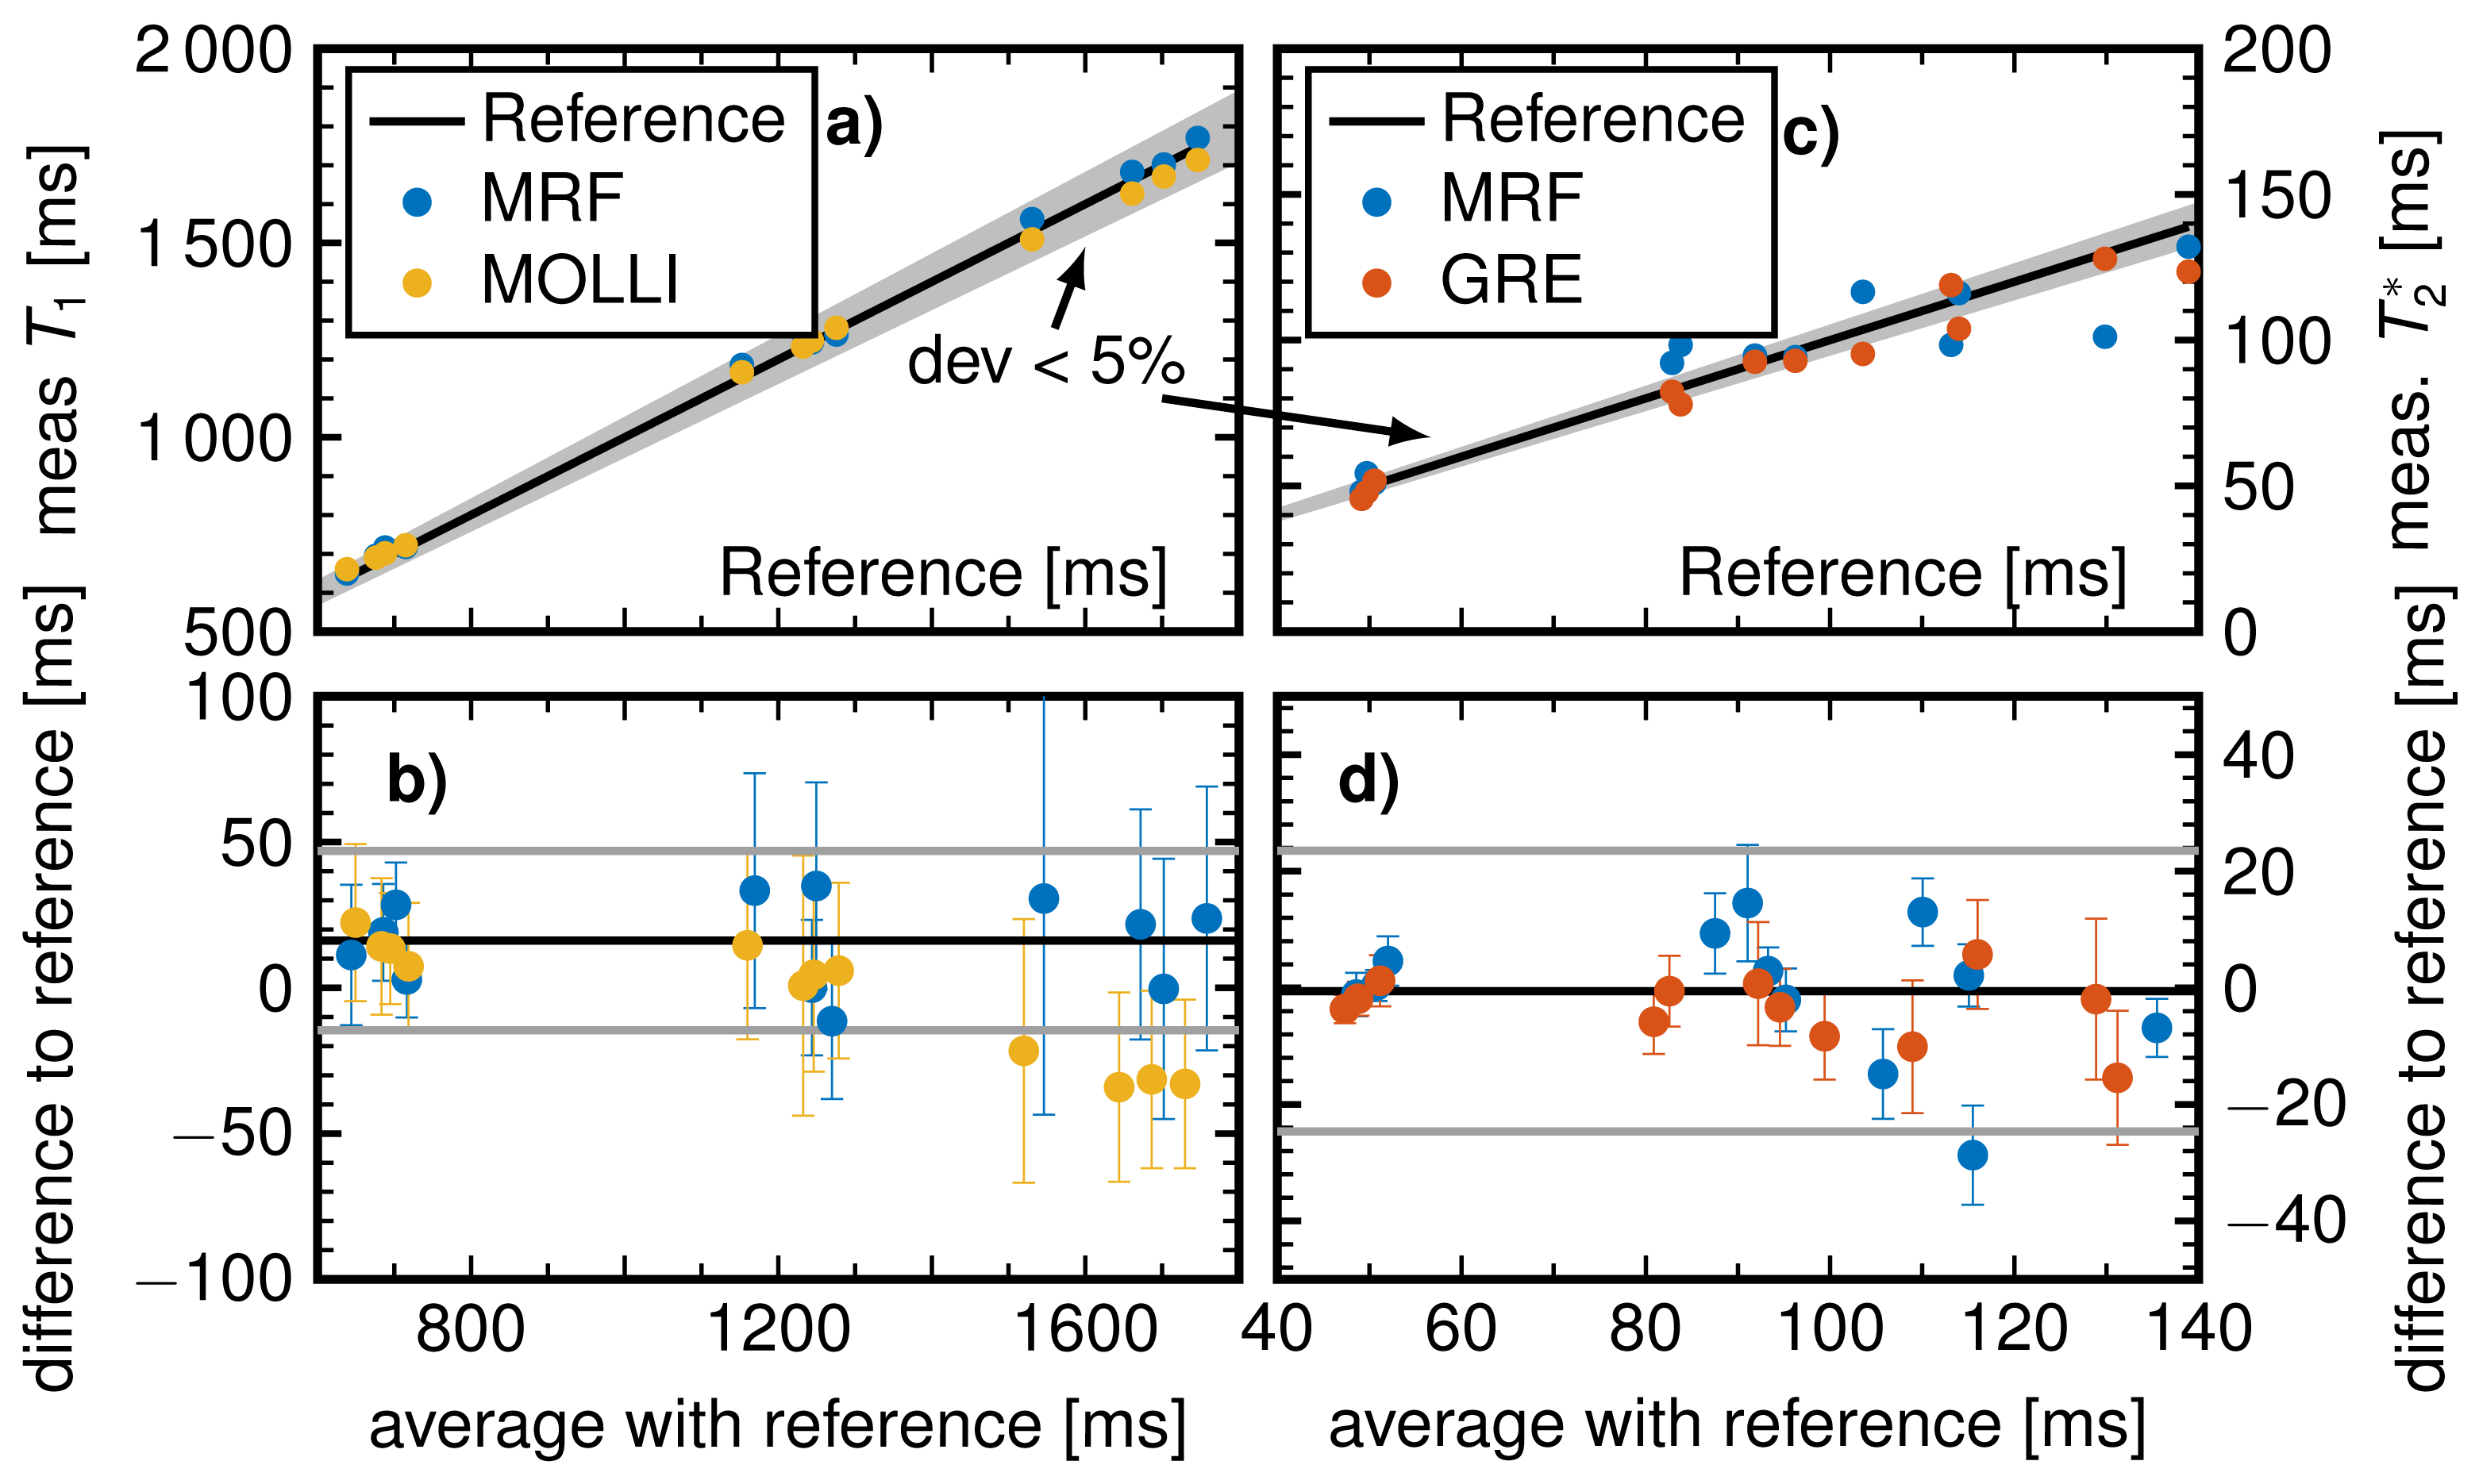
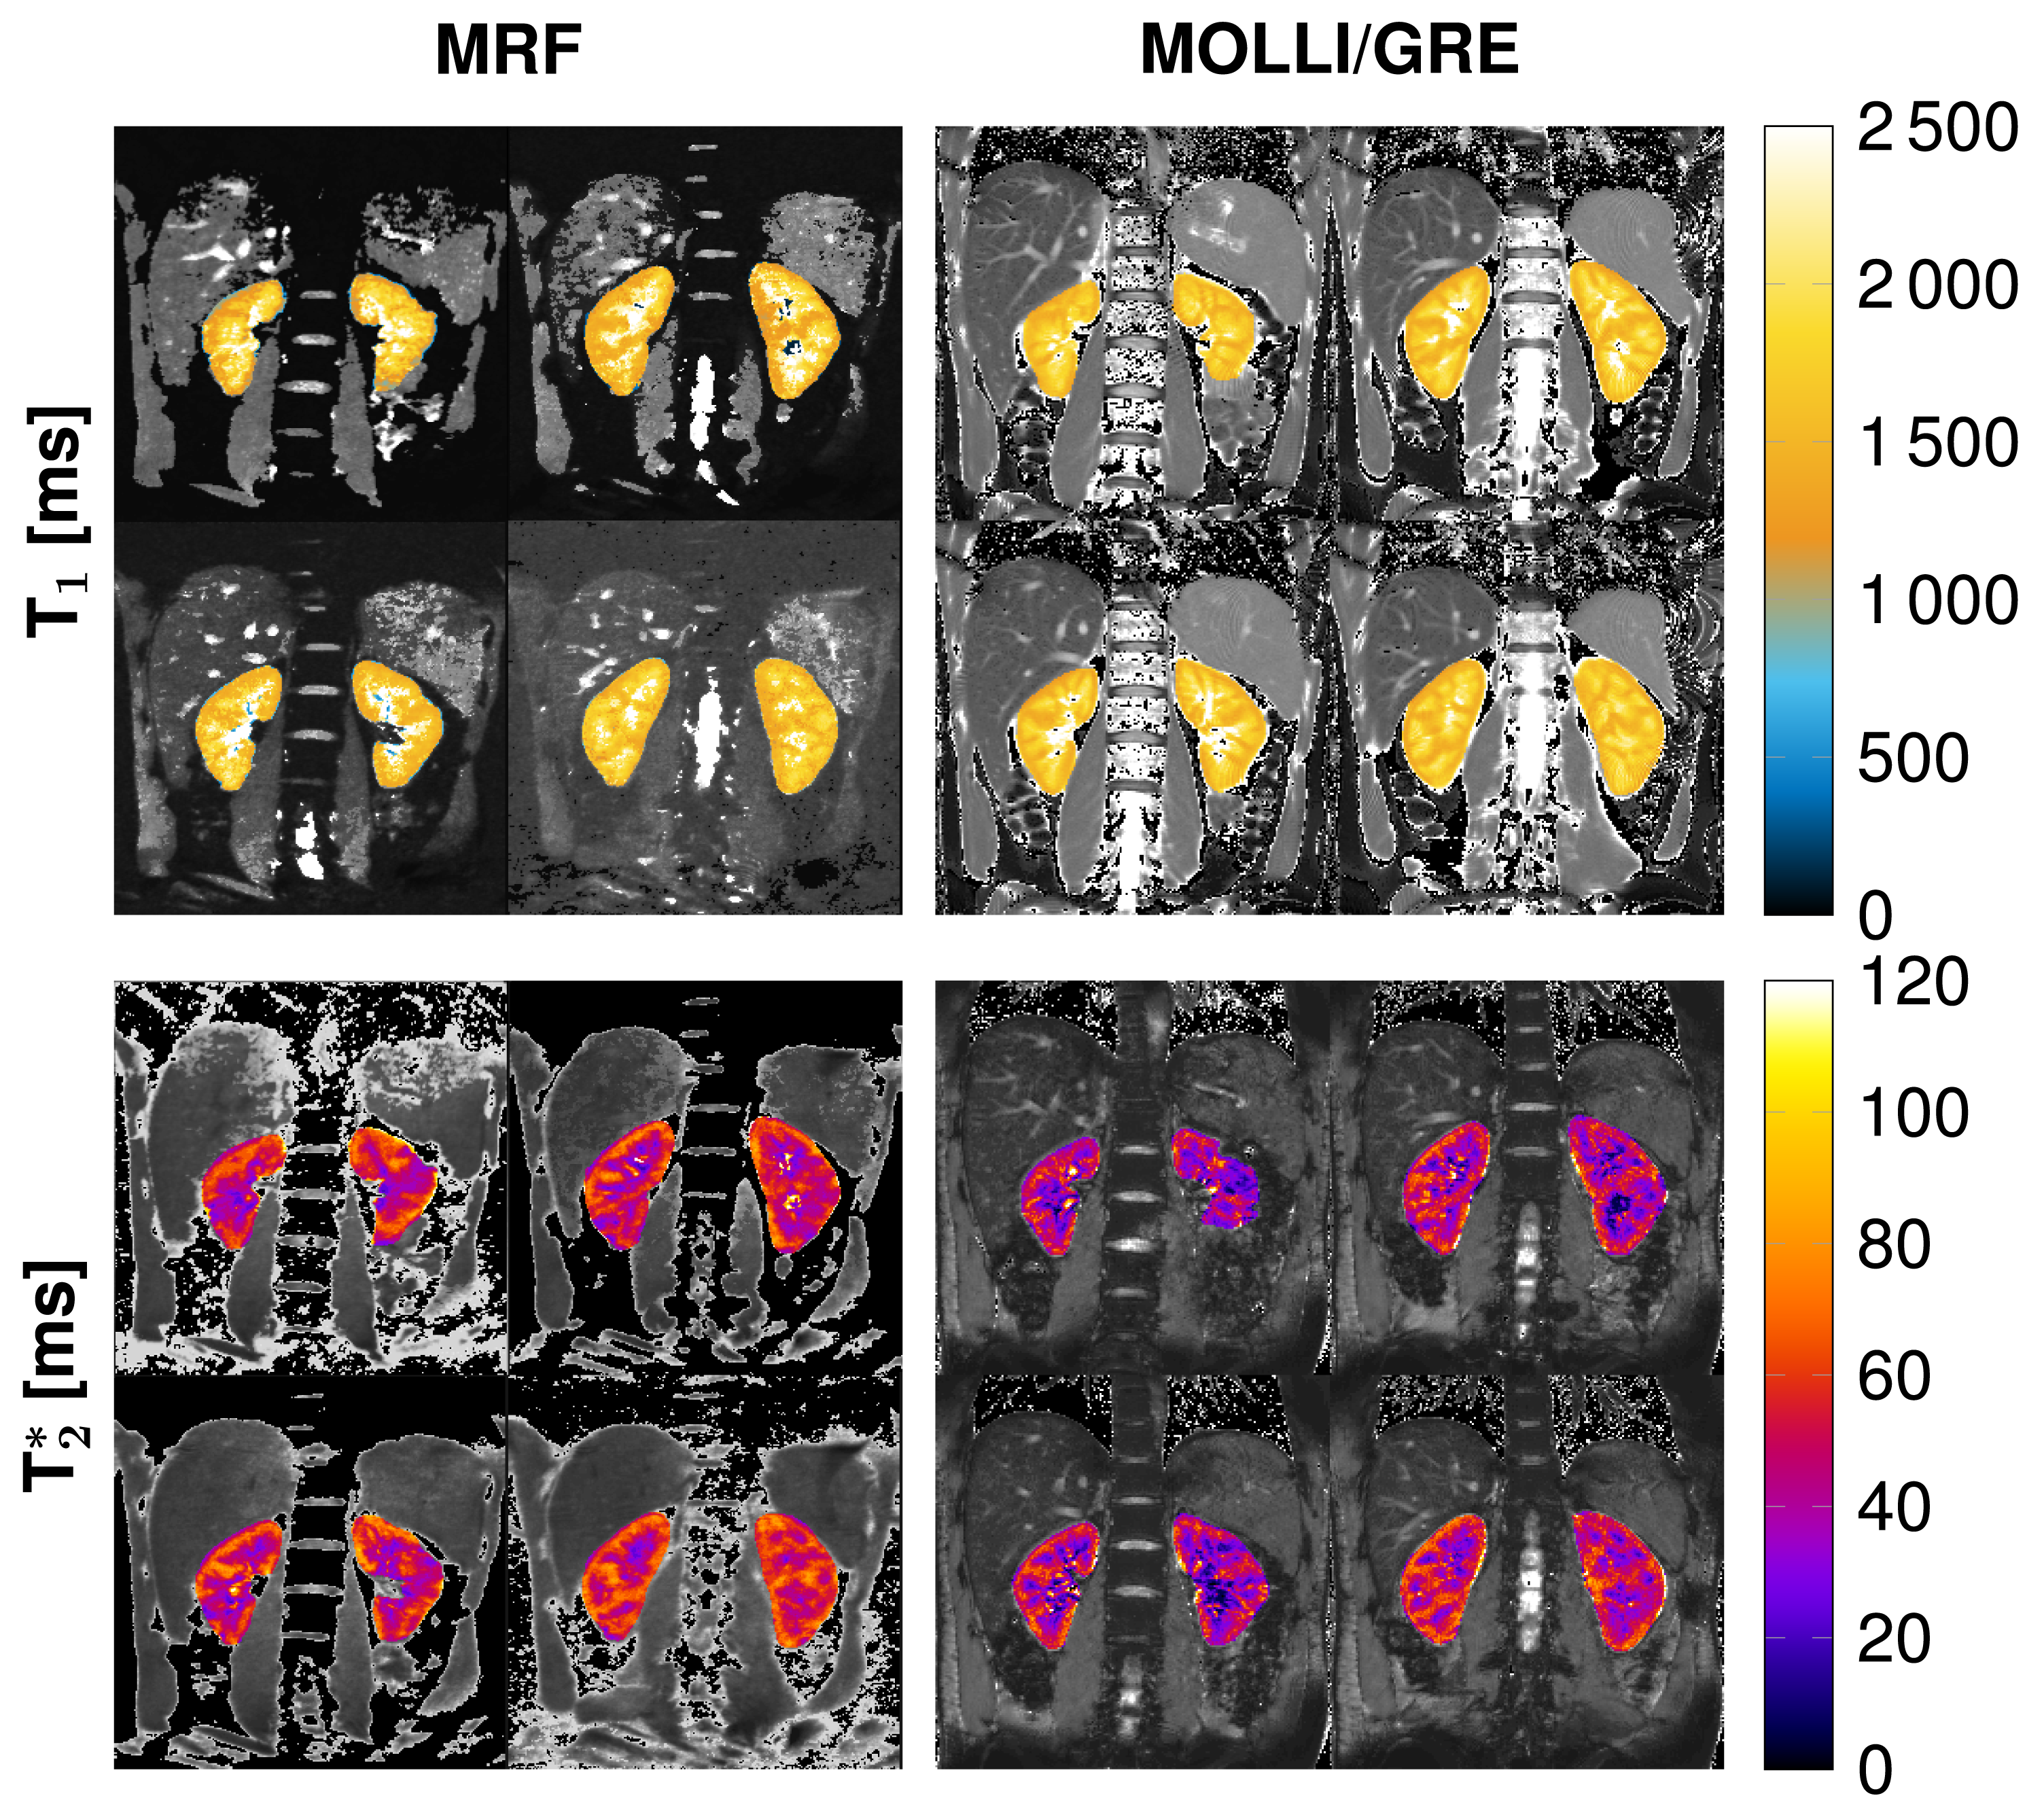
MRF-EPI measurements were reproducible in the phantom with deviations of less than 5 % for T1 and 10 % for T2* values. Bland-Altman plots and correlation plot of MRF compared with MOLLI, IR, multi GRE and GRE are depicted in Fig. [2]. Standard deviations are comparable to MOLLI and multi GRE and reproducibility measurements showed variability of T1 less than 10 ms and T2* less than 1.5 ms. MRF in vivo measurements resulted in mean values and standard deviations in the cortex T1 = 1456 ± 236 ms, T2* = 54.7 ± 7.8 ms and in the medulla T1 = 1921 ± 182 ms, T2* = 35.2 ± 5.6 ms. Figure 3 shows the T1 and T2* map compared with MOLLI and multi GRE in vivo in one representative subject. Figure 4 shows the influence of filtering noisy baseline images on the parametric map quality. Gaussian filtering with variance of 0.7 decreased the noise in the parameter maps without changing the mean value.Discussion
In this feasibility study, the proposed kidney MRF sequence resulted in T1 and T2* maps comparable to gold standard methods as MOLLI and multi GRE. In vivo, a slight overestimation and higher standard deviations were observed compared with MOLLI due to more noise in the baseline images. The obtained relaxation times of the renal cortex and the renal medulla were comparable to literature values [1, 5]. Further research should focus on decreasing the noise in the baseline images by using different denoising approaches.Conclusion
A renal MRF sequence was implemented to measure T1 and T2* times of 4 slices during a single breath-hold. T1 and T2* times of the renal cortex and the renal medulla were comparable to literature, which proved the feasibility of renal MRF T1 and T2* mapping.Acknowledgements
No acknowledgement found.References
[1] Wolf Marcos, Boer Anneloes, Sharma Kanishka, et al. Magnetic resonance imaging T1- and T2-mapping to assess renal structure and function: a systematic review and statement paper NephrolDial Transplant. 2018;33:ii41-ii50.
[2] Burnier Michel, Pruijm Menno, Mendichovszky Iosif A, et al. Renal blood oxygenation leveldependentmagnetic resonance imaging to measure renal tissue oxygenation: a statement paperand systematic review Nephrol Dial Transplant. 2018;33:ii22-ii28.
[3] Ma Dan, Gulani Vikas, Seiberlich Nicole, et al. Magnetic resonance fingerprinting Nature.2013;495:187–192.
[4] Rieger Benedikt, Akc¸akaya Mehmet, Pariente Jos´e C., et al. Time efficient whole-brain coveragewith MR Fingerprinting using slice-interleaved echo-planar-imaging Sci Rep. 2018;8:2045-2322.
[5] Hedgire Sandeep S, McDermott Shaunagh, Wojtkiewicz Gregory R, Abtahi Seyed Mahdi, HarisinghaniMukesh, Gaglia Jason L. Evaluation of renal quantitative T2* changes on MRI followingadministration of ferumoxytol as a T2* contrast agent. Int. J. Nanomed. 2014;9:2101-2207.
Figures