3743
Optimizing signal patterns for MR vascular fingerprinting
Aurelien Delphin1, Fabien Boux1,2, Clément Brossard1, Jan M Warnking1, Benjamin Lemasson1, Emmanuel Luc Barbier1, and Thomas Christen1
1Univ. Grenoble Alpes, Inserm, U1216, Grenoble Institut Neurosciences, GIN, 38000, Grenoble, France, 2Univ. Grenoble Alpes, Inria, CNRS, G-INP, 38000, Grenoble, France
1Univ. Grenoble Alpes, Inserm, U1216, Grenoble Institut Neurosciences, GIN, 38000, Grenoble, France, 2Univ. Grenoble Alpes, Inria, CNRS, G-INP, 38000, Grenoble, France
Synopsis
MR vascular fingerprinting proposes to map vascular properties such as blood volume fraction, average vessel radius or blood oxygenation saturation (SO2). The fingerprint pattern used in previous studies provides low sensitivity on SO2. We optimised signal patterns built from pre and post USPIO acquisitions. Concatenation of different echoes associated with higher dimensional dictionaries led to better estimates in both healthy and tumoral tissues.
Introduction
MR fingerprinting1 is an efficient tool to acquire multiple quantitative maps simultaneously. MR vascular fingerprinting (MRvF) proposes to use this framework to extract vascular properties with fast acquisition times2. The initial implementation of MRvF used the GESFIDSE sequence (Gradient Echo Sampling of the FID and Spin Echo) that was known to be sensitive to blood oxygenation saturation (SO2) and microvascular geometry (blood volume fraction (BVf) and vessel averaged radius (R)). More precisely, the ratio of signals acquired pre and post injection of iron-based contrast agent (USPIO) was used to remove B0 inhomogeneities and T2 effects. However it has been suggested3 that this MRvF pattern provides low sensitivity on SO2. In this study, we propose to reorganize the signal patterns to design more efficient fingerprints. Dictionaries were built with additional dimensions to take into account effects that were eliminated before. Our fingerprints were tested on 9 healthy and 9 tumor implanted rats. The results were compared against each other and against conventional steady-state perfusion measurements.Materials and Methods
- 9L tumors were implanted in 9 rats (Fischer) and imaging was performed between 14 and 16 days later. 9 healthy rats (Fischer) were also imaged4.
- A 45 minutes MRI protocol including ADC, T2 and T2* maps was acquired on a 4.7T Bruker system. A GESFIDSE sequence (32 echoes, SE=60ms, see fig. 1) was acquired pre and post injection of USPIO (P904, Guerbet, France, 200µmol Fe/kg).
- Steady state analysis was performed on the 45 min protocol to obtain vessel size index (VSI), BVf5 and SO26 maps with home-made software7.
- Fingerprint analysis was performed on the two GESFIDSE acquisitions only (8 min protocol).
- The dictionary was generated using “MRVox”8, a Matlab (The MathWorks Inc., Natick, Ma, USA) based home-made software. Up to 5 dimensions were considered: R=[1:10] µm, BVf=[0.34:10.18] %, SO2=[0.35:0.9] %, T2=[45:130] ms and ADC=[600:1300] µm2/s. A total of 12,545,280 signals were generated.
- Three fingerprints patterns were used, based on different combinations of GESFIDSE signals acquired pre and post USPIO injection. The ratio post over pre (32 echoes, fig. 2c), the concatenation of the pre and post (64 echoes, fig. 2d) signals and a “hybrid” pattern. The latter is the concatenation of the 9 pre and post echoes before the 180° pulse and the 23 echoes from the ratio after the 180° pulse, yielding a fingerprint of 41 echoes (fig. 2e). The concatenation and hybrid patterns were designed to increase signals variations across the dictionary dimensions, as shown for simulated SO2 on fig. 2. Simulation studies on other dimensions are not shown here.
Results
The 5D dictionary generated for this study was first compared to a reduced 3D version without T2 effects and for ADC=810µm2/s (33188 signals). Results for BVf are presented in fig. 3, along with steady-state measurements. Increasing the number of parameters brought little change with the ratio pattern. However, maps obtained with the concatenation pattern using the 5D dictionary had better contrast and lower values than the ones obtained with the 3D dictionary (BVf=4.2±0.5% vs. 4.8±0.4 N=9). The concatenation pattern provided much sharper contrasts than the ratio pattern in the lower parts of the brain, where SNR is degraded. It also produced the closest output to the steady-state measurements (BVf=3.5±0.6%, N=9).Results from the three MRvF patterns combined with the 5D dictionary are presented for one tumor animal on fig. 4. All methods showed a BVf increase in the tumor. The concatenation and hybrid patterns showed an increased VSI in the tumor, similar to that of the steady-state measurement and previous histological findings4. On the opposite, the ratio displayed a decreased VSI in the tumor. SO2 values found with the steady-state approach were similar in the tumor and healthy tissues. However the mathematical model in this approach might not be adapted to this type of vascular environment2. Conversely, all three MRvF patterns found reduced SO2 estimates in the tumor. Only the hybrid pattern produced SO2 values in the contralateral hemisphere that were in line with the steady-state approach and expected values in healthy tissue. The hybrid pattern showed expected contrasts on the three metrics, with values in line with what is expected in healthy tissue but produced noisier maps than the concatenation pattern. Fig. 5 presents SO2 results obtained after averaging pre and post signals (3 NEX) and two slices. The higher SNR led to smoother maps while keeping contralateral values in the expected range of healthy tissues and low-oxygenated tumors.
Conclusions
Among the different MRvF signal patterns derived from pre and post USPIO GESFIDSE acquisitions, the hybrid concatenation of different echoes associated with higher dimensional dictionaries led to the best estimates in both healthy and tumoral tissues. Comparisons with other tumor models and histological measurements should be performed in order to conclude on the most efficient patterns. Dictionary learning using interpretable regression methods9 could also give more insight on which parts of the signals should be used for optimal fingerprint design and the required SNR level for accurate estimates. These encouraging results could lead to a reduction of acquisition time from 45 min to a few minutes only.Acknowledgements
The MRI facility IRMaGe is partly funded by the French program “Investissements d’Avenir” run by the French National Research Agency, grant “Infrastructure d’avenir en Biologie Santé” [ANR-11-INBS-0006]References
- Ma D, Gulani V, Seiberlich N, Liu K, Sunshine JL, Duerk JL, et al. Magnetic resonance fingerprinting. Nature. 2013 Mar;495(7440):187–92.
- Christen T, Pannetier NA, Ni WW, Qiu D, Moseley ME, Schuff N, et al. MR vascular fingerprinting: A new approach to compute cerebral blood volume, mean vessel radius, and oxygenation maps in the human brain. NeuroImage. 2014 Apr 1;89:262–70.
- Christen T, Ni WW, Guo J, Fan A, Moseley M and Zaharchuk G: MR Vascular Fingerprinting during Gas Challenges. (Proceedings of Joint Annual Meeting ISMRM-ESMRMB 2018)
- Lemasson B, Pannetier N, Coquery N, Boisserand LSB, Collomb N, Schuff N, et al. MR Vascular Fingerprinting in Stroke and Brain Tumors Models. Scientific Reports. 2016 Nov 24;6:37071.
- Troprès I, Grimault S, Vaeth A, Grillon E, Julien C, Payen J-F, et al. Vessel size imaging. Magnetic Resonance in Medicine. 2001;45(3):397–408.
- Christen T, Lemasson B, Pannetier N, Farion R, Segebarth C, Rémy C, et al. Evaluation of a quantitative blood oxygenation level-dependent (qBOLD) approach to map local blood oxygen saturation. NMR in Biomedicine. 2011;24(4):393–403.
- nifm-gin/MP3 [Internet]. nifm-gin; 2019 [cited 2019 Nov 5]. Available from: https://github.com/nifm-gin/MP3
- Pannetier NA, Debacker C, Mauconduit F, Christen T, Barbier EL. A Simulation Tool for Dynamic Contrast Enhanced MRI [Internet]. 2013 [cited 2019 Oct 10]. Available from: https://journals.plos.org/plosone/article?id=10.1371/journal.pone.0057636
- Boux F, Forbes F, Arbel J, Barbier EL. Dictionary-Free MR Fingerprinting Parameter Estimation Via Inverse Regression. In: Joint Annual Meeting ISMRM-ESMRMB 2018 [Internet]. Paris, France; 2018 [cited 2019 Oct 28]. p. 1–2. (Proceedings of Joint Annual Meeting ISMRM-ESMRMB 2018). Available from: https://hal.archives-ouvertes.fr/hal-01941630
Figures
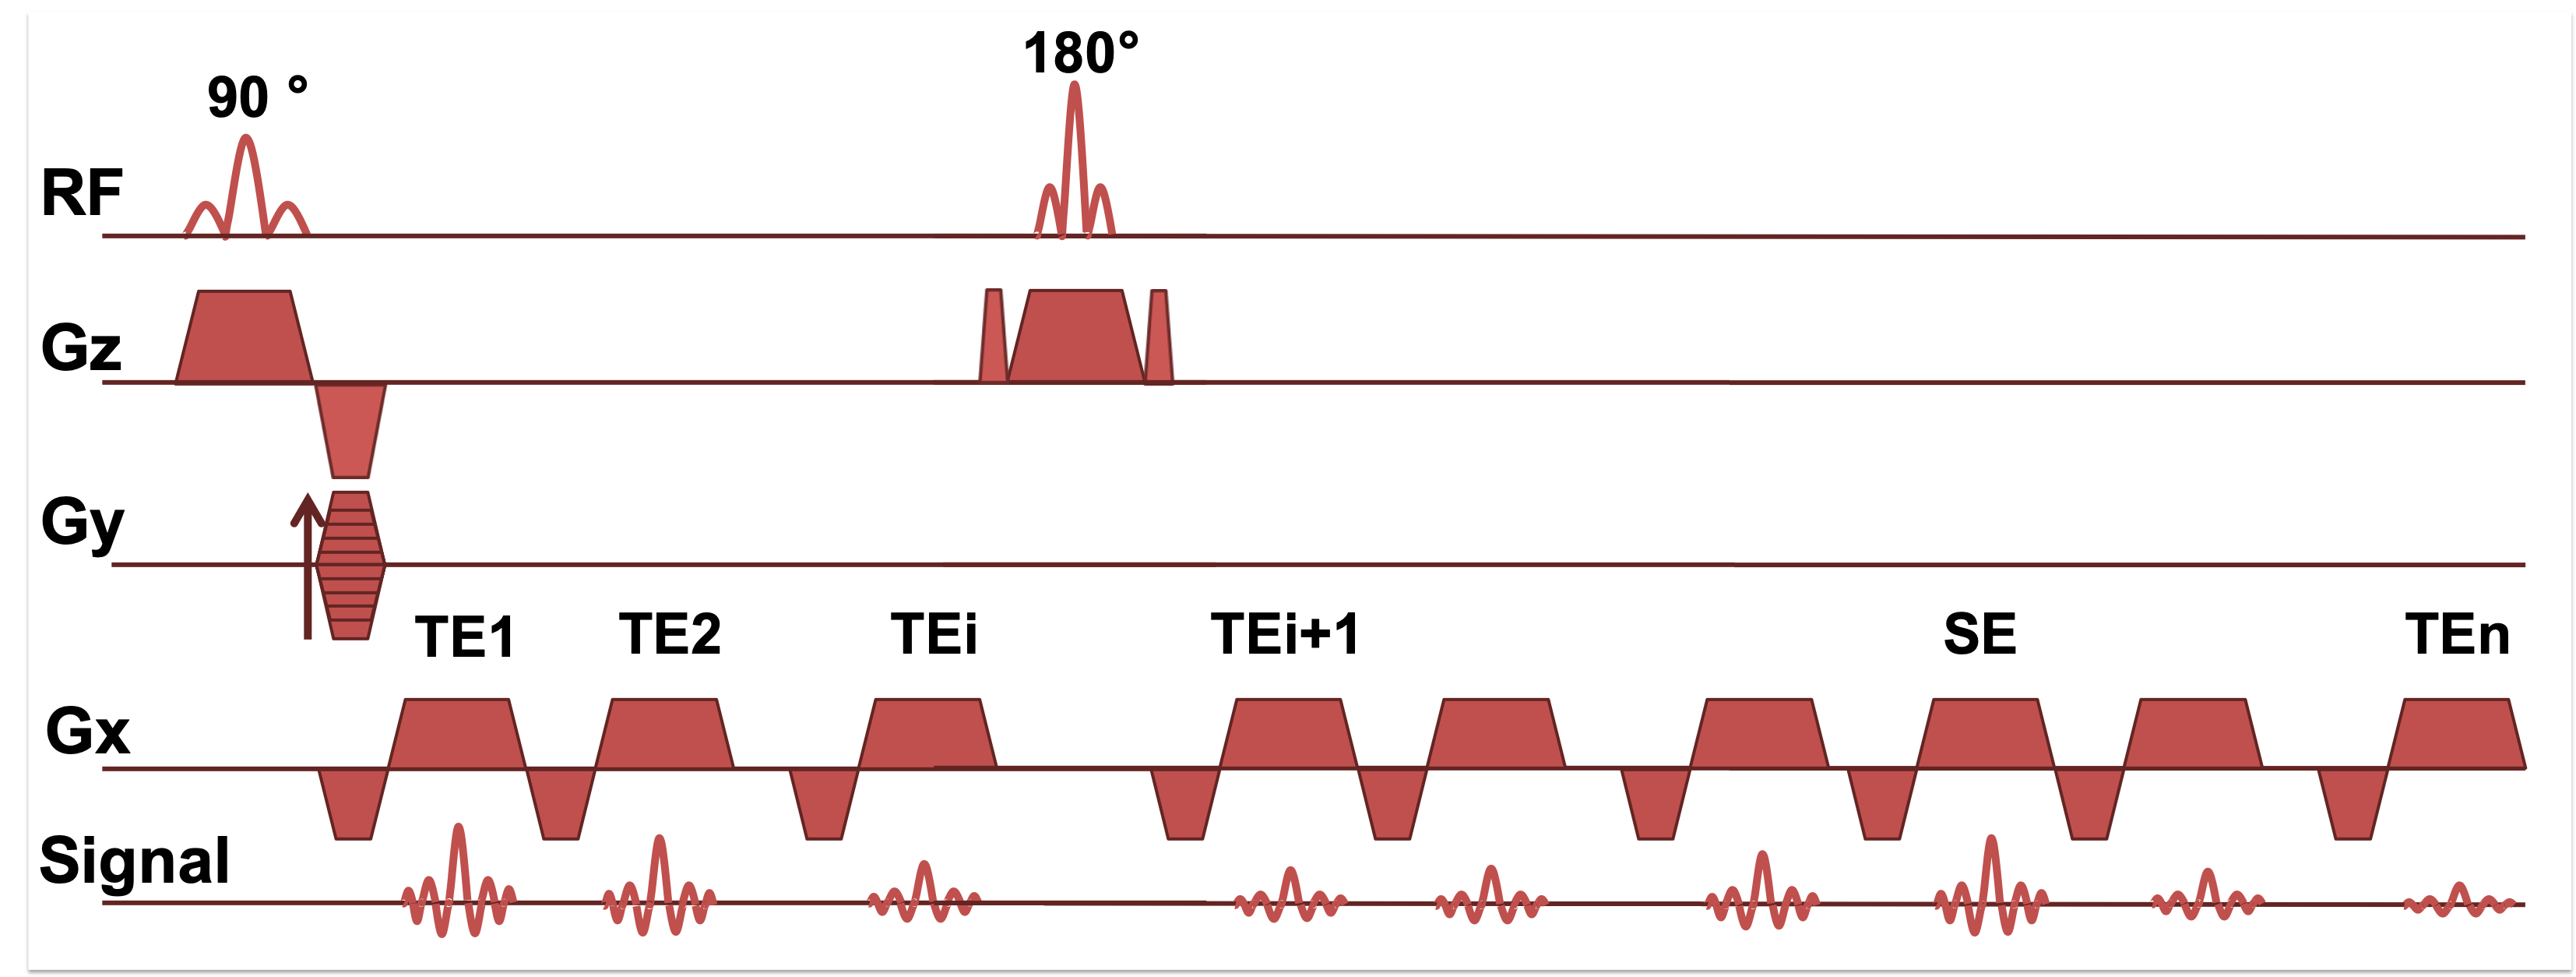
Gradient Echo Sampling of the FID and Spin Echo (GESFIDSE) sequence.
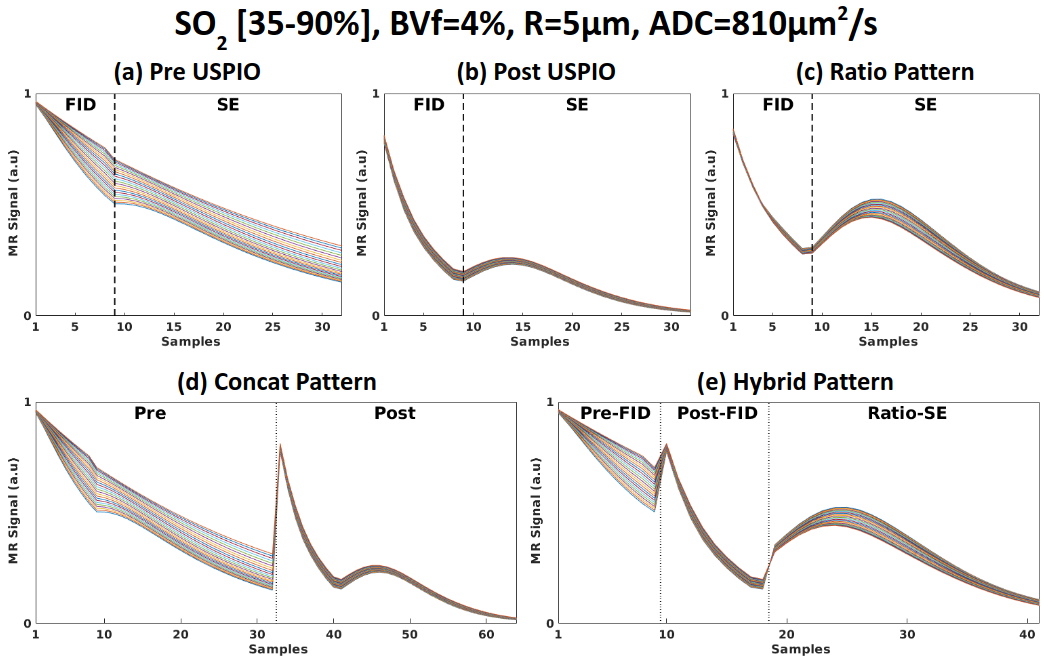
Simulated signals, each curve corresponds to one value of SO2. (a) GESFIDSE Signal pre USPIO injection, (b) GESFIDSE signal post USPIO injection, (c) ratio of Post over Pre pattern, (d) concatenation of Pre and Post pattern, (e) hybrid pattern.
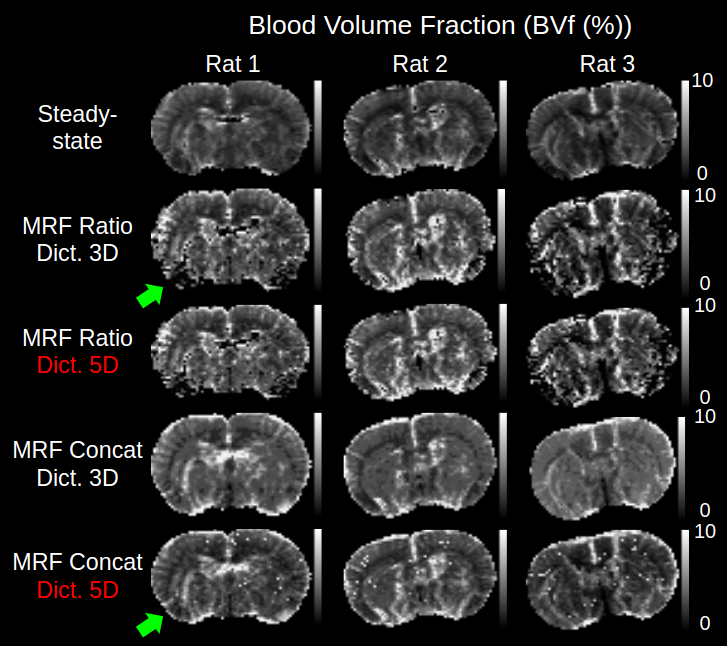
3D vs. 5D dictionary results for ratio and concatenation pattern
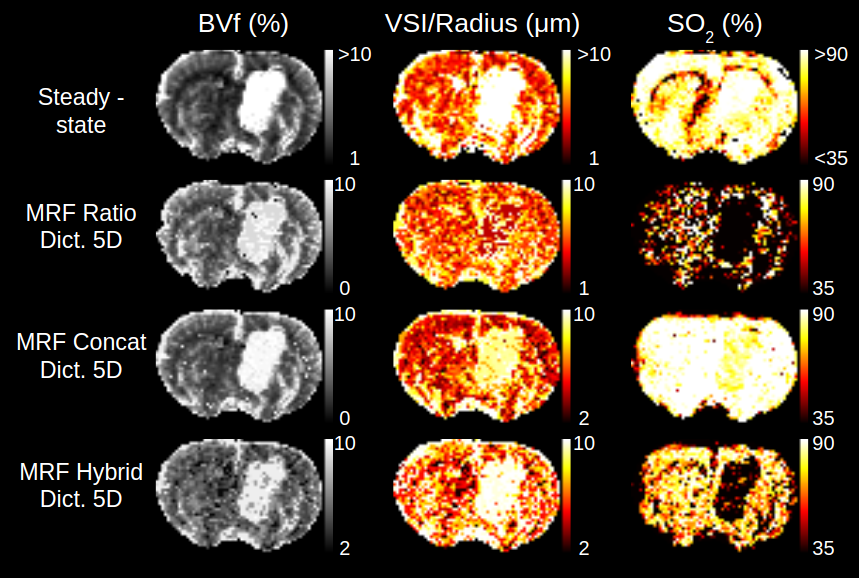
Comparison of maps obtained with different fingerprint patterns in one rat
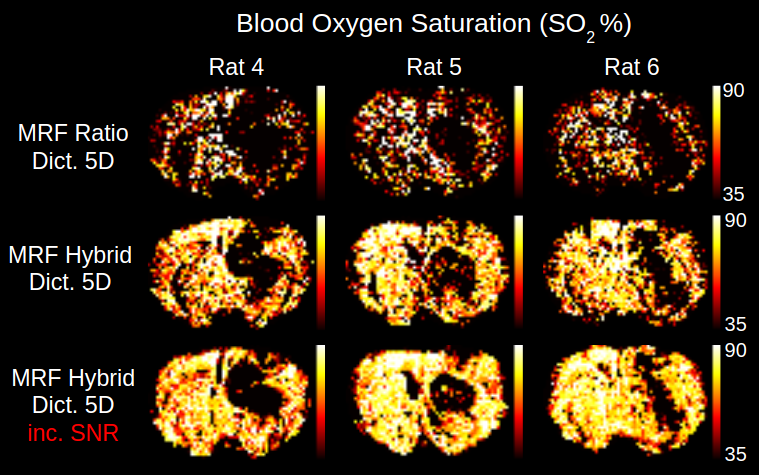
SO2 maps obtained with the ratio and hybrid pattern with 1NEX compared to results from hybrid pattern with 3NEX