3739
Slice Accelerated EPI-based Magnetic Resonance Fingerprinting for Simultaneous Estimation of T1, T2, T2* with Whole-brain Coverage1Medical Biophysics, University of Toronto, Toronto, ON, Canada, 2Rotman Research Institute, Baycrest Health Sciences, Toronto, ON, Canada, 3Grenoble Institute of Neurosciences, Inserm, Grenoble, France, 4Hurvitz Brain Sciences Research Program, Sunnybrook Research Institute, Toronto, ON, Canada
Synopsis
Magnetic resonance fingerprinting (MRF) offers a way to quantitatively estimate multiple relaxation parameters with a single scan, but fast MRF estimation of T1, T2, and T2* with a single acquisition remains challenging. Here, a dual-stage EPI-based MRF approach with online image reconstruction is proposed for estimating T1, T2, and T2*. We achieved 1.1x1.1x3 mm3 resolution with minimal distortion, and with the use of simultaneous multi-slice acceleration, our method can provide whole-brain coverage (1.7x1.7x3 mm3) in less than 3 minutes.
Introduction
Magnetic resonance fingerprinting (MRF) is a novel approach capable of fast and simultaneous quantification of multiple relaxation and field related parameters in a single acquisition1. Most MRF studies so far have targeted T1 and T2, overlooking T2*2. A few recent studies have attempted to add T2* estimation to the conventional MRF framework by utilization of spiral readout3-5. Spiral MRF offers short echo times and robustness to motion artefacts but requires offline reconstruction and thus still presents an implementation challenge for some sites. One recent study has proposed the use of echo-planar imaging (EPI) based MRF to estimate T1 and T2* with great success6, but did not include, T2, due to the gradient-echo (GE) nature of the sequence6,7. In the present study, we extend this EPI-based MRF approach by adding a spin-echo (SE) EPI stage to provide additional T2 sensitivity. Furthermore, we apply slice acceleration based on blipped-CAIPI simultaneous multi-slice (SMS)8 to provide whole-brain coverage in less than 3 minutes. Our method was validated against conventional relaxometry methods in phantoms and 3 healthy volunteers.Materials and Methods
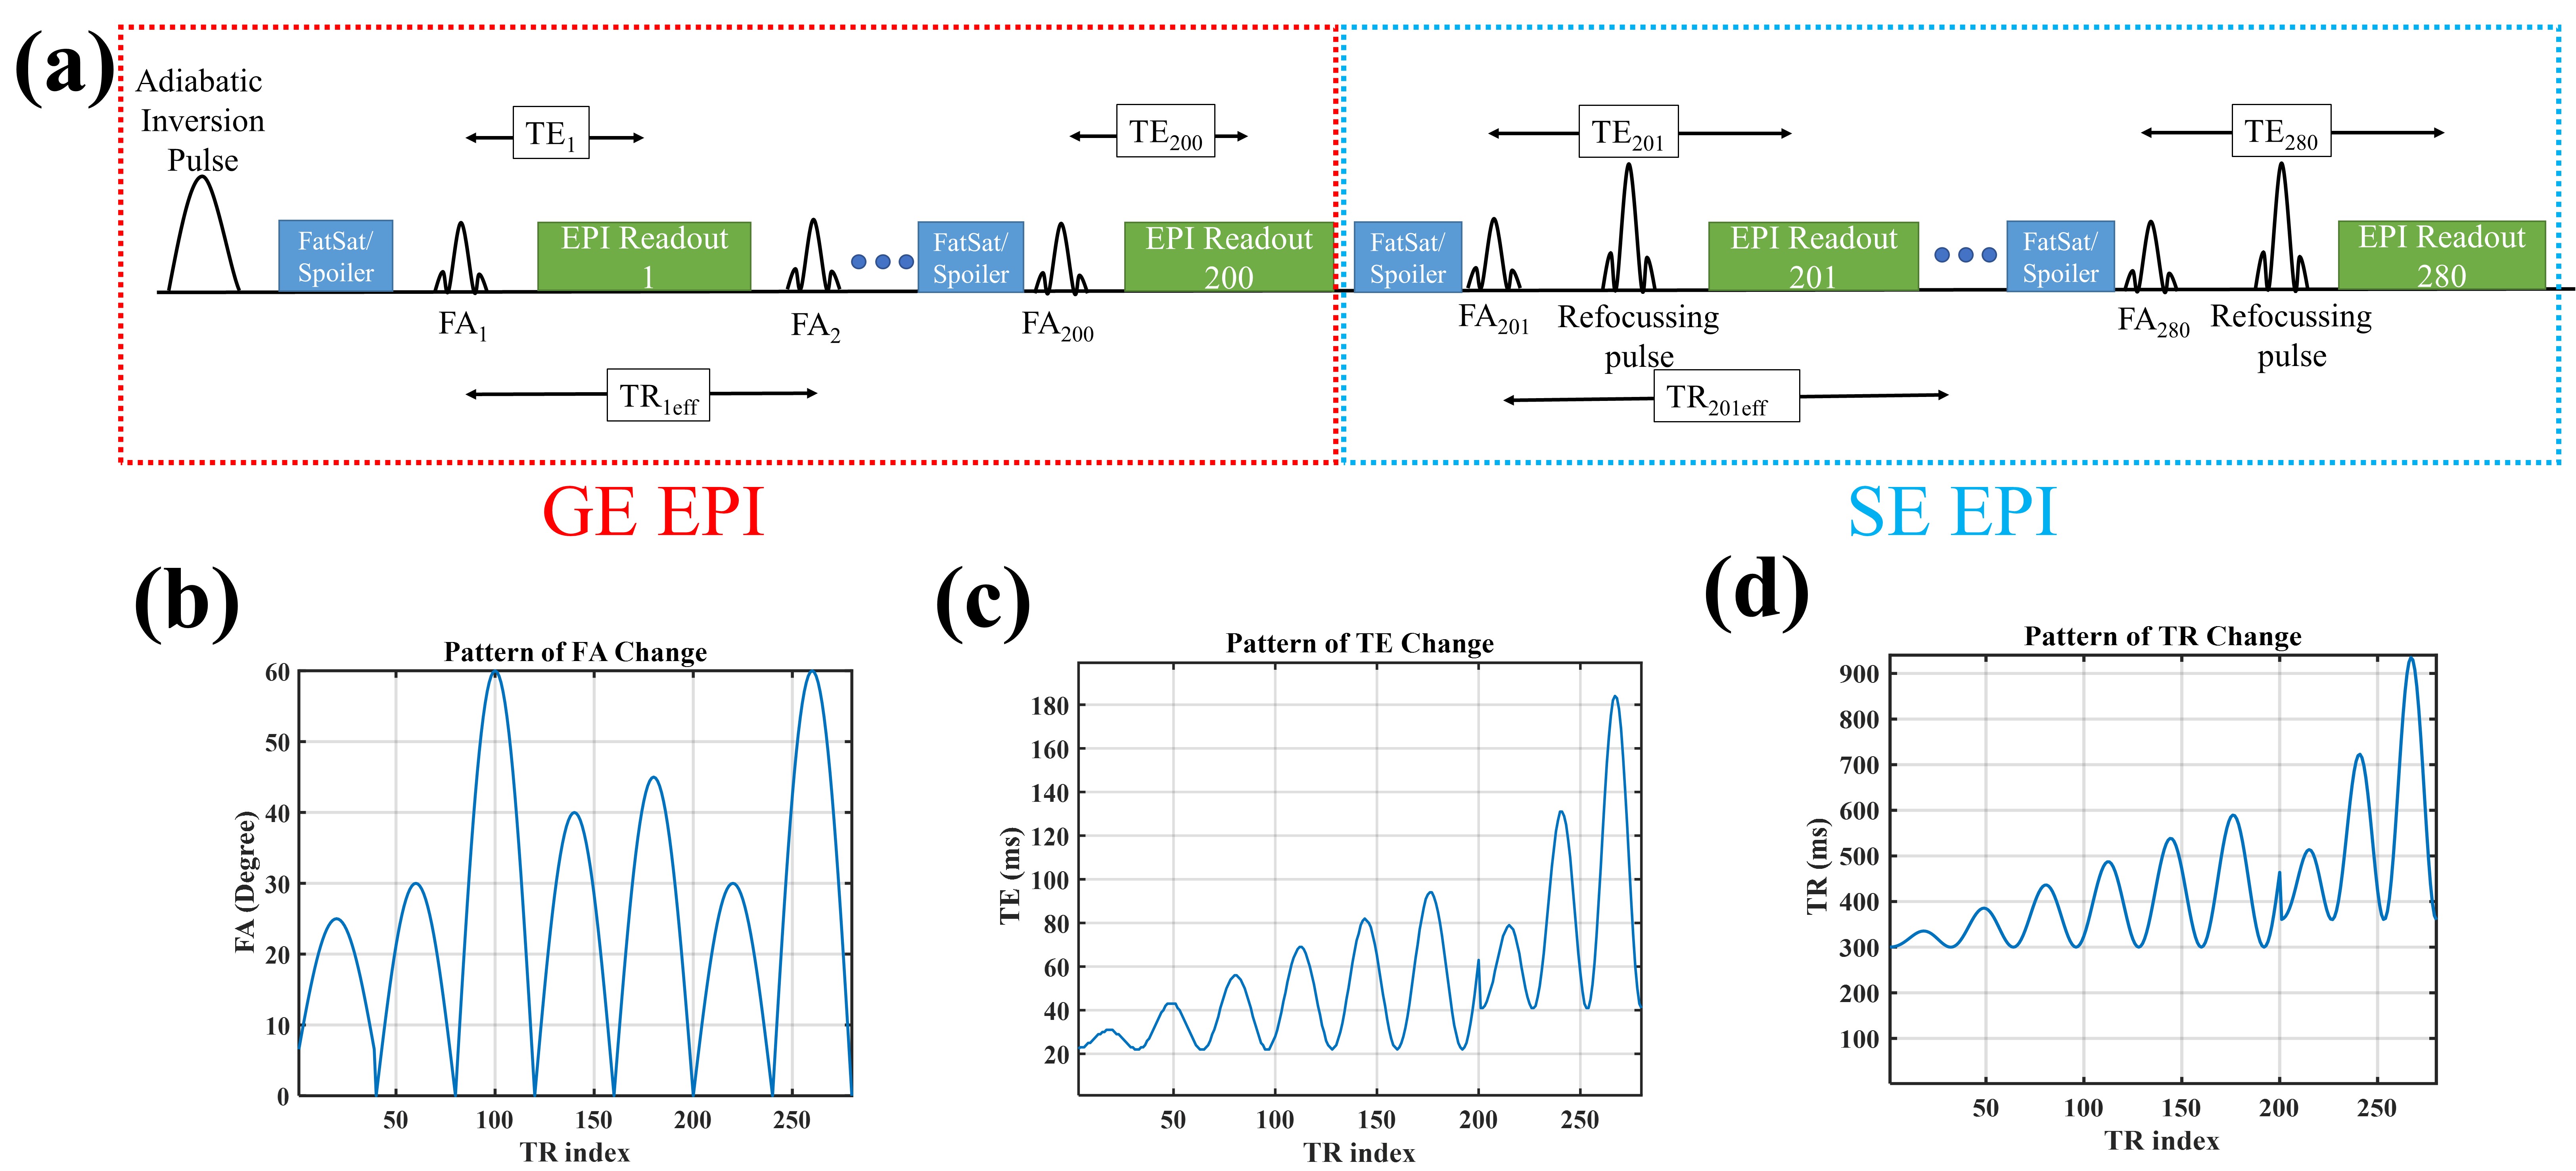
A SE stage (80 frames) was added after the GE stage (200 frames) of the EPI-based MRF sequence6, with no dead time between the two sections. Both gradient and RF spoiling were employed and the patterns of TE, TR, and FA were varied as shown in Fig 1. The dictionary was generated using the discrete form of the Bloch equation and assuming RF pulses to be instantaneous. In the dictionary, B1 was accounted for as a scaling factor applied to the nominal FAs. In the dictionary matching step, T1 and B1 information from the first stage (GE) were used along with the second-stage (SE) frames to match for T2. The duration of the SE section (80 frames) was selected as the knee point of the curve relating the relative T2 error and acquisition time.A phantom was constructed using vials with varying concentrations of CuSO4 and agar (1-4% w/w) to create a range of relaxation values. For in-vivo validation, three healthy human subjects (2 males, 31±7 years old) were also scanned with informed consent. The acquisitions were all done at 3 T (Siemens, Erlangen). Acquisition parameters for the single-band scans were: matrix-size=192x192, voxel-size=1.1x1.1x3 mm3, slice gap=50%, FOV=220x220 mm, GRAPPA=3, partial Fourier (PF)=6/8, bandwidth=1302 Hz/voxel and acquisition time=29 s/slice. For the SMS-accelerated whole-brain scans: matrix-size=128x128, voxel-size=1.7x1.7x3 mm3, MB-factor=4, GRAPPA=2, PF=6/8, Bandwidth=1954 Hz/pixel and the effective acquisition time=7 s/slice. To validate T1 estimates, inversion recovery turbo SE was used with eight different inversion times (TIs=50, 100, 200, 400, 800, 1600, 3200, 6400 ms), TR=10s, TE=9.5 ms. For T2 validation, a single echo TSE sequence was repeated with seven echo times (TEs=19, 38, 57, 76, 95, 114, 132, 152 ms), TR=5s. T2* was measured using a multi-echo GE with 12 echo times (TEs=2-80 ms), TR=1s. Pattern matching was done using the magnitude of the MR signal and the pre-calculated dictionary using a maximum dot product approach.
Results
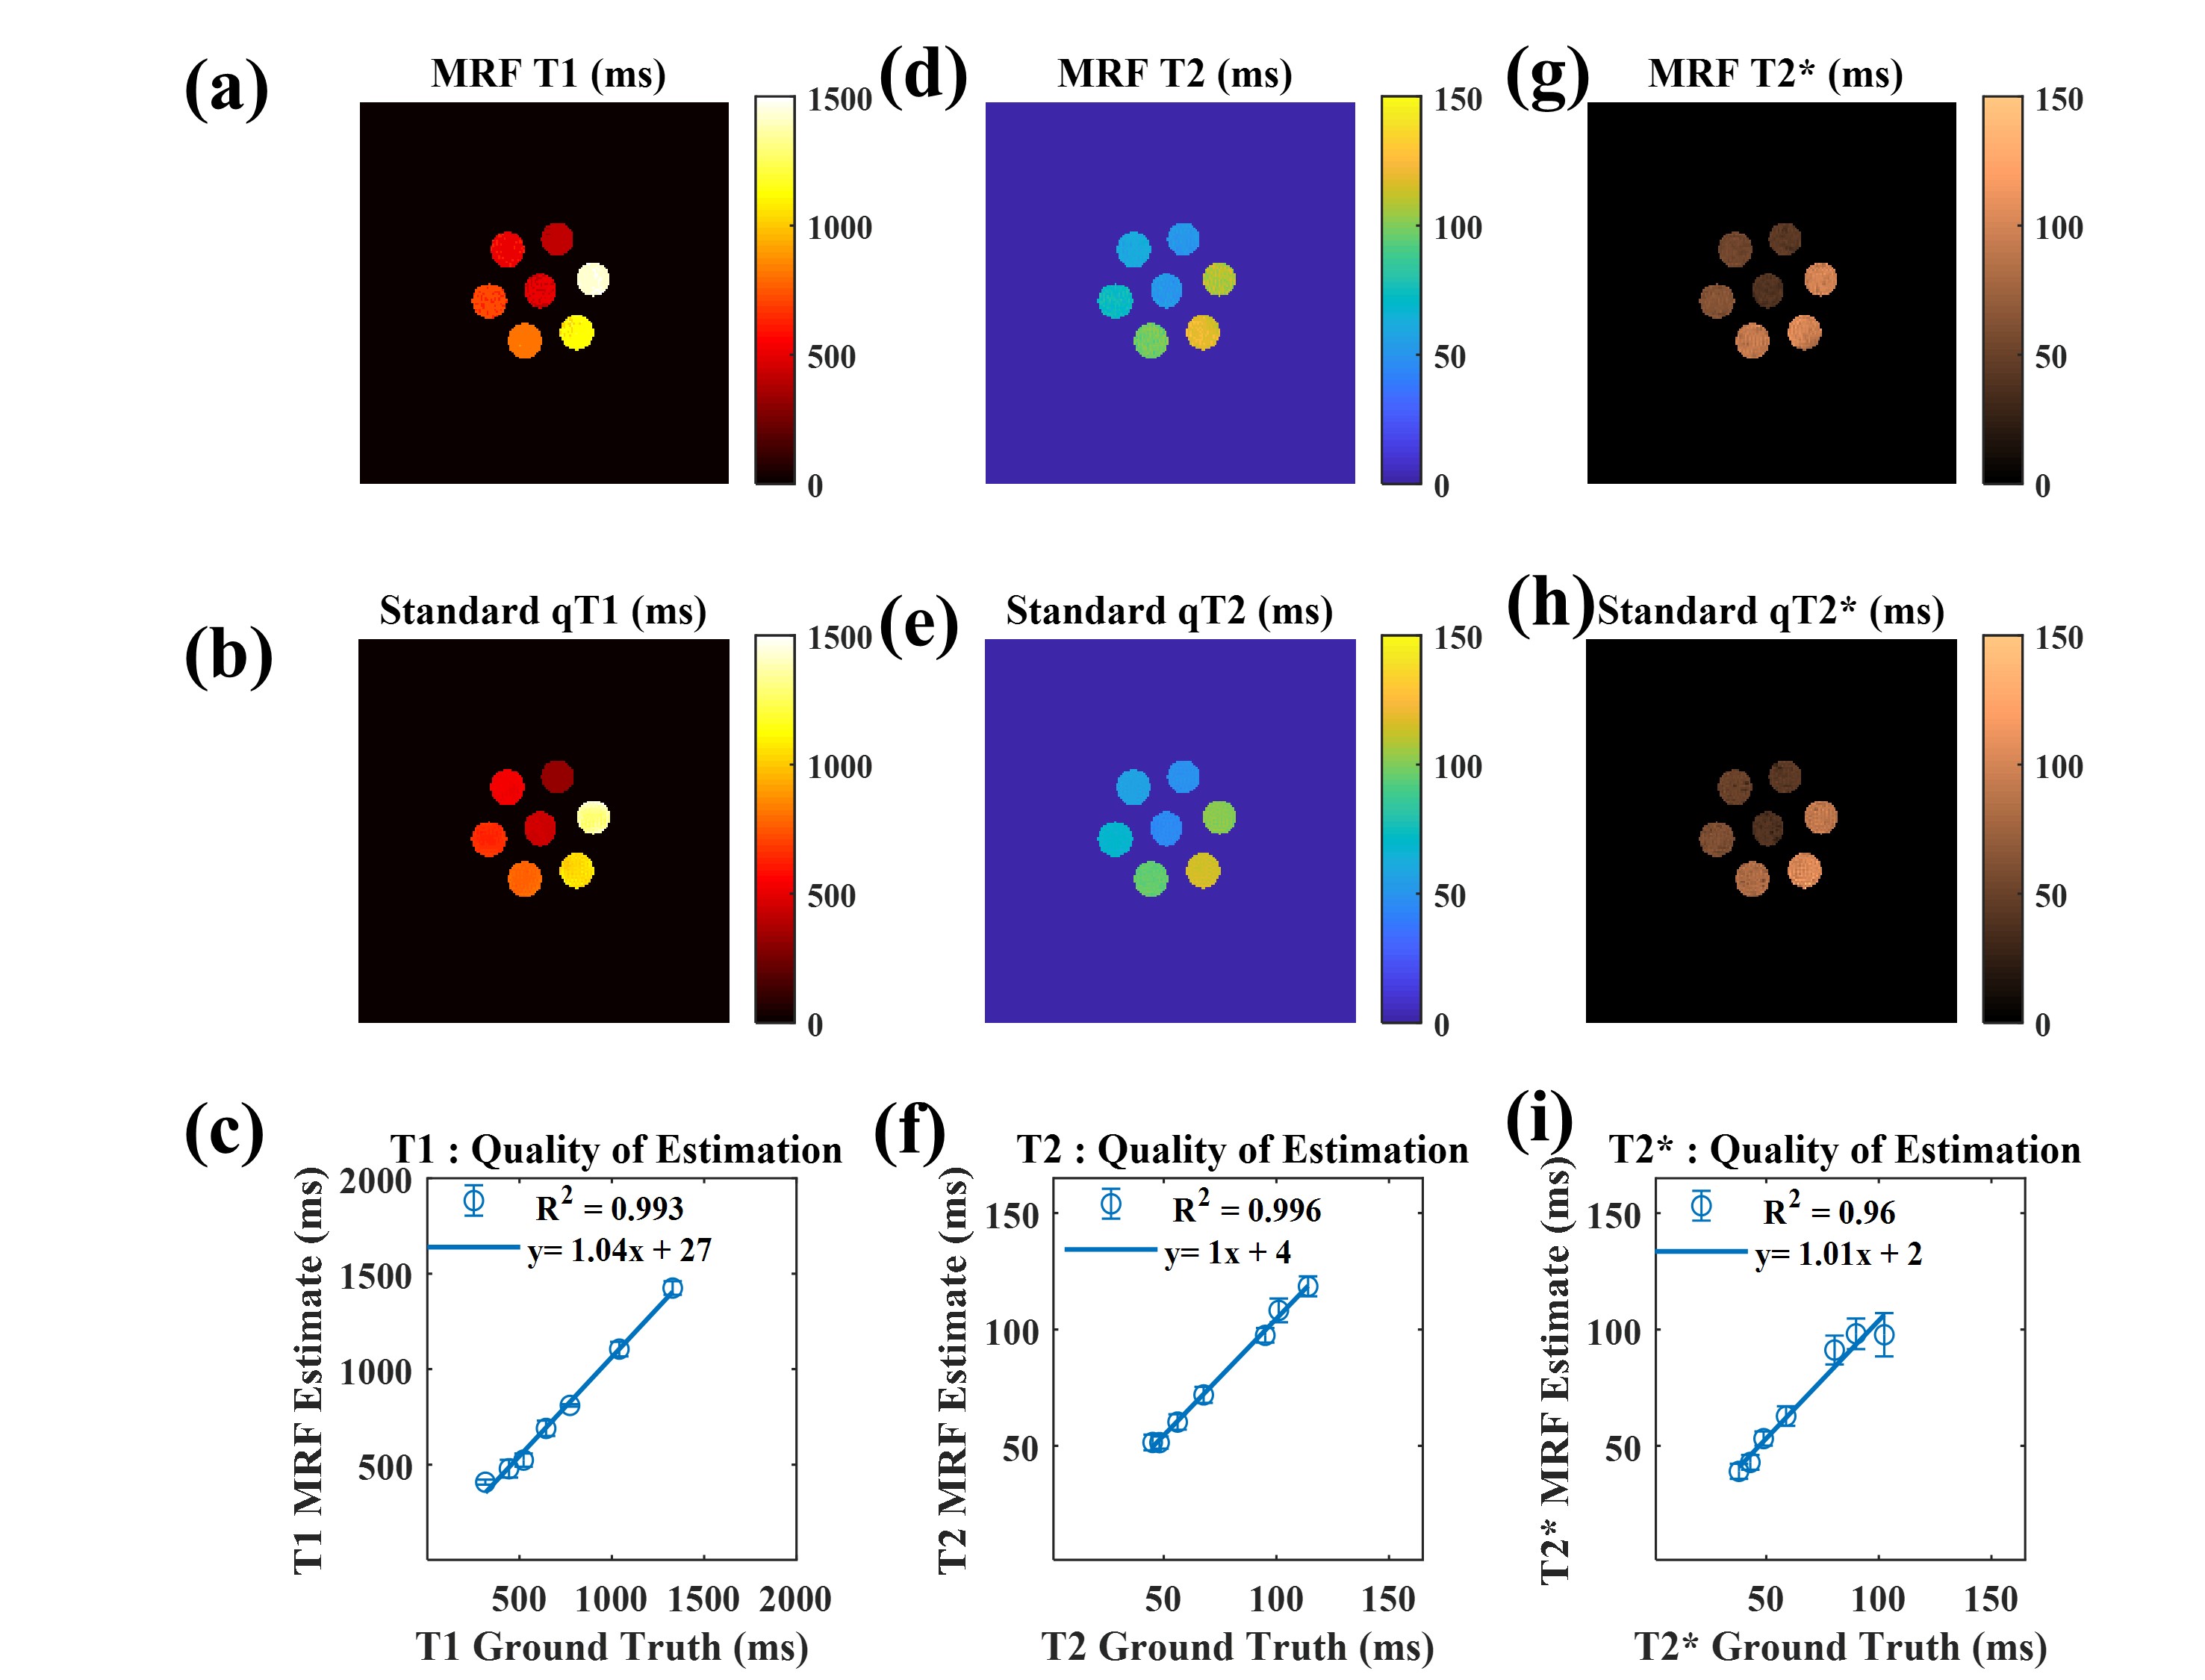
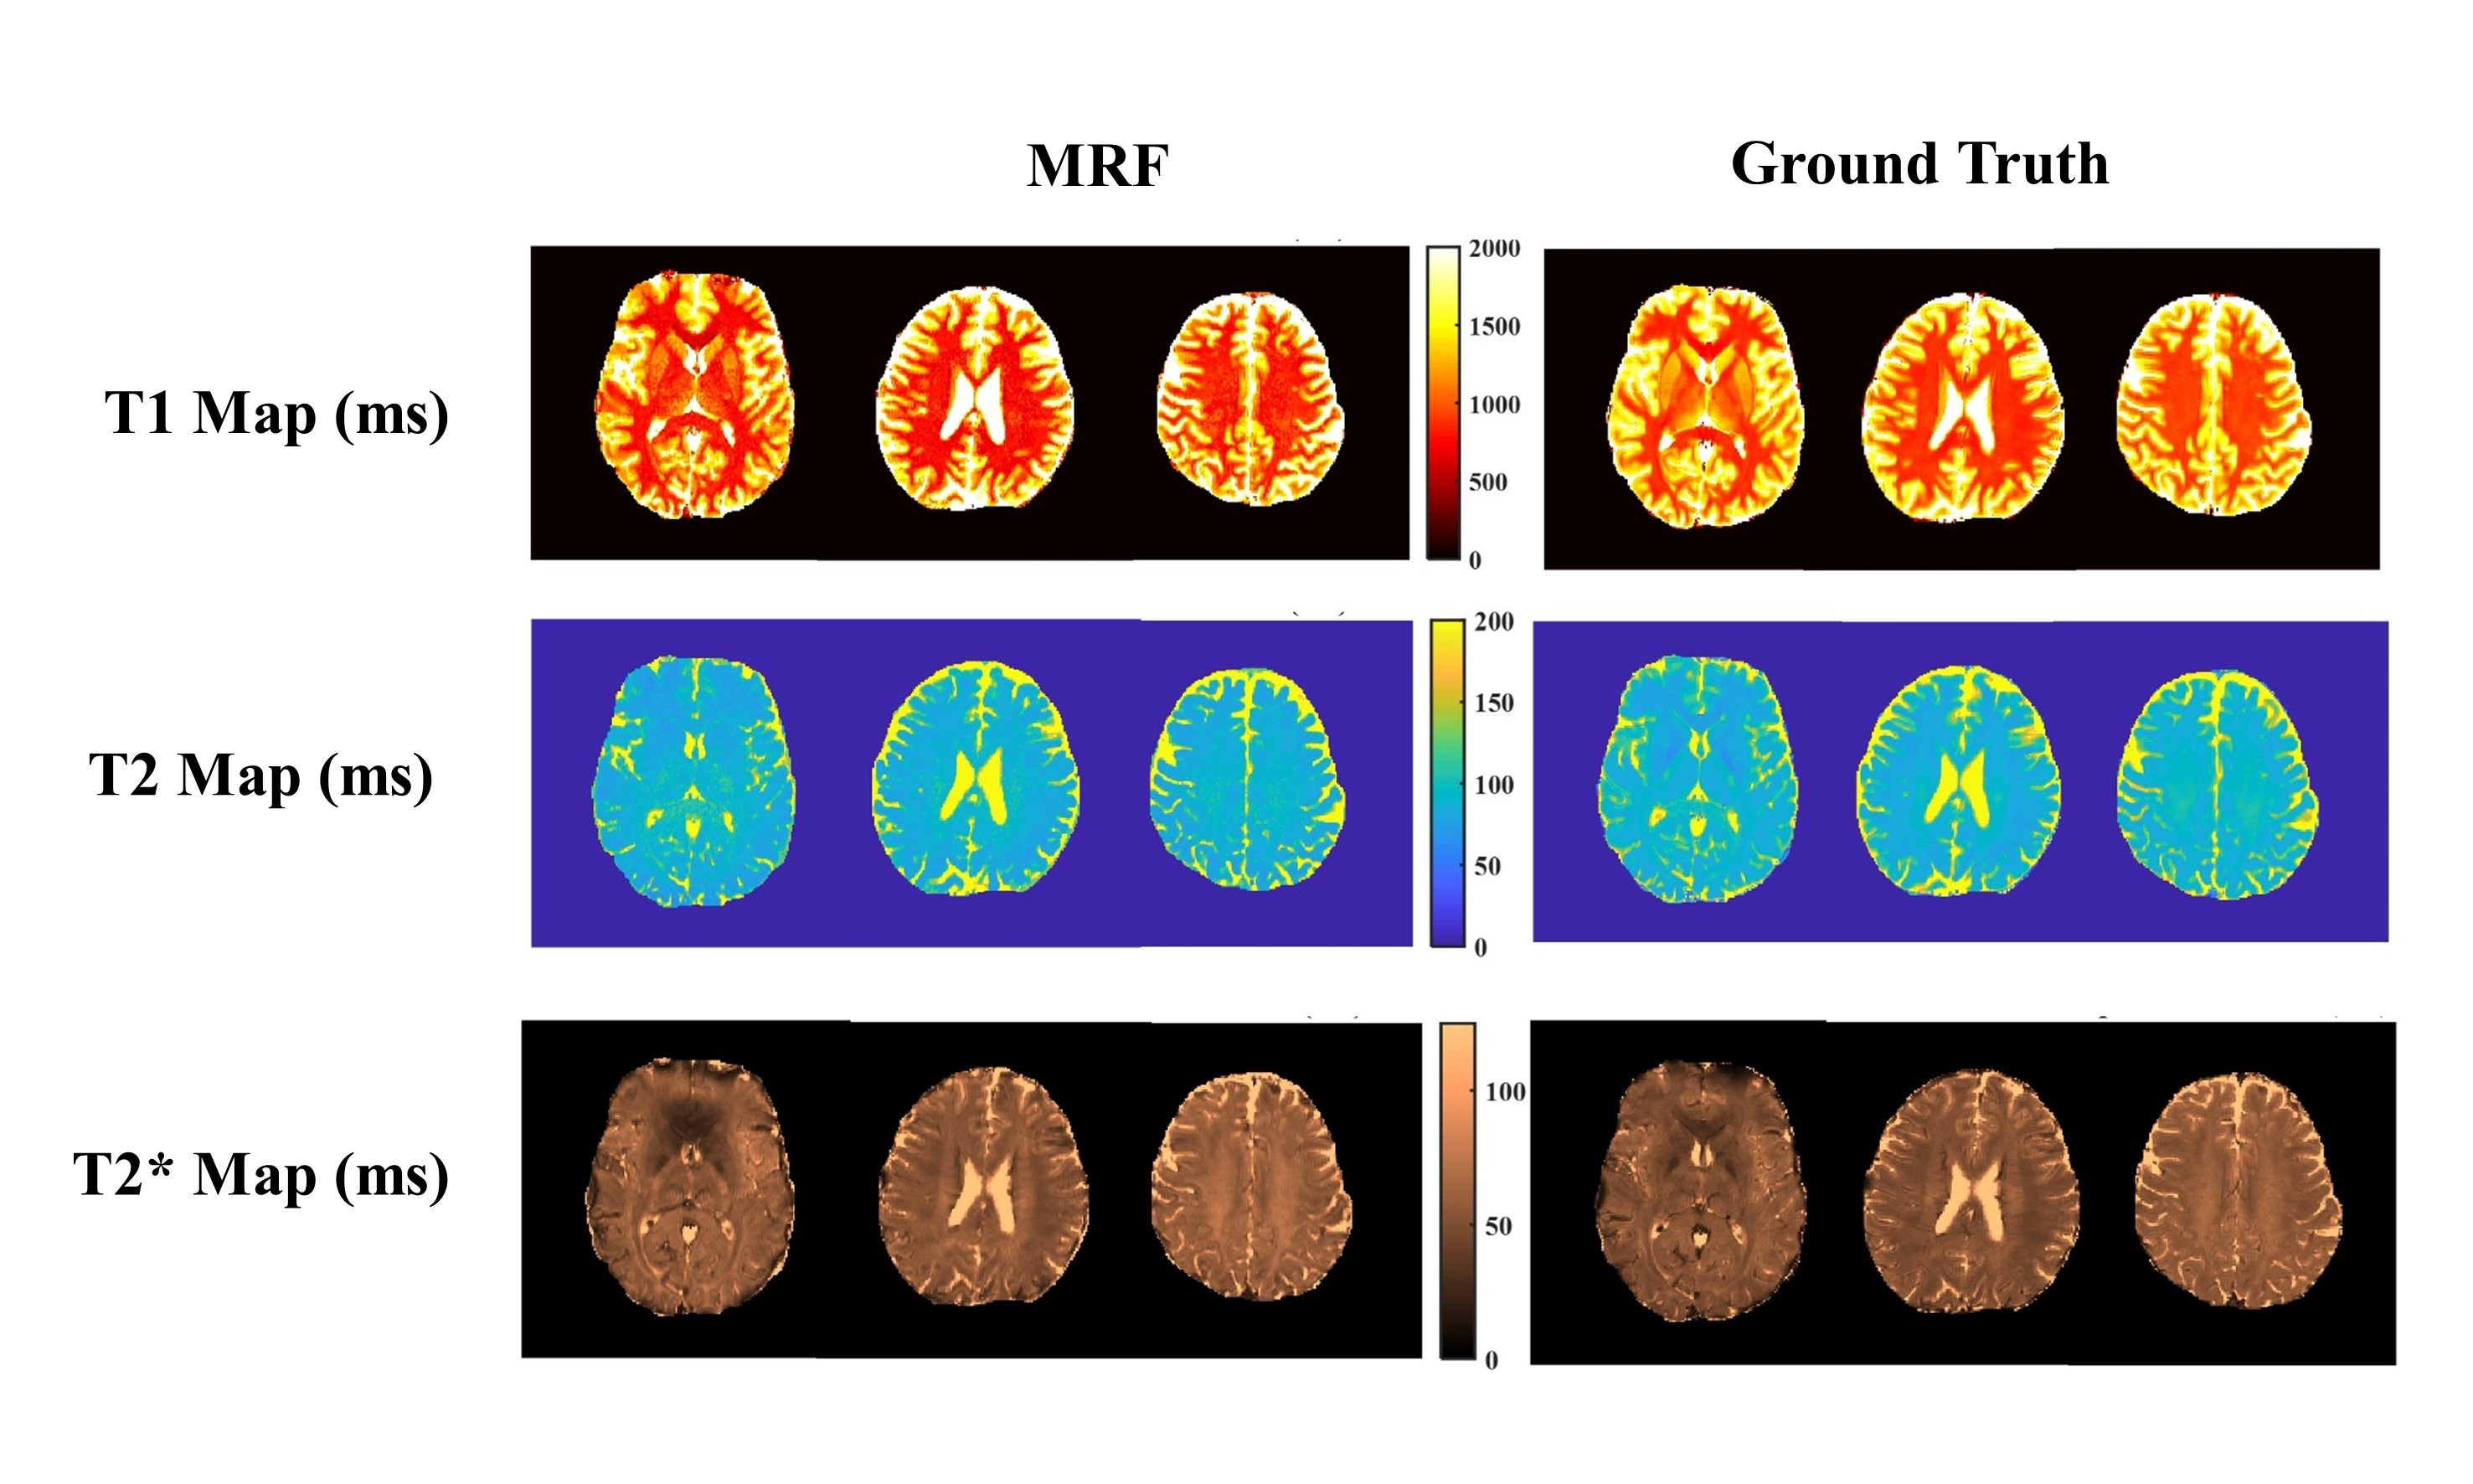
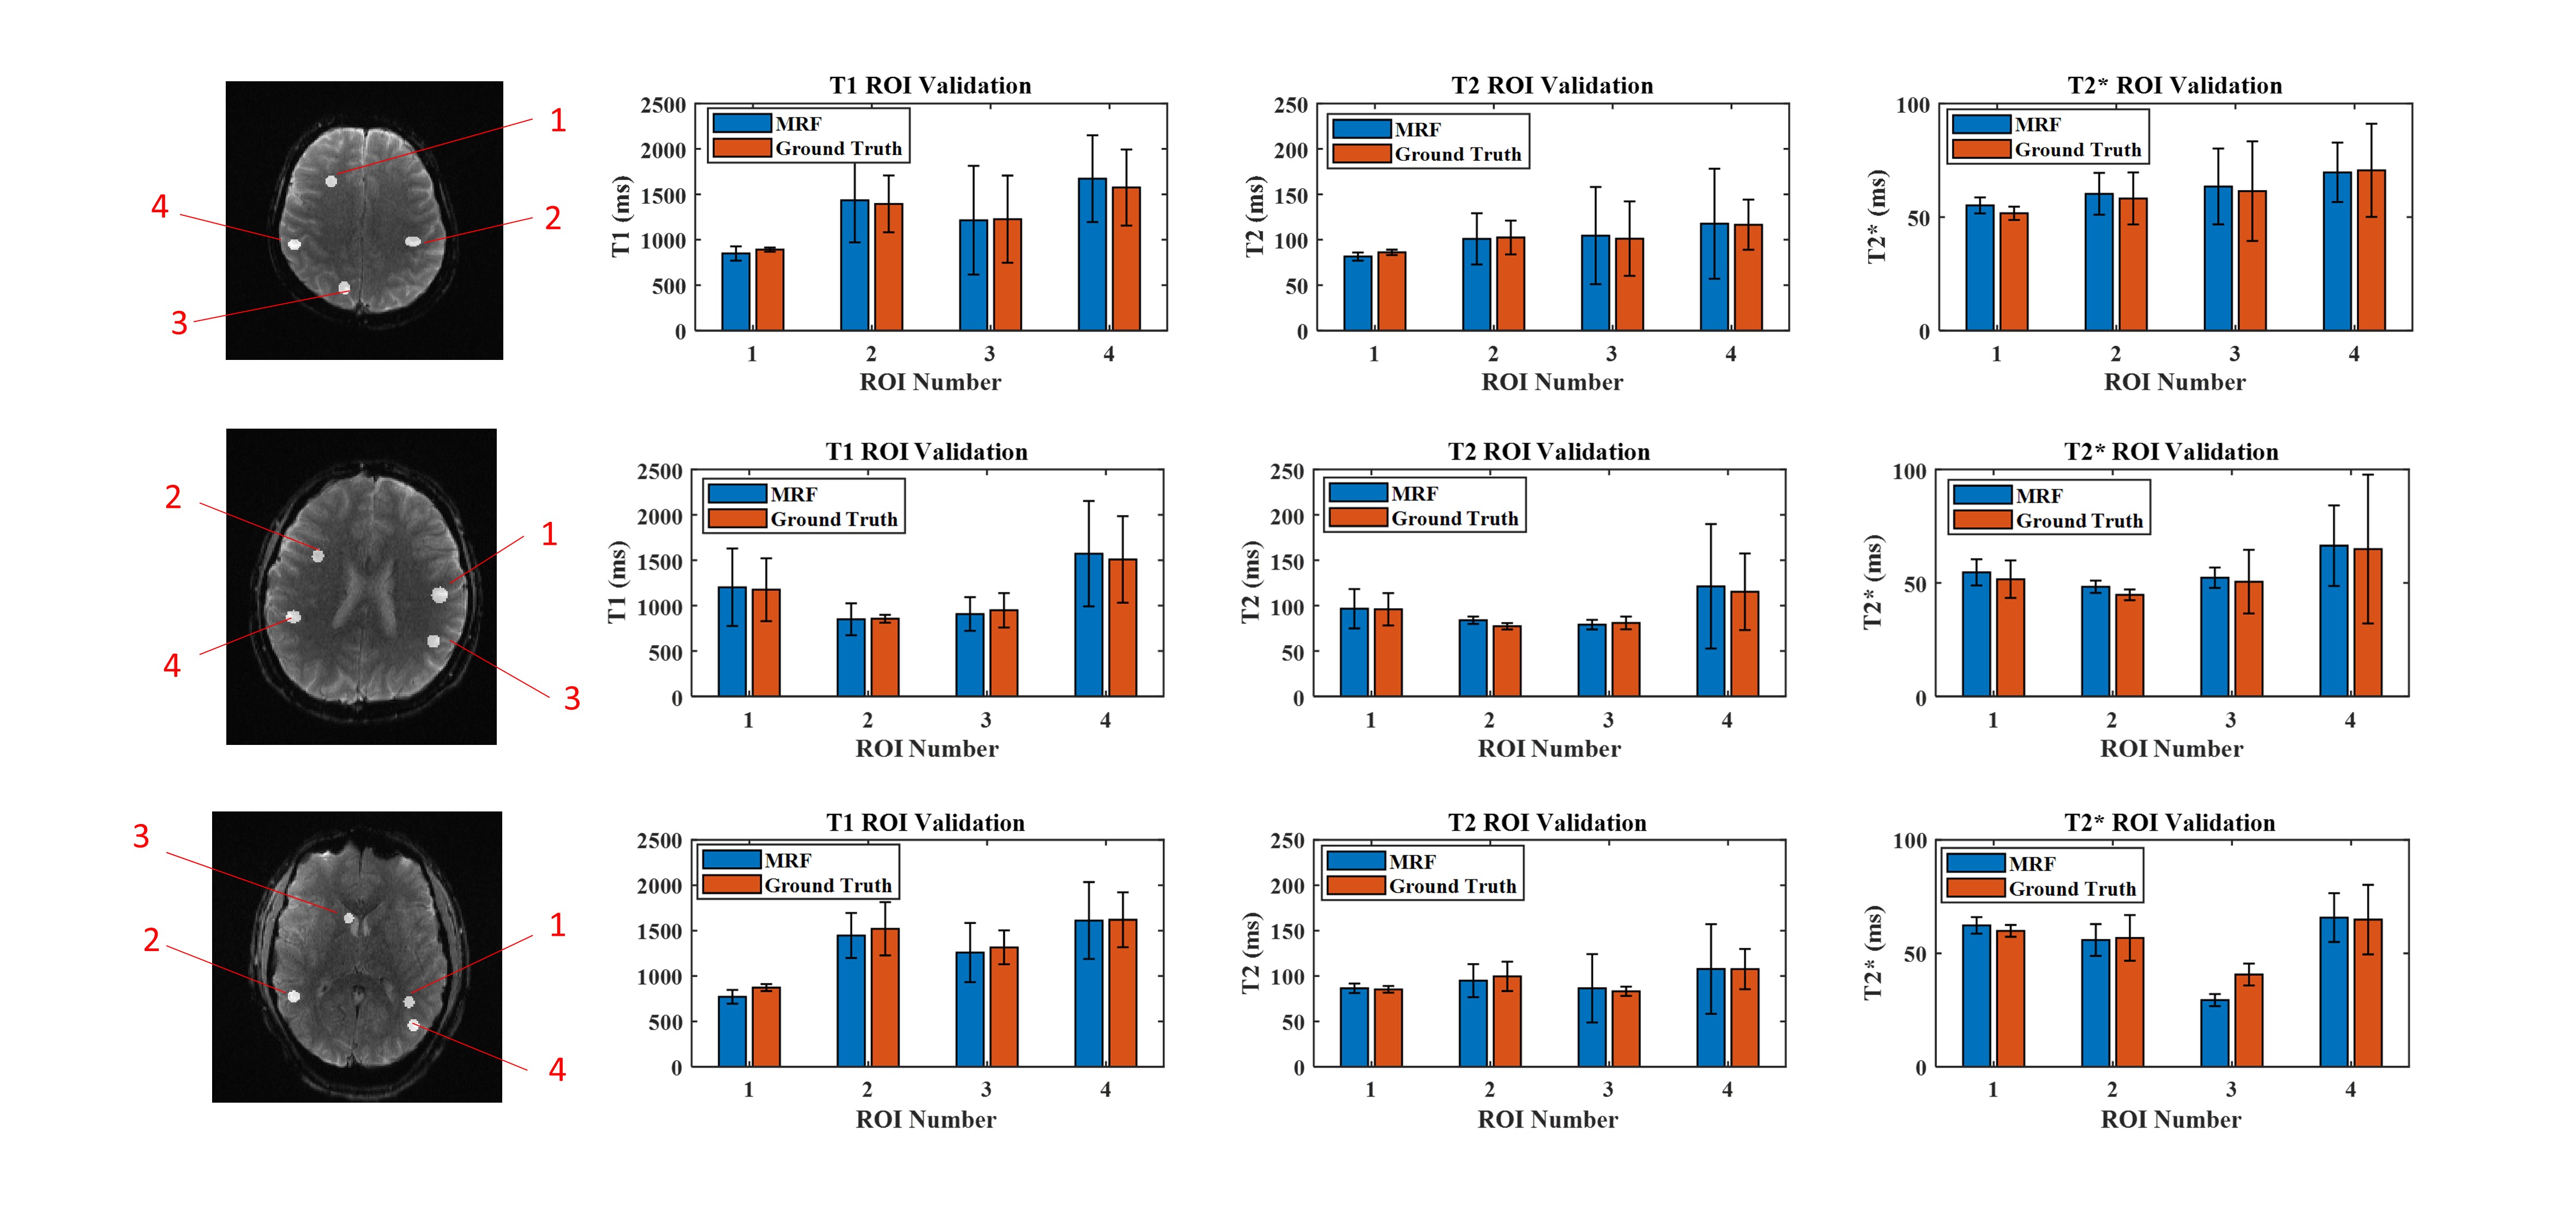
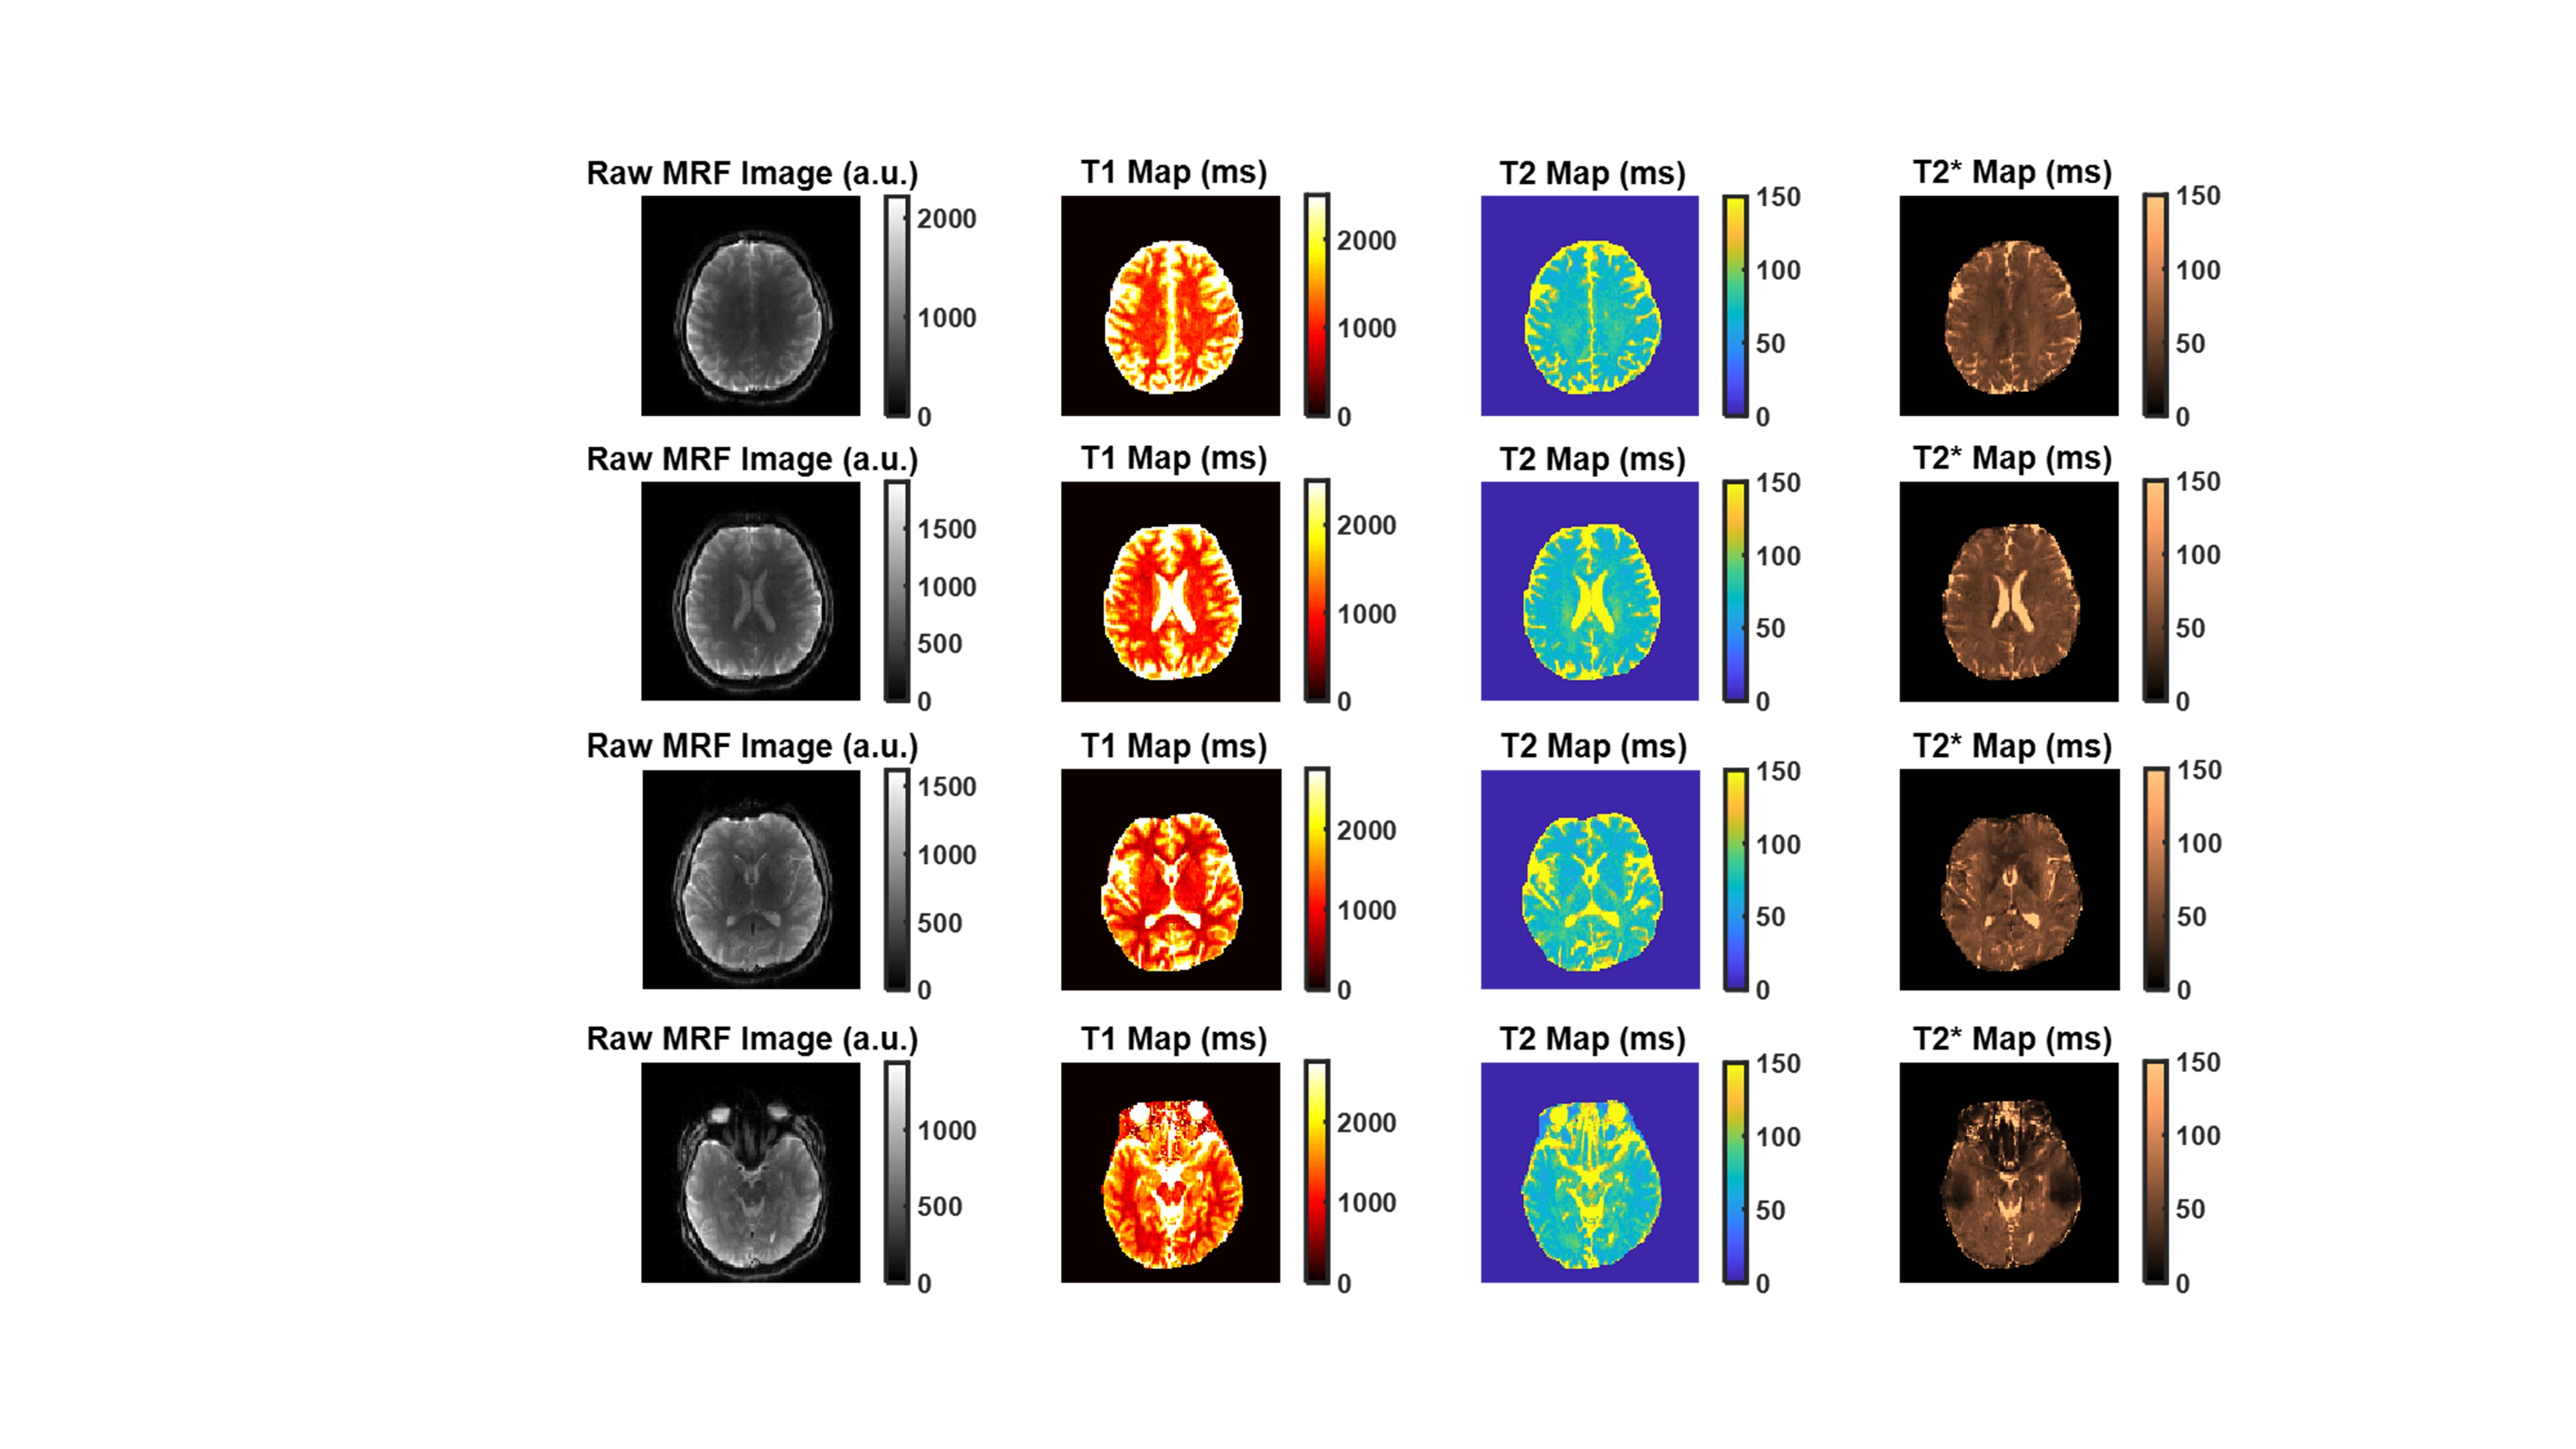
Fig 2 shows the phantom-validation results illustrating close agreement between our MRF approach (single band) and standard relaxometry techniques for estimating T1, T2 and T2* (r2>0.96 for all 3 contrasts). Likewise, Fig 3 shows the correspondence between the in-vivo scans and their respective validation scans. Overall, we observed excellent agreement in all cases. Some voxels with a high cerebrospinal fluid (CSF) content show a lower level of agreement, possibly due to the very long longitudinal relaxation time of CSF and the effect of pulsatile flow. Fig 4 shows quantitative results obtained in cortical and subcortical grey-matter and white-matter regions of interest (ROIs). Fig 5 shows the results obtained from the SMS scan from a representative subject with whole head coverage.Discussions and Conclusion
In this work, we added T2 quantification to the previously proposed EPI-based MRF technique. Our dual-stage technique is capable of providing whole-brain coverage with 1.7x1.7x3 mm3 resolution in less than 3 minutes for T1/T2/T2* estimation. Excellent agreement was found with standard relaxometry methods. Notably, the accuracy of T2 estimates was high despite our use of EPI. This was made possible by (1) the efficient use of the T1/B1 information from the GE stage; (2) the refocusing pulse in the second stage; and (3) the use of parallel imaging and partial Fourier sampling to render T2* effects negligible.Our method simply uses online EPI reconstruction that is widely available on clinical scanners. Additionally, as our images are nearly artifact-free, merely 280 frames were sufficient for estimating all 3 parameters, decreasing the dictionary size and memory requirements and accelerating data reconstruction. Finally, while here we present whole-brain images in the SMS version with 1.7x1.7x3 mm3 voxels, we can trade off speed for higher resolution.
Acknowledgements
The authors are grateful to Drs. David Norris and Peter Koopmans for their helpful comments about the SMS implementation of this work. We also thank the Canadian Institutes for Health Research (CIHR) for funding support.References
1. Ma D, Gulani V, Seiberlich N, et al. Magnetic resonance fingerprinting. Nature 2013;495:187–192.
2. Poorman ME, Martin MN, Ma D, et al. Magnetic resonance fingerprinting Part 1: Potential uses, current challenges, and recommendations. J. Magn. Reson. Imaging 2019 doi: 10.1002/jmri.26836.
3. Wyatt CR, Smith TB, Sammi MK, Rooney WD, Guimaraes AR. Multi-parametric T2 * magnetic resonance fingerprinting using variable echo times. NMR Biomed. 2018;31:e3951.
4. Hong T, Han D, Kim D-H. Simultaneous estimation of PD, T1 , T2 , T2* , and ∆B0 using magnetic resonance fingerprinting with background gradient compensation. Magn. Reson. Med. 2018 doi: 10.1002/mrm.27556.
5. Wang CY, Coppo S, Mehta BB, Seiberlich N, Yu X, Griswold MA. Magnetic resonance fingerprinting with quadratic RF phase for measurement of T2* simultaneously with, T1, and T2. Magn. Reson. Med. 2018.
6. Rieger B, Zimmer F, Zapp J, Weingärtner S, Schad LR. Magnetic resonance fingerprinting using echo-planar imaging: Joint quantification of T1 and relaxation times. Magn. Reson. Med. 2017;78:1724–1733.
7. Rieger B, Akçakaya M, Pariente JC, et al. Time efficient whole-brain coverage with MR Fingerprinting using slice-interleaved echo-planar-imaging. Sci. Rep. 2018;8:6667.
8. Setsompop K, Gagoski BA, Polimeni JR, Witzel T, Wedeen VJ, Wald LL. Blipped-controlled aliasing in parallel imaging for simultaneous multislice echo planar imaging with reduced g-factor penalty. Magn. Reson. Med. 2012;67:1210–1224.
Figures