3730
A multi echo pulse sequence with optimized excitation pulses and a 3D cone readout for hyperpolarized 13C imaging1Cancer Research UK Cambridge Institute, Cambridge, United Kingdom, 2Department of Radiology, University of Cambridge, Cambridge, United Kingdom, 3Department of Biochemistry, University of Cambridge, Cambridge, United Kingdom
Synopsis
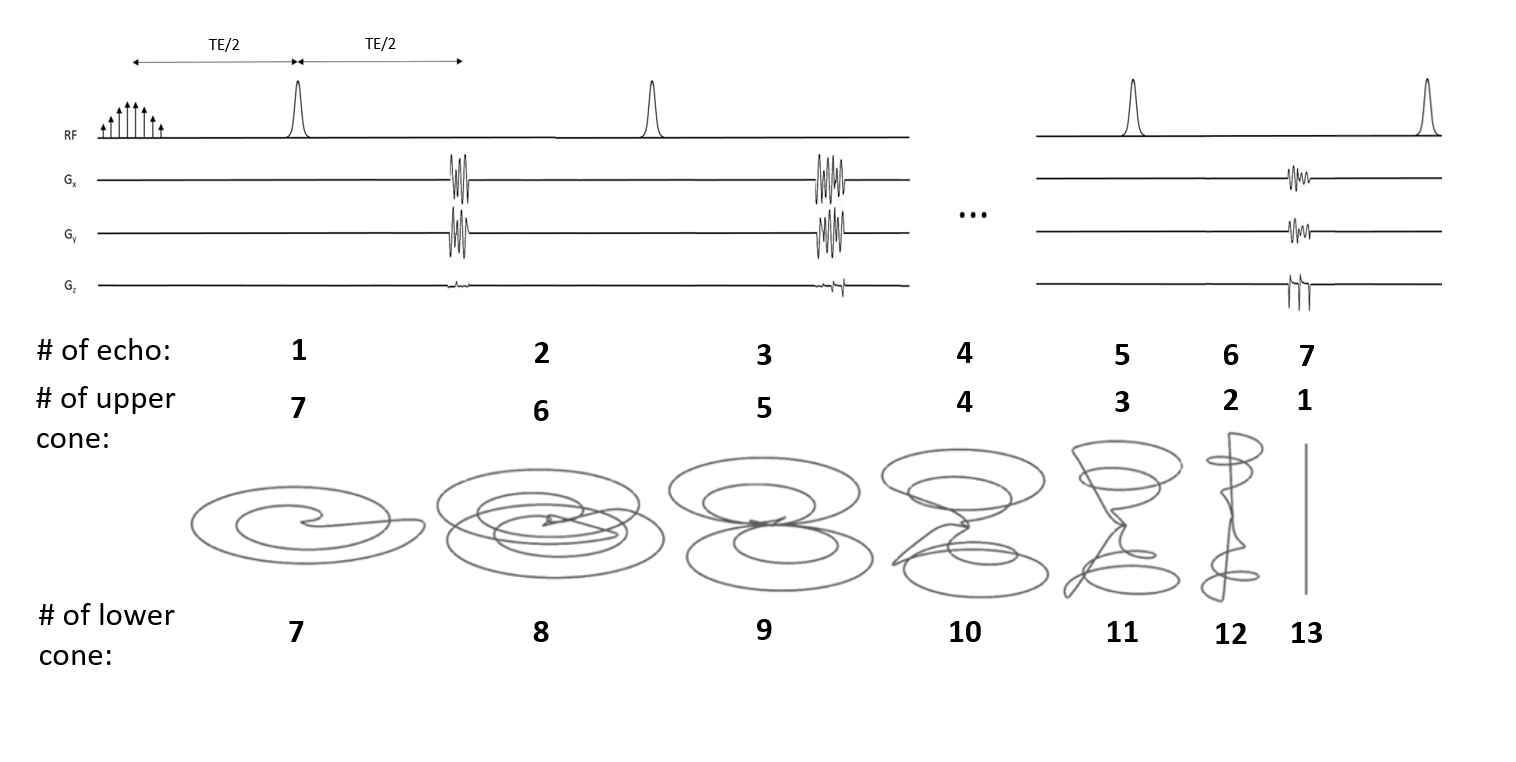
We describe here a single shot multi echo sequence for dynamic hyperpolarized 13C imaging with a short readout time, isotropic point spread function (PSF) and high immunity to B0 and B1 field inhomogeneity. The sequence uses numerically optimized excitation pulses and a 3D cone k-space trajectory composed of 13 cones, all fully refocused and distributed among 7 spin echoes. The maximal gradient amplitude and slew-rate were set to 4 G/cm and 20 G/cm/ms respectively to demonstrate the feasibility of clinical translation. The sequence was demonstrated with dynamic imaging of hyperpolarized [1-13pyruvate] and [1-13C]lactate in vivo.
Introduction
Imaging tumor metabolism in vivo using hyperpolarized [1-13C]pyruvate is a promising technique for detecting disease, disease progression and assessing treatment response1,2. However, the transient nature of the hyperpolarization and its depletion following excitation limits the available time for imaging3,4. We describe here a single shot multi echo sequence, which improves on previously reported sequences, with a shorter readout time, isotropic point spread function (PSF) and field of view (FOV) and better signal-to-noise ratio (SNR).Methods
The sequence uses numerically optimized spectrally selective pulses set to the resonant frequencies of pyruvate and lactate and hyperbolic secant adiabatic refocusing pulses with a bandwidth of 8kHz, all applied in the absence of a slice selection gradient. The lack of slice selection was possible because of the isotropic FOV and the localized sensitivity profile of the receiver coil. The excitation pulses were designed to be resistant to the effects of B0 and B1 field inhomogeneity. The cost function of the optimization consisted of four regions of interest, which were ±70Hz of the lactate, pyruvate hydrate and alanine resonances. Since pyruvate travels initially as a bolus throughout the body of the animals its signal can be far off-resonance. Therefore, for pyruvate the region of interest was ±200Hz. The pulses were designed to give constant phase in the pass-band right after the pulse in order to increase signal in the presence of large B0 and B1 field inhomogeneity and minimize the achievable echo time. The readout gradient used a 78.612 ms long 3D cone trajectory composed of 13 cones (based on 5), all fully refocused and distributed among 7 spin echoes (Figure 1) to fully exploit the long T2 relaxation time of the 13C nuclei. The minimal repetition time was 165 ms. The maximal gradient amplitude and slew-rate were set to 4 G/cm and 20 G/cm/ms respectively to demonstrate the feasibility of clinical translation. Experiments were performed at 7T (Agilent, Palo Alto, CA). A 42 mm diameter birdcage volume coil was used for 1H transmit and receive and a similar volume coil for 13C transmit. A 20 mm diameter surface coil was used for 13C receive (Rapid Biomedical GMBH, Rimpar, Germany).Results
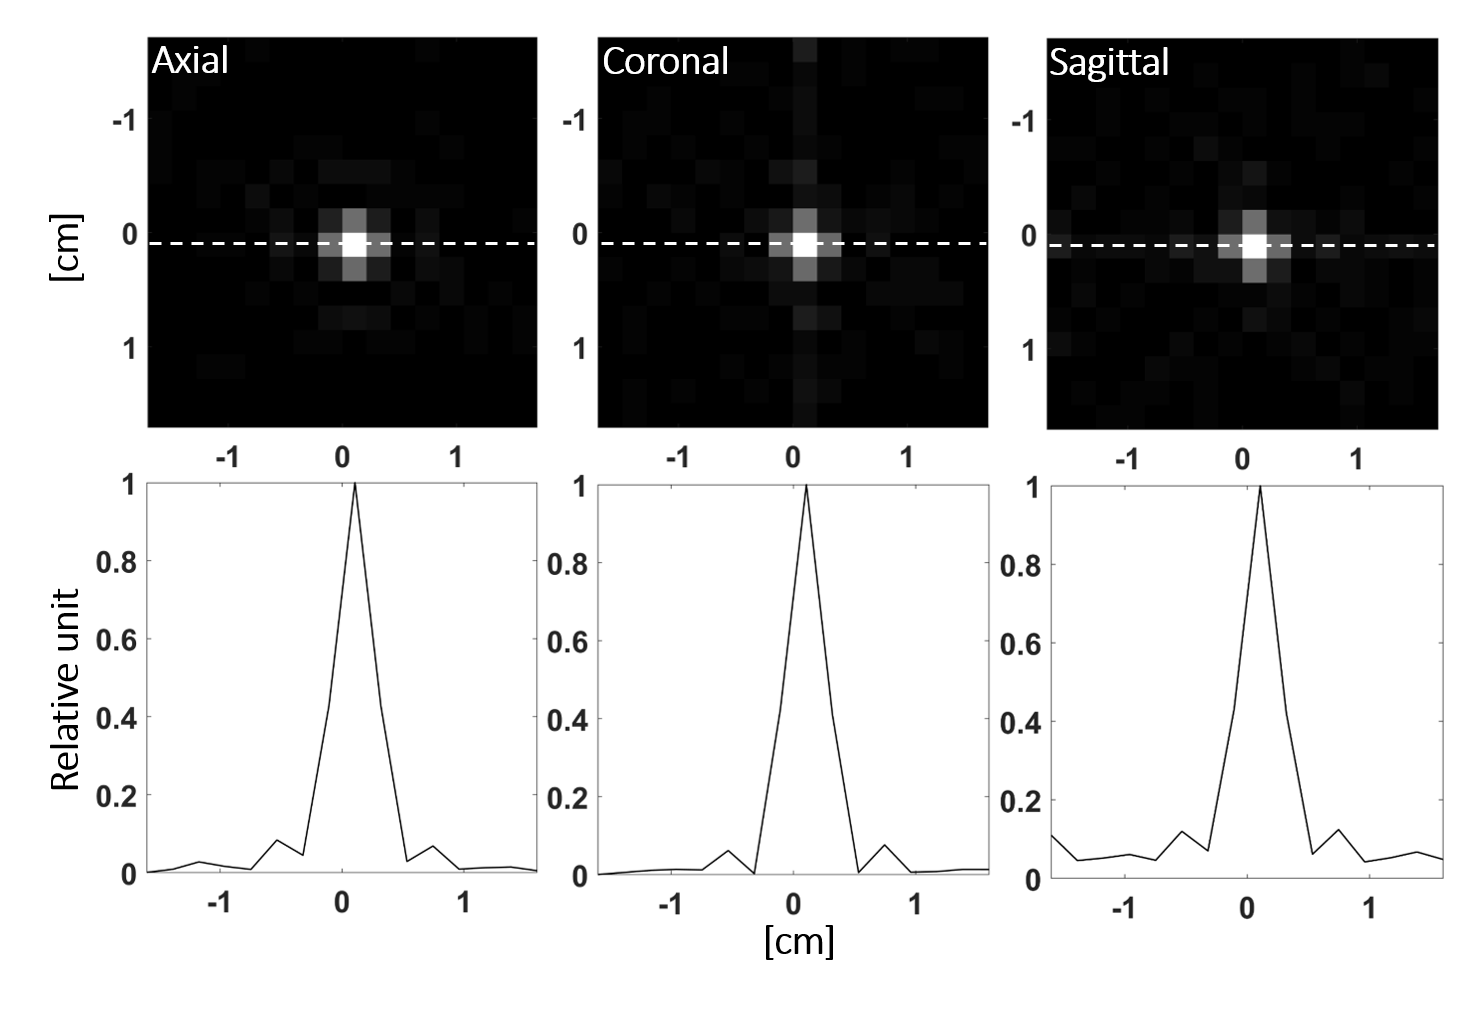
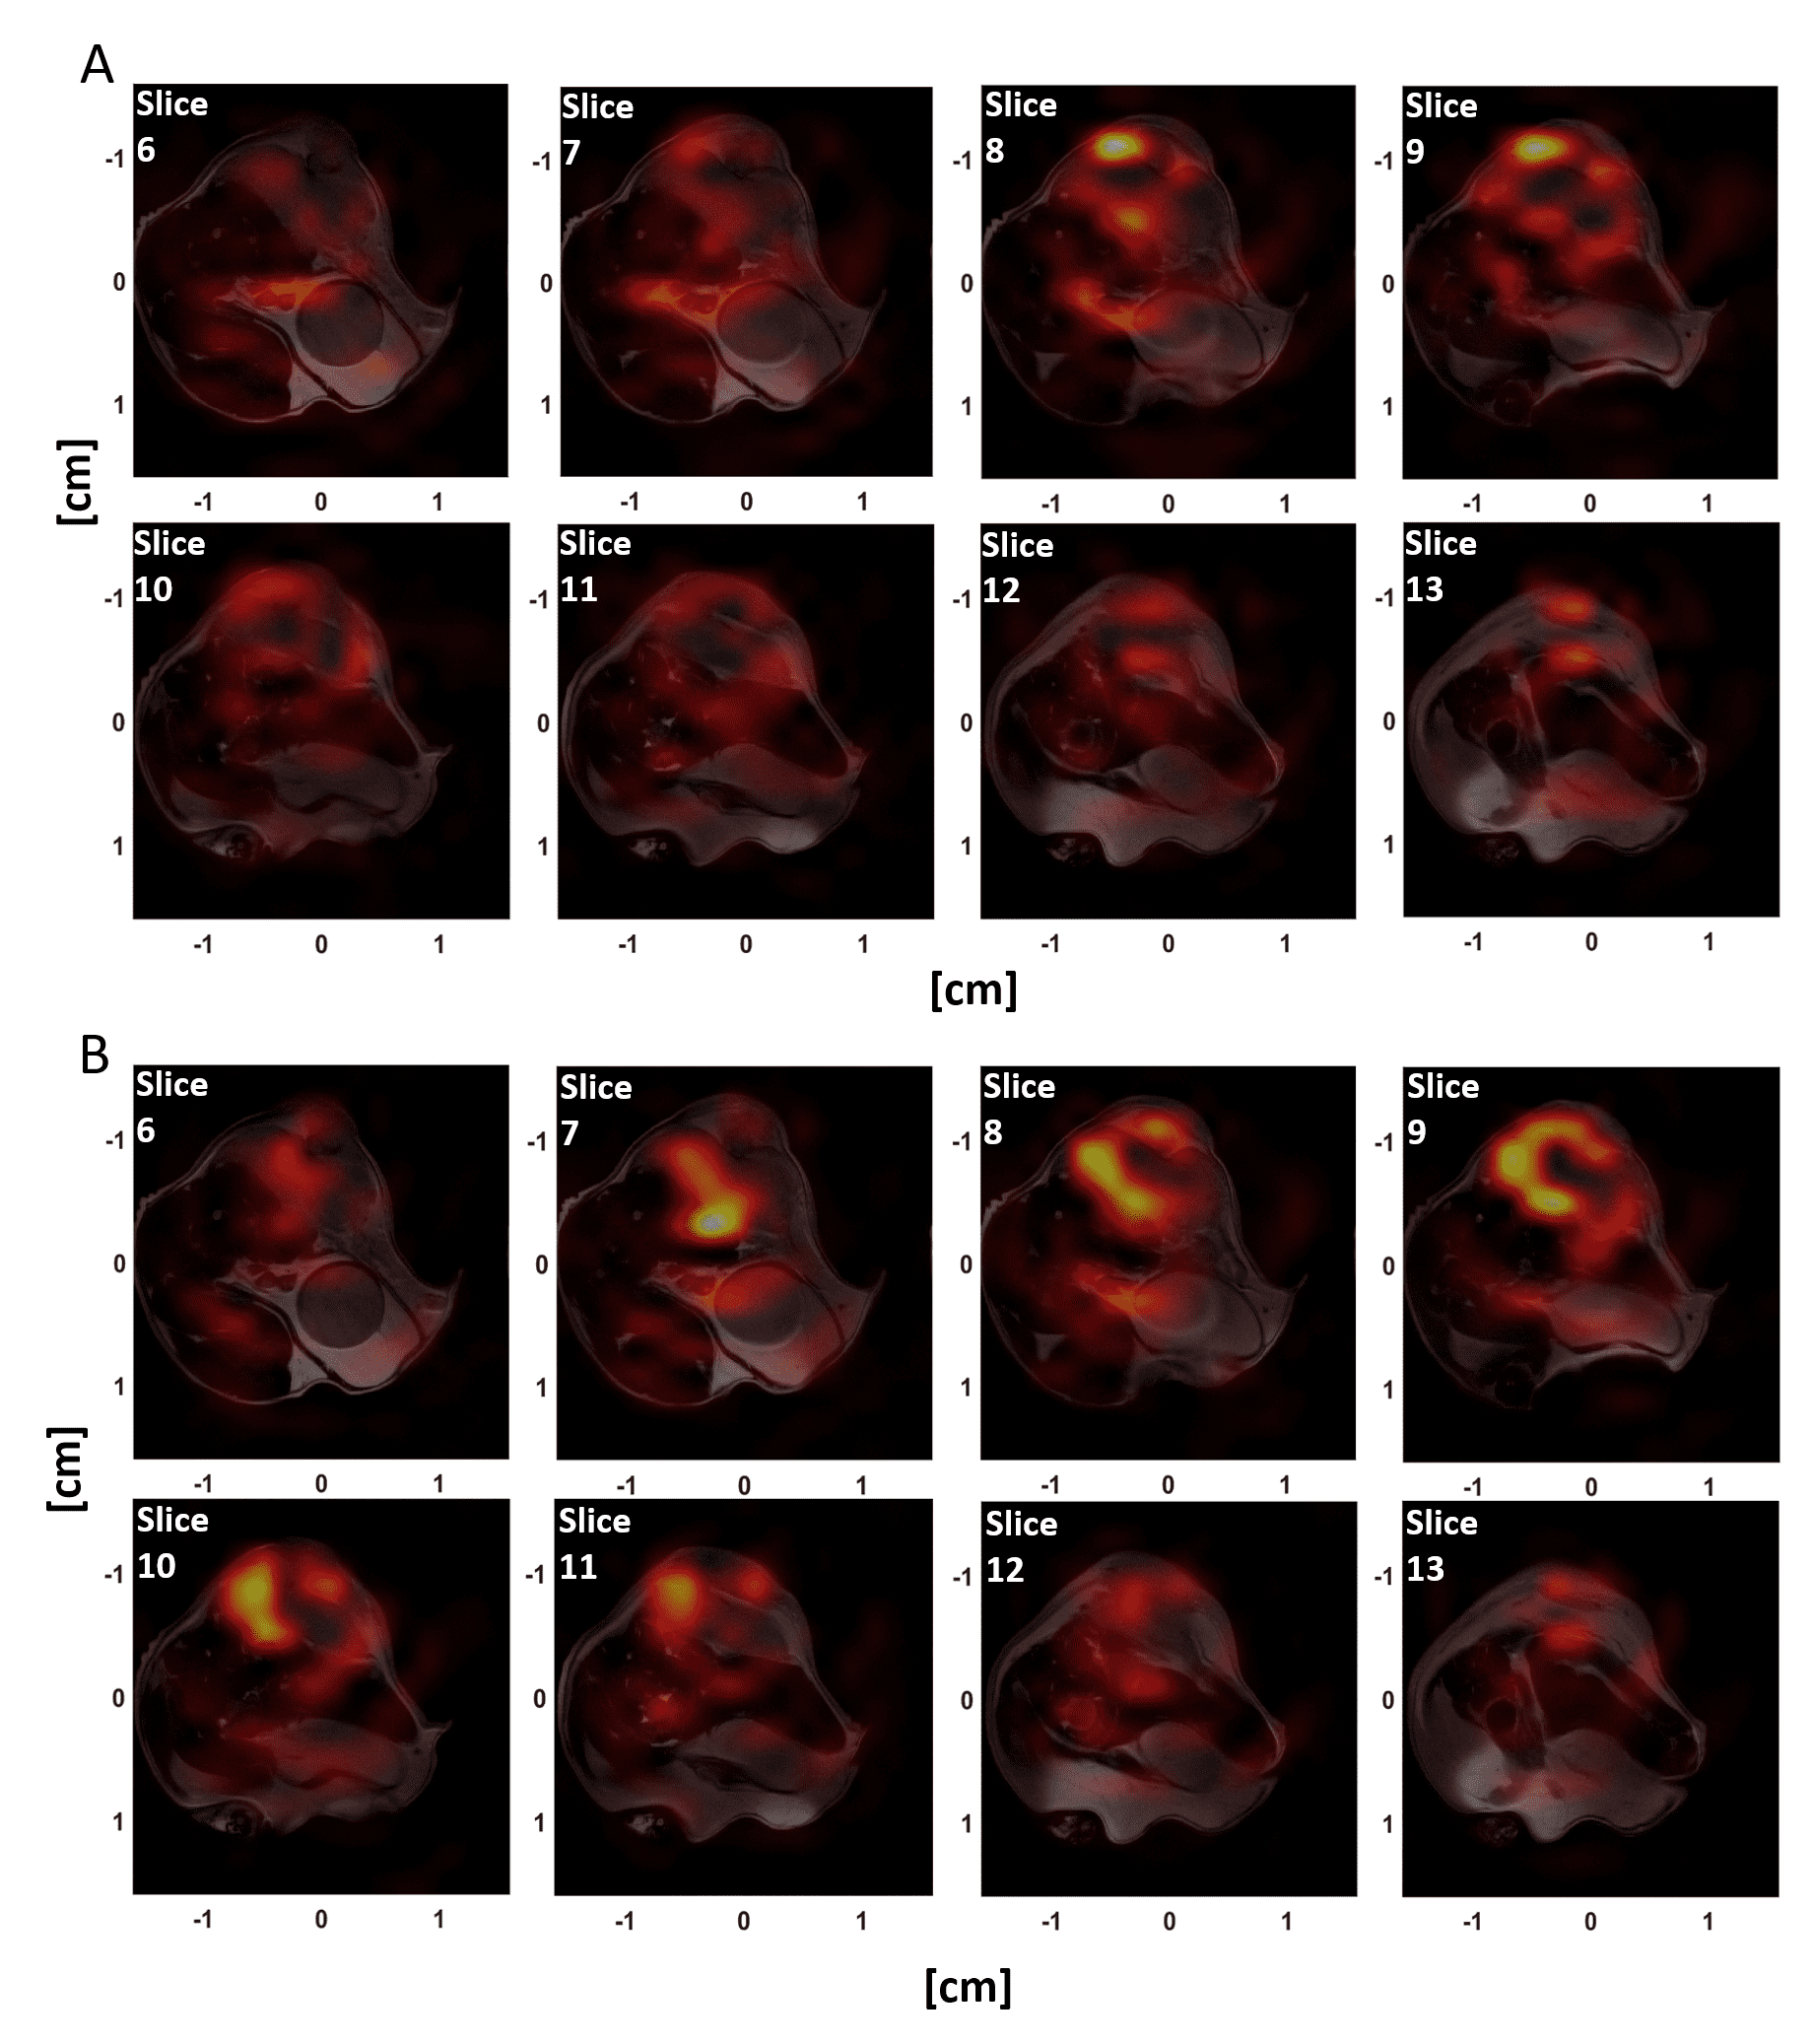
The pulse sequence had an isotropic FOV of 32 mm and a nominal resolution of 2 mm and gave an isotropic PSF (Figure 2) of 2.8 mm when reconstructed at the 0.125 mm in-slice resolution of the anatomical reference 1H image. The excitation profiles of the optimized pulses closely matched the simulations and an approximately 20-50% gain in SNR was observed when compared to a conventional Shinnar–Le Roux pulse. Figure 3 summarizes the properties of the lactate pulse (a similar pulse was designed for pyruvate excitation). The optimized spectral profile showed a high degree of selectivity and would result in low level signal cross-contamination. Furthermore, the large phase variation in the pyruvate (which is present in higher concentration than lactate and is primarily responsible for cross-contamination artefacts) spectral region of interest helps to cancel unwanted off-resonance pyruvate signal. The sequence was demonstrated with dynamic imaging of hyperpolarized [1-13C] pyruvate and [1-13C]lactate and produced images similar to those obtained previously from this tumor model6-9 (Figure 4).Discussion and conclusions
The pulse sequence was capable of dynamic imaging of hyperpolarized 13C labelled metabolites with relatively high spatial and temporal resolution and robustness against system imperfections. The segmented k-space readout fully exploited the long T2 relaxation time. As a (Hermitian) symmetric pair of cones was acquired at each echo the sequence had an inherently high degree of flow compensation10 (the loss of polarization due to the long train of refocusing pulses was found to be negligible7). With a 32 cm FOV and 2 cm resolution, typical of a clinical scanner, the sequence would take only 29.133 ms, and therefore is expected to preserve the high degree of robustness to system imperfections.Acknowledgements
No acknowledgement found.References
1. Ardenkjaer JH, Fridlund B, Gram A et al. Increase in signal-to-noise ratio of >10,000 times in liquid state NMR. Proc Natl Acad Sci U S A 2003;100:10158–10163.
2. Brindle KM. Imaging metabolism with hyperpolarized 13C-labeled cell substrates. J Am Chem Soc 2015;137:6418–6427.
3. Brindle KM. Watching tumours gasp and die with MRI: the promise of hyperpolarized 13C MR spectroscopic imaging. Br J Radiol 2012;85: 697–708.
4. Day SE, Kettunen MI, Gallagher FA et al. Detecting tumor response to treatment using hyperpolarized 13C magnetic resonance imaging and spectroscopy. Nat Med 2007;13:1382–1387.
5. Gurney PT, Hargreaves BA and Nishimura DG. Design and analysis of a practical 3D cones trajectory. Magn. Reson. Med. 2006;55: 575-582.
6. Bedard PL, Hansen AR, Ratain MJ, Siu LL. Tumour heterogeneity in the clinic. Nature 2013;501:355–364.
7. Wang J, Hesketh RL, Wright AJ, Brindle KM. Hyperpolarized 13 C spectroscopic imaging using single-shot 3D sequences with unpaired adiabatic refocusing pulses. NMR Biomed. 2018;31(11):e4004.
8. Rodrigues TB, Serrao EM, Kennedy BW et al. Magnetic resonance imaging of tumor glycolysis using hyperpolarized 13C-labeled glucose. Nat Med. 2014;20(1):93–97. doi:10.1038/nm.3416.
9. Schmidt R, Laustsen C, Dumez JN et al. In vivo single-shot 13C spectroscopic imaging of hyperpolarized metabolites by spatiotemporal encoding. J Magn Reson 2014. doi: 10.1016/j.jmr.2013.12.013.
10. Irarrázaval P, Santos JM, Guarini M, Nishimura D. Flow properties of fast three-dimensional sequences for MR angiography. Magn Reson Imaging 1999. doi: 10.1016/S0730-725X(99)00083-1
Figures