3729
Single Point Imaging with Rapid Encoding (SPIRE) for MRI with Sub-millisecond Temporal Resolution1Dept. of Radiology, Medical Physics, Medical Center University of Freiburg, Faculty of Medicine, University of Freiburg, Freiburg, Germany
Synopsis
Single Point Imaging with Rapid Encoding (SPIRE) is a new imaging technique for measuring fast and repetitive motion. Here, the temporal resolution does not depend on TR but on the duration of the fast-switching phase encoding gradients. We show the abilities of SPIRE by imaging the falling of water drops and reconstruct the images using self-gating. The obtained image data has a temporal resolution below 0.5 ms and the drops oscillations frequency is measured. The good agreement with predictions shows the accuracy and possibilities of this technique.
Introduction
In MRI motion artifacts are seen if subject motion is faster than the often slow signal encoding. In human subjects typical motion frequencies range from very slow breathing movement (0.2-0.4 Hz) over heartbeat (1-3 Hz) to very fast oscillations as for example in the vocal folds (100-1500 Hz) or the aortic heart valve. Recently, the in-plane oscillation motion of the vocal folds could be resolved with sub-millisecond temporal resolution using time-optimized phase encoding gradients1. As this technique can only be applied in one direction, complex 2D motion patterns cannot be identified. In this work we propose a single point imaging method with rapid encoding (SPIRE) for acquiring 2D stroboscopic images with ultra-high temporal resolution. The sequence is tested in a phantom setup with a falling water drop, and the resultant dynamic images are analyzed to determine the droplet oscillation frequency.Materials & Methods
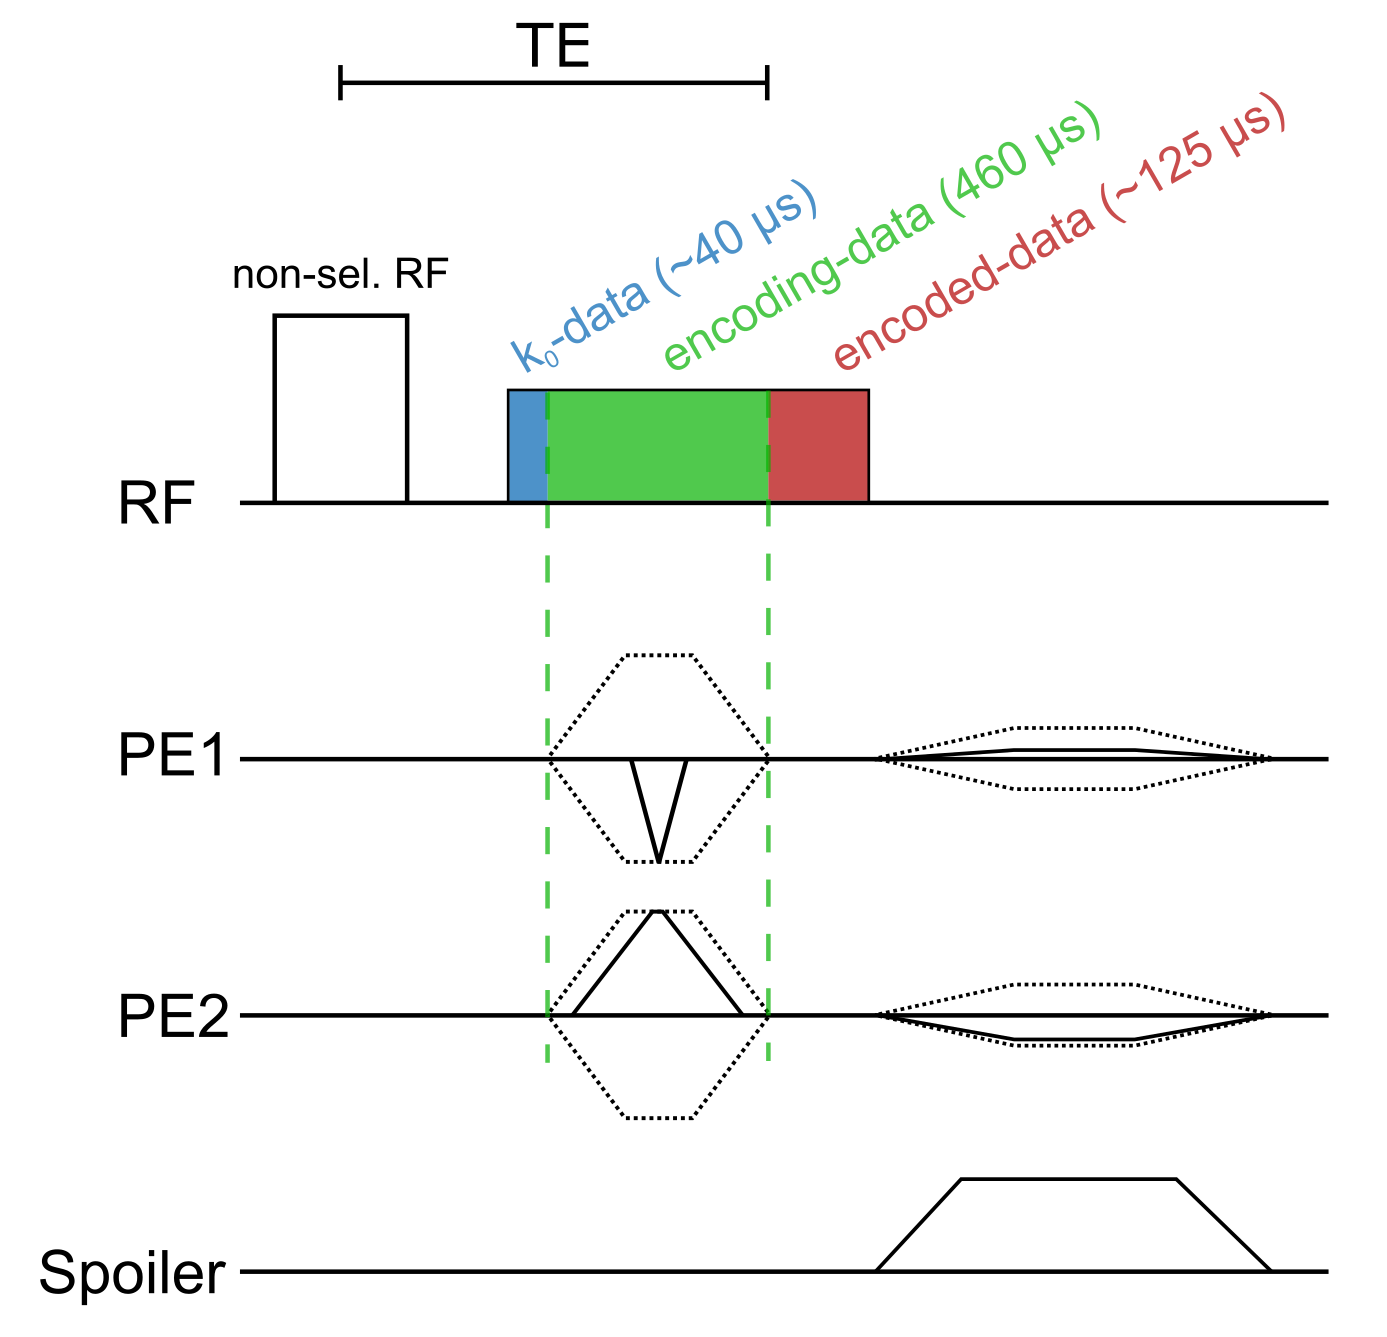
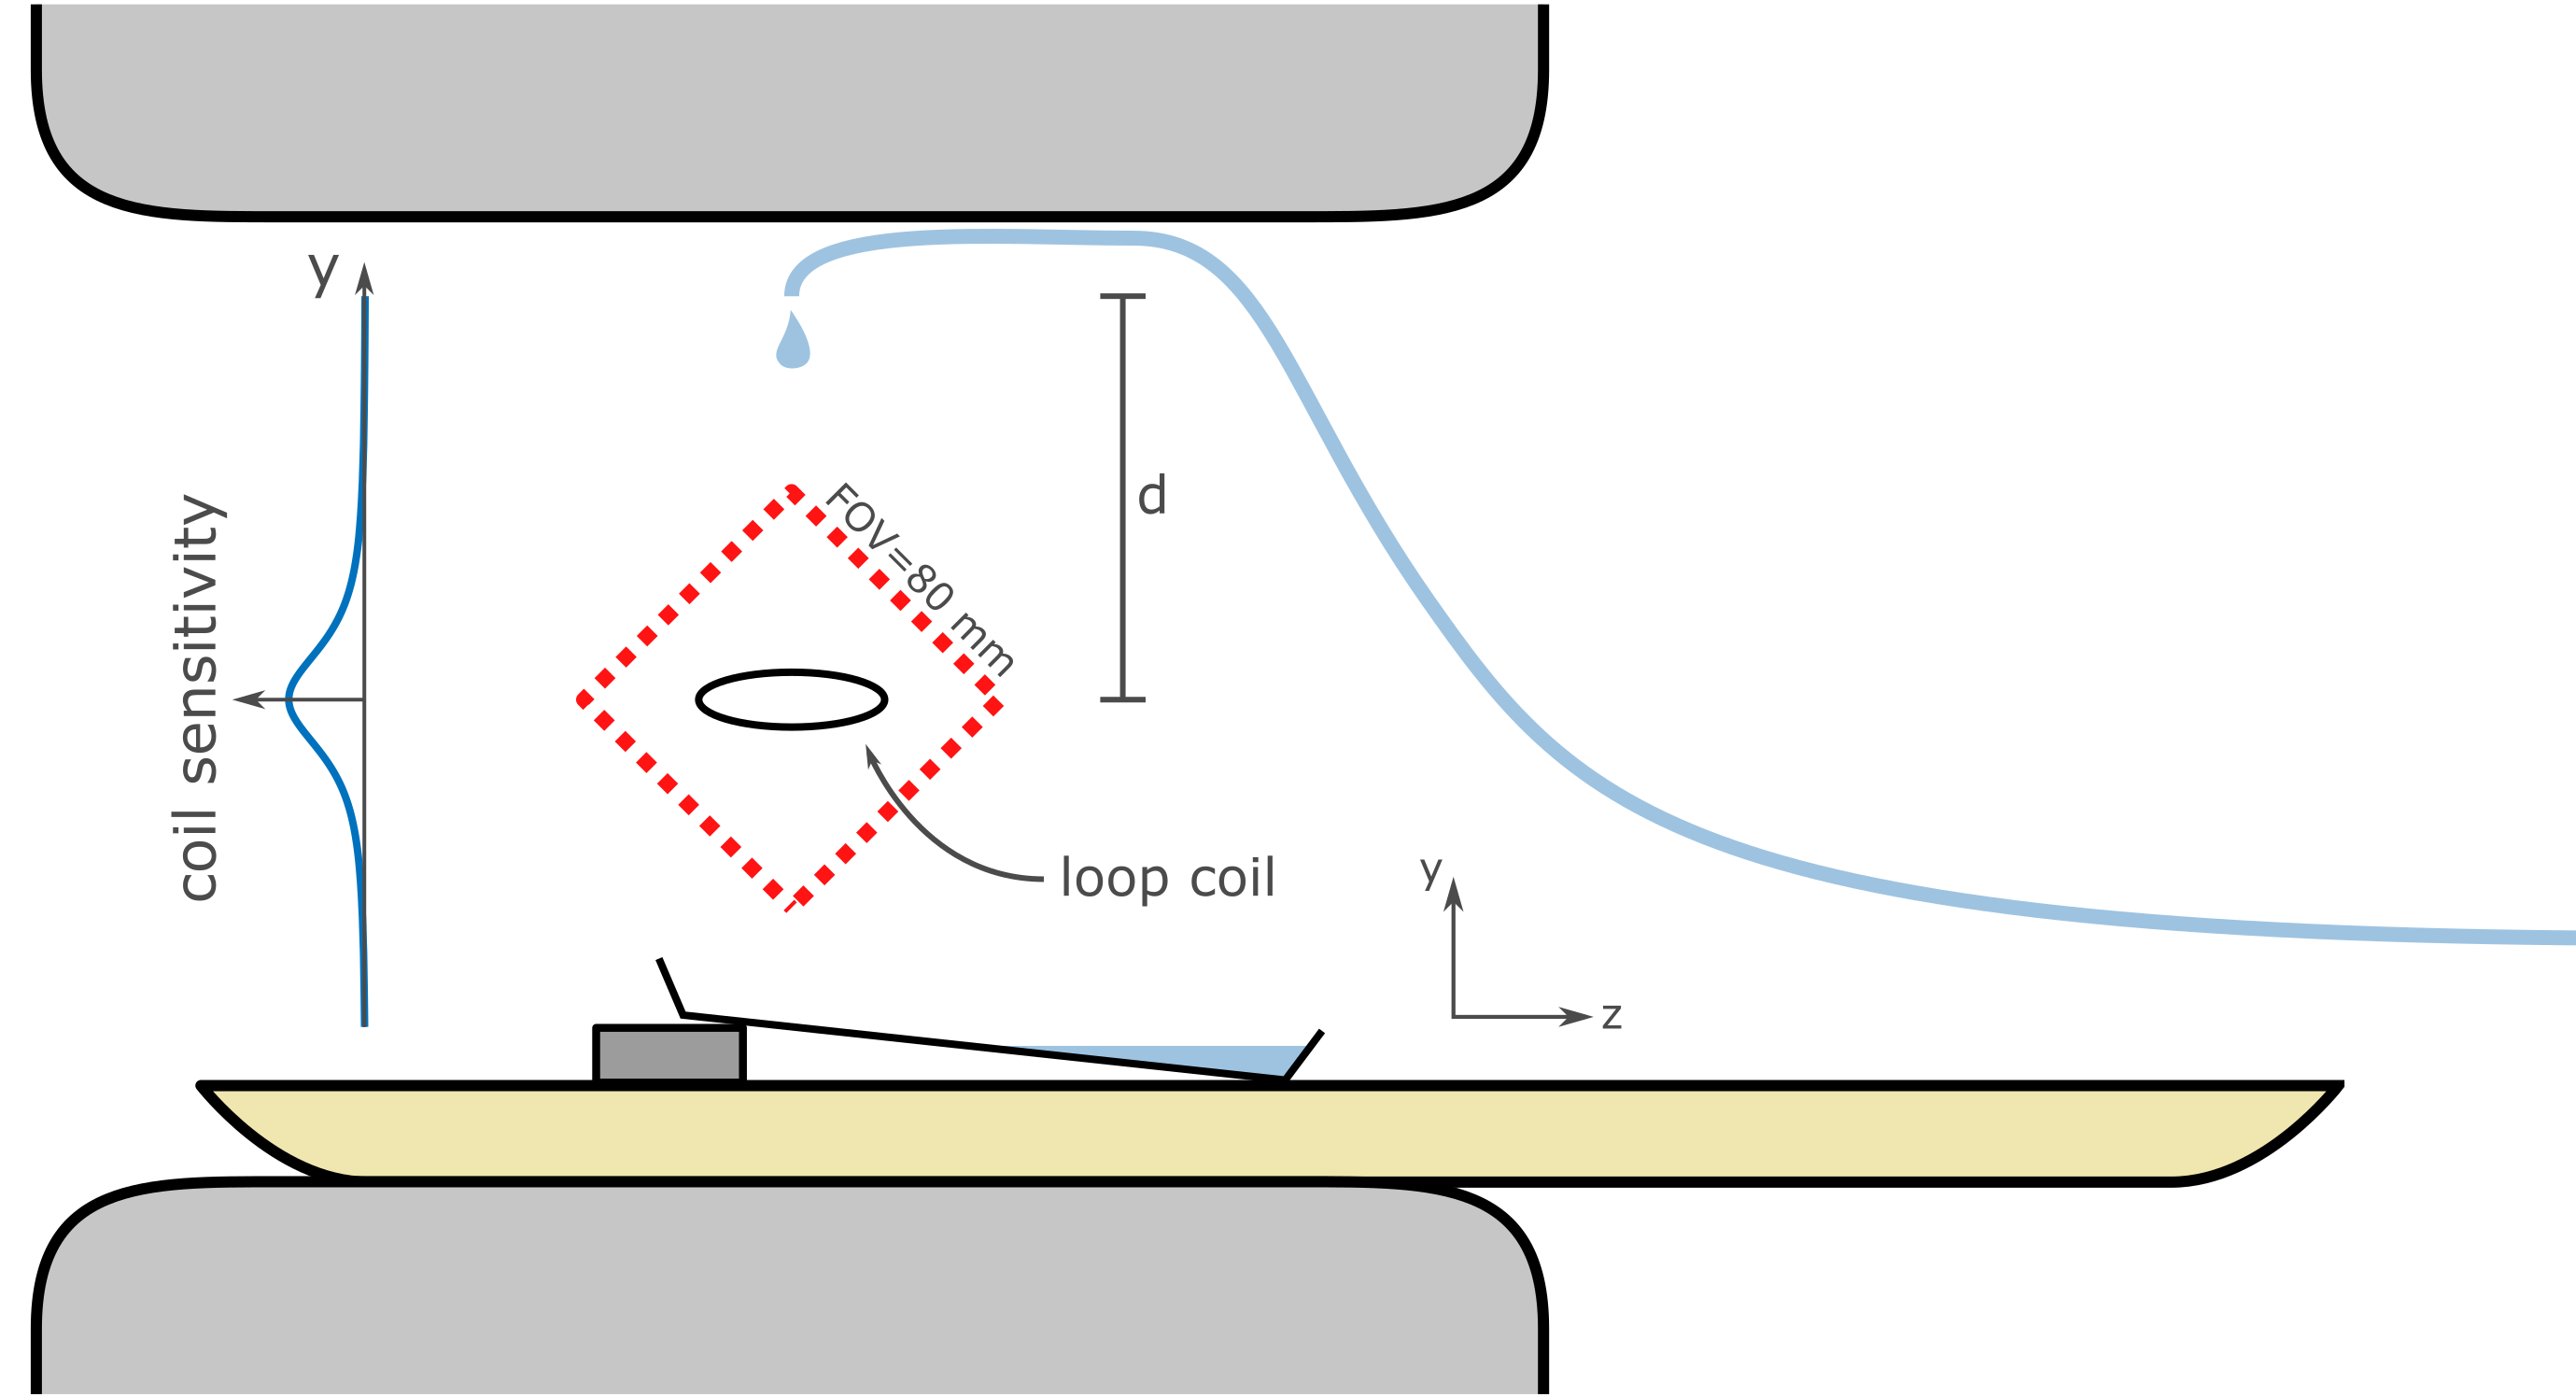
SPIRE Method: To encode repetitive 2D motion, very fast phase encoding gradients were applied as in1, however phase encoding was performed in both in-plane directions resulting in a 2D single point imaging (SPI) sequence (Figure 1). Phase encoding gradients were realized with a shortest possible duration to improve the temporal resolution of the SPIRE sequence. At a clinical 3T MRI system (PrismaFit, Siemens, Germany) the duration for the longest phase encoding gradient was 460 µs at a spatial resolution of 1.67 mm.Setup: To test the SPIRE method drops of a contrast agent solution (MultiHance 0.5 M, Bracco Imaging, concentration: 0.5%, T1 = 75 ms, T2* = 50 ms) were repetitively released from a tube 150 mm above isocenter (Figure 2). The drops (m = 51 ± 2 mg) fell through a small loop-coil positioned at iso-center, and the motion was imaged dynamically with a SPIRE sequence with the following parameters: matrix size: 48x48, FOV = 80 mm, $$$\alpha$$$ = 14°, TE = 1 ms, TR = 2.06 ms, 760 averages, total acquisition time: 1h. To demonstrate the 2D imaging capabilities of SPIRE, the FOV was rotated by 45° so that motion occurs in both in-plane directions.
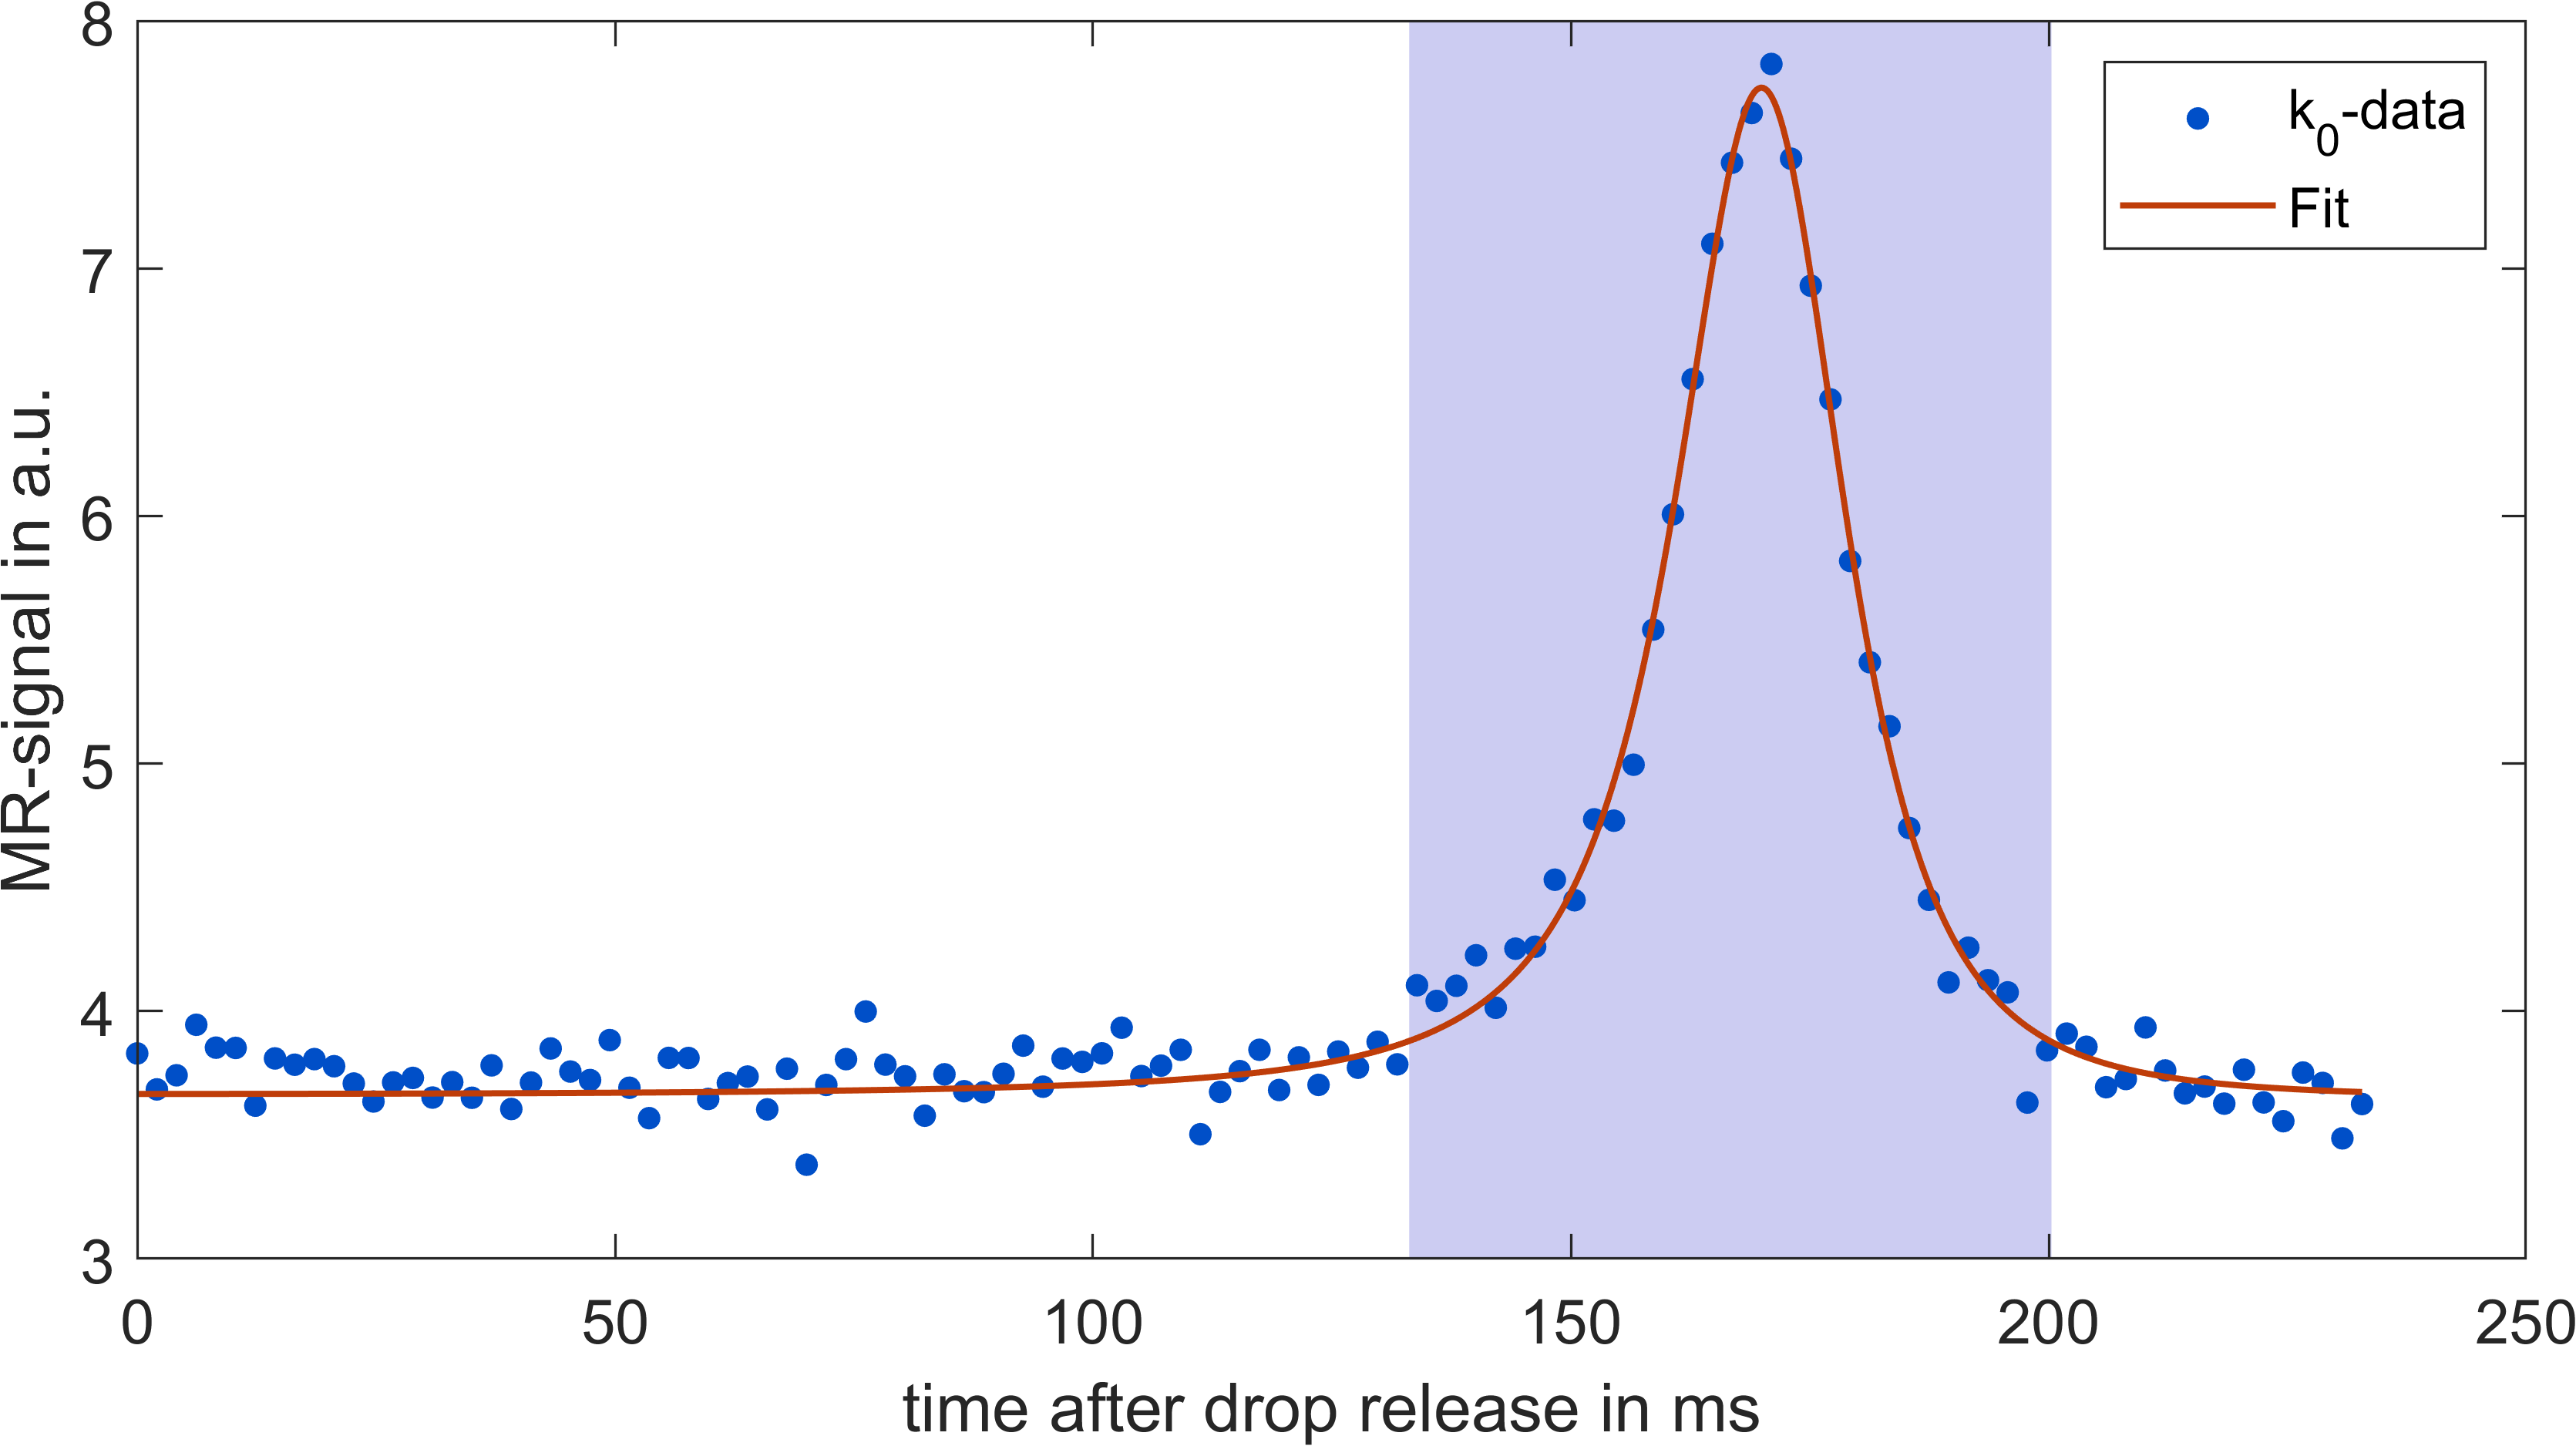
Gating and Reconstruction: For each acquired sequence block, 13 data points before phase encoding (k0 data) was taken as a gating signal. Using the averaged signal intensity of this gating data the subsequently acquired phase encoded data could be resorted, as gating signal changes drastically when the drop passes through the sensitivity profile of the coil (R = 2.3 mm). Inserting the equation of motion into the sensitivity profile of the coil yields the signal-time curve of the drop after release at height d: $$S(t)\approx\frac{R^2}{\left(\left(\frac{gt^2}{2}-d\right)^2+R^2\right)^\frac{3}{2}},\quad(1)$$ where t is the time passed since the release of the drop and g = 9.81 $$$\frac{\mathrm{m}}{\mathrm s^2}$$$. To synchronize the acquired data with the drop motion, the signal peaks were identified in the gating data. Then, $$$S(t)$$$ is fitted to the data around each peak to identify the time passed after the last drop release. The encoded data after the PE gradients (cf. Fig. 1) are then resorted into 150 time frames so that the falling motion is resolved with a temporal resolution of 450 µs.
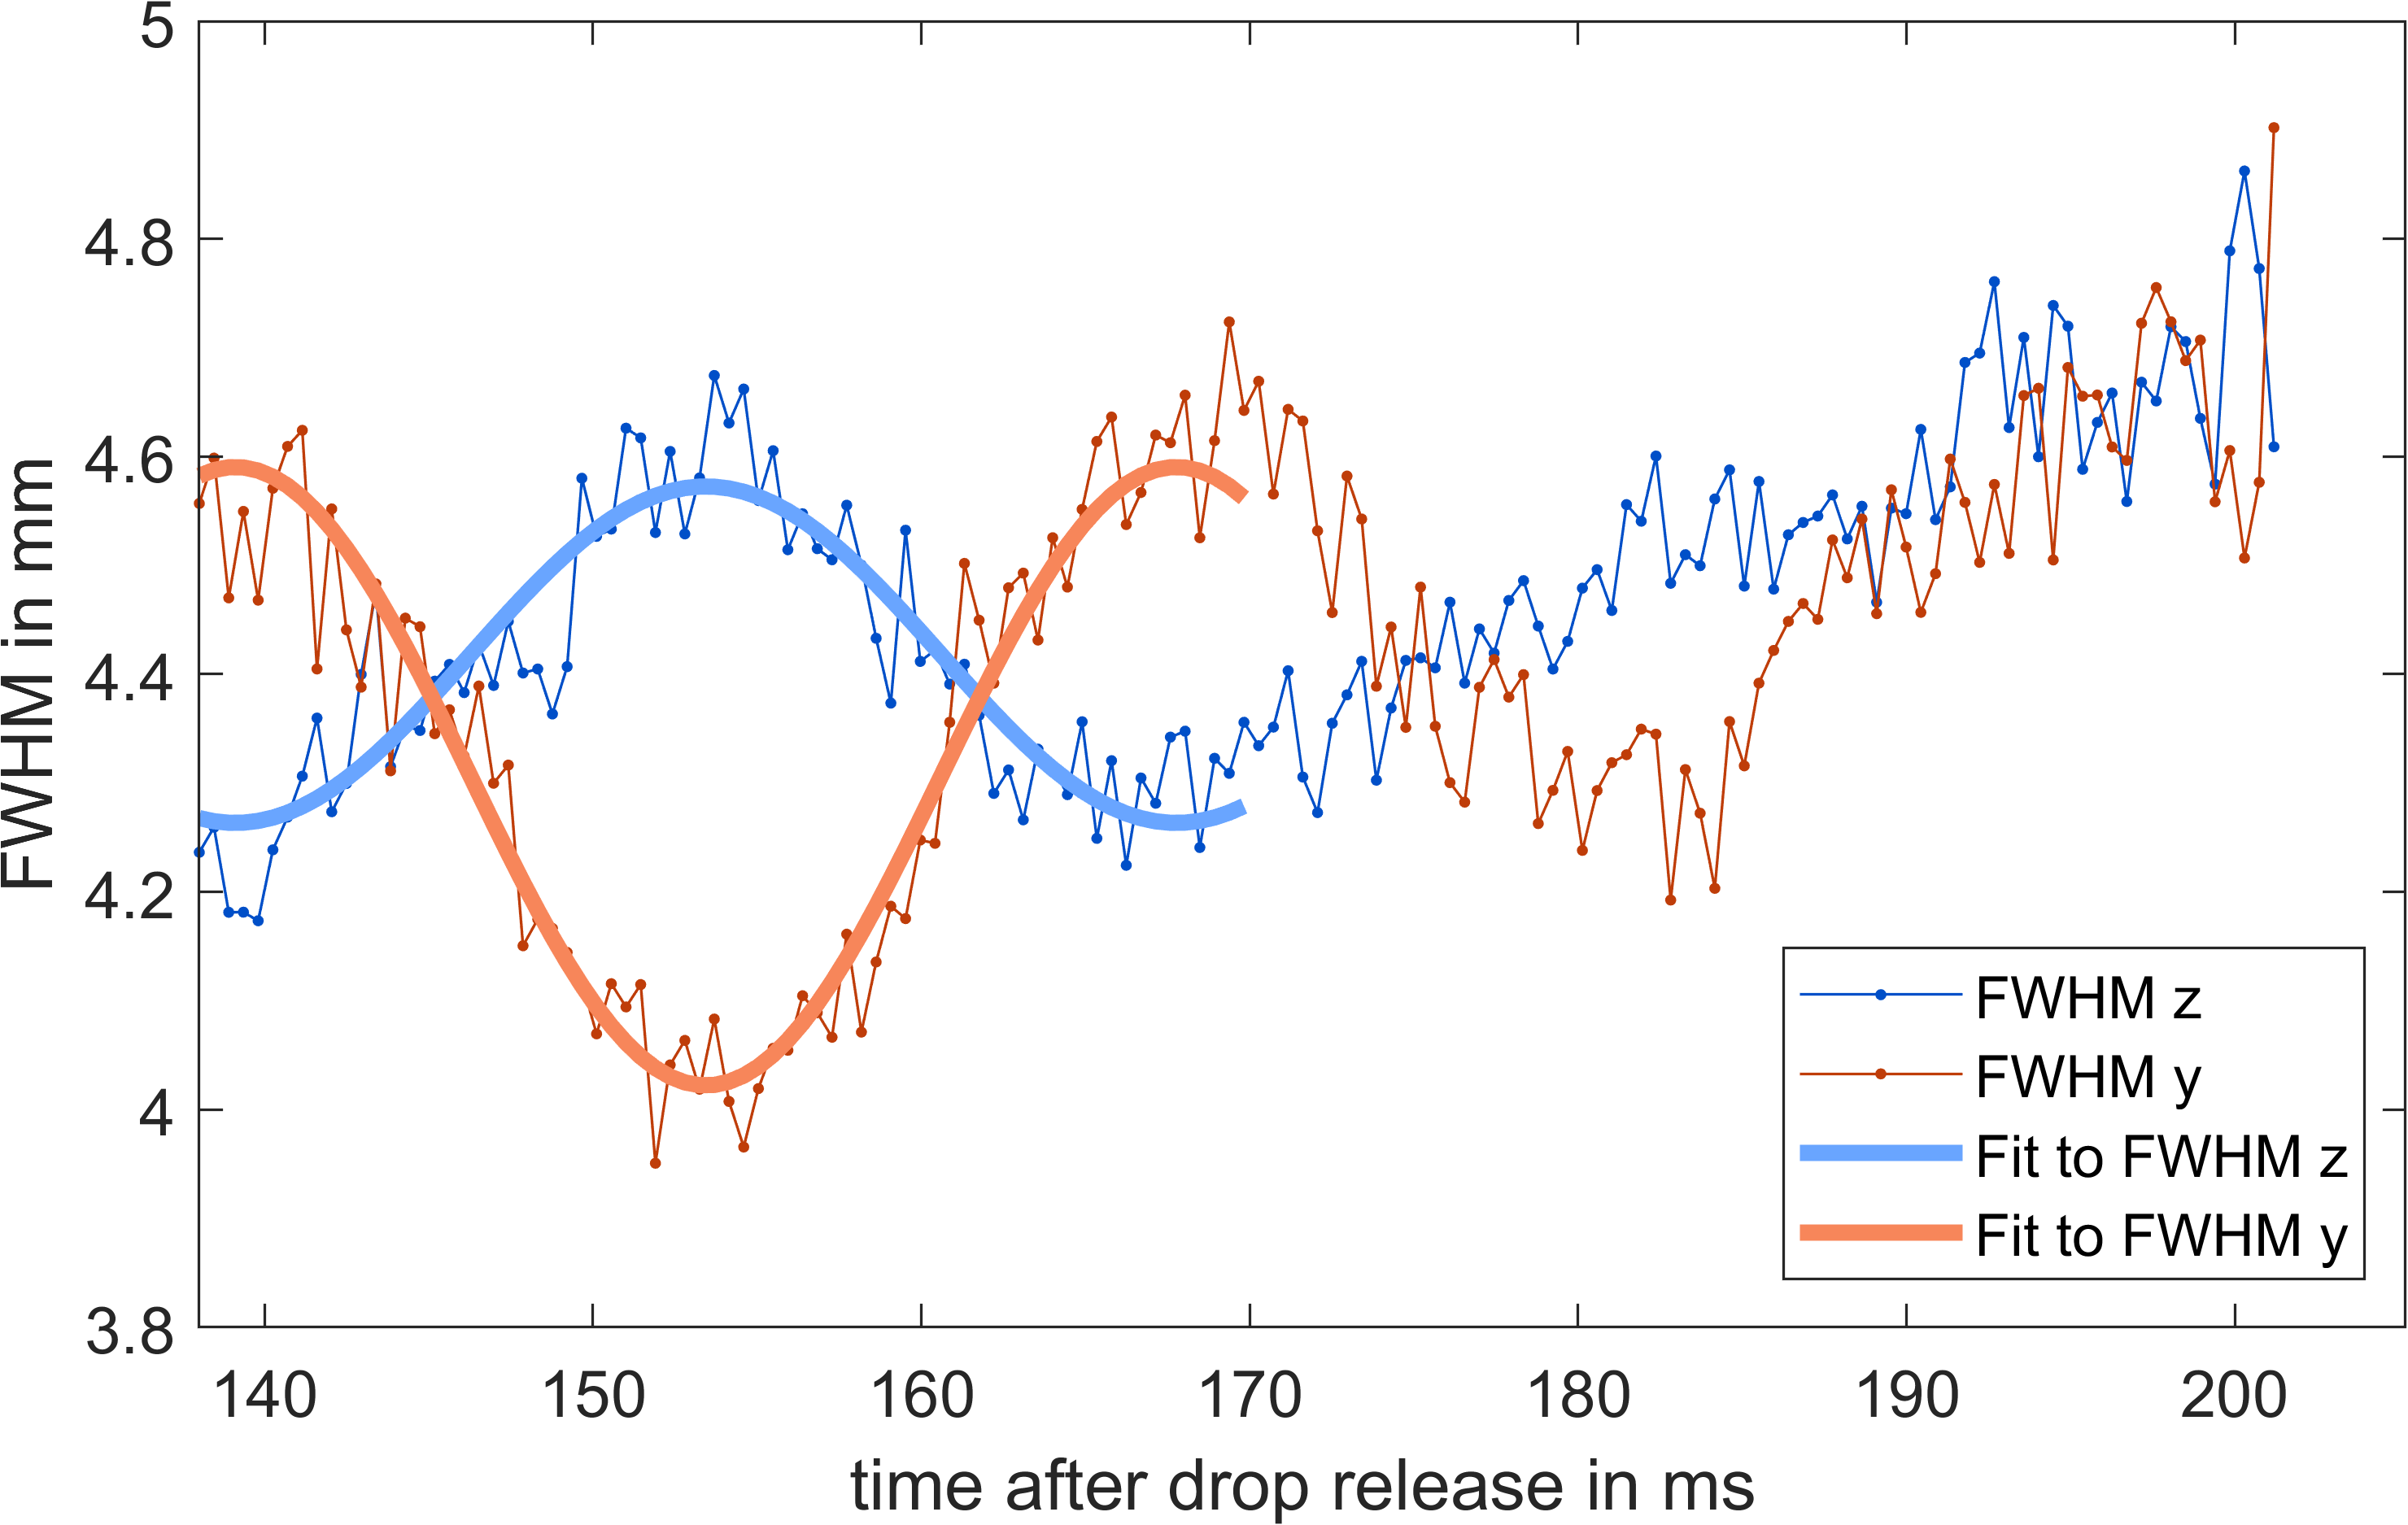
Drop oscillation: Drops released from a tube show a characteristic oscillation. To quantify the oscillation frequency, a 2D Gaussian distribution was fitted to dynamic images and the FWHM in y and z direction were retrieved as a measure for the current height and width of the drop. From the dynamic curves of these parameters the oscillation frequency of the drops was estimated by a fit.
Results
Figure 4 shows the stroboscopic representation of the falling water drops. Interestingly, not only does signal increase when the drop is closer to the coil center, but also background noise. Analysis of the drop shape reveals an oscillation frequency of 34.8 Hz. This is in good agreement with the theoretical prediction by Rayleigh for small droplets2 $$f=\frac{1}{2\pi}\sqrt{\frac{8\sigma}{\rho r^3}}=\sqrt{\frac{8\sigma}{3\pi m}}\quad(2)$$ which predicts an oscillation frequency of around 34.9 Hz with a water surface tension of $$$\sigma$$$ = 72.8 $$$\frac{\mathrm{mN}}{\mathrm m}$$$ 3.Discussion
Depending on the measurement duration, not all points in k-t-space can be sampled. Zerofilling the missing points causes noise that correlates with signal intensity, because the Fourier representation of the small drops is very broad, which explains the increase in noise, when the signal source is in the area of highest sensitivity.We show that it is possible with modern MRI systems to image cyclic processes with a temporal resolution below 0.5 ms while detecting oscillation amplitudes in the submillimeter range. Even though the feasibility was only tested in a phantom setup, imaging of fast repetitive physiologic motion such as the vocal folds or aortic heart valves should be feasible. Currently, the largest drawback of this method is the very long measurement time, since only one k-space point is acquired in each TR. This limitation might be overcome by sparse sampling methods that can e.g. exploit the high degree of coherence in the time domain. Additionally, fast and simultaneous gradient switching along two axes might be limited by peripheral nerve stimulation, requiring a compromise between spatial and temporal resolution.
Acknowledgements
No acknowledgement found.References
[1] J. Fischer, T. Abels, A. C. Özen, M. Echternach, B. Richter, und M. Bock, „Magnetic resonance imaging of the vocal fold oscillations with sub-millisecond temporal resolution“, Magn. Reson. Med., Bd. 83, Nr. 2, S. 403–411, 2019.
[2] J. W. Strutt, „VI. On the capillary phenomena of jets“, Proc. R. Soc. Lond., Bd. 29, Nr. 196–199, S. 71–97, Jan. 1879.
[3] U. Grigull und J. Bach, „Die Oberflächenspannung und verwandte Zustandsgrössen des Wassers“, Sonderdr. Aus Brennst.-Wärme-Kraft BWK, Bd. 18, Nr. 2, S. 73–75, 1966.
Figures