3708
Demonstrating the benefits of high gradients in short-T2 MRI1Institute for Biomedical Engineering, ETH Zurich and University of Zurich, Zurich, Switzerland
Synopsis
Recent developments on high-performance gradients allow MR signals to be encoded much faster than with clinical gradients, hence decreasing T2-related k-space apodization. As a consequence, the point spread function becomes taller and narrower, thus leading to improved actual resolution and higher signal intensity for components with rapid transverse relaxation. In the present work, these benefits are investigated with PSF calculations and demonstrated experimentally using a high-performance gradient. Data of short-T2 tissues (T2 < 1 ms) are acquired using the PETRA technique with different gradient strengths and compared using image subtraction.
Introduction
Recent developments in gradient hardware raise strong interest in the domain of short-T2 MRI. Today, human-sized high-performance gradient systems are available providing strengths up to 200 mT/m at full duty cycle (1) as compared to approximately 40 mT/m as commonly feasible in clinical scanners. Hence, MR signals can be encoded much faster and apodization in k-space due to T2 or T2* decay is reduced. As a consequence, the point spread function (PSF) becomes taller and narrower, thus leading to improved actual resolution and higher signal intensity for components with rapid transverse relaxation (2,3). In the present work, these benefits are investigated with PSF calculations and demonstrated experimentally using a high-performance gradient. Data of short-T2 tissues (T2 < 1 ms) are acquired using the PETRA technique (4) with different gradient strengths and compared using image subtraction.Methods
HardwareAll experiments were performed on a 3 T Achieva MRI system (Philips Healthcare, Best, Netherlands), complemented with a high-performance insert gradient capable of reaching 200 mT/m at full duty cycle (1), symmetrically biased transmit-receive switches with switching times of approximately 3 µs at 3 T (5), and a high-end spectrometer with up to 4 MHz acquisition bandwidth and short digital filters with group delays down to 1.2 µs (6). Largely 1H-free RF coils were used for both transmission and reception (7).
Samples
A piece of bovine tibia was freed of sources of long-lived MR signal by cooking it in water for several hours. The sample was then dried and stored at room temperature.
A fresh ovine jaw was imaged a few hours after slaughtering. Large sources of long-lived MR signal at the outside such as skin and muscles were removed mechanically.
In-vivo imaging of a thumb was conducted in healthy a volunteer according to applicable ethics approval and with written informed consent.
Imaging
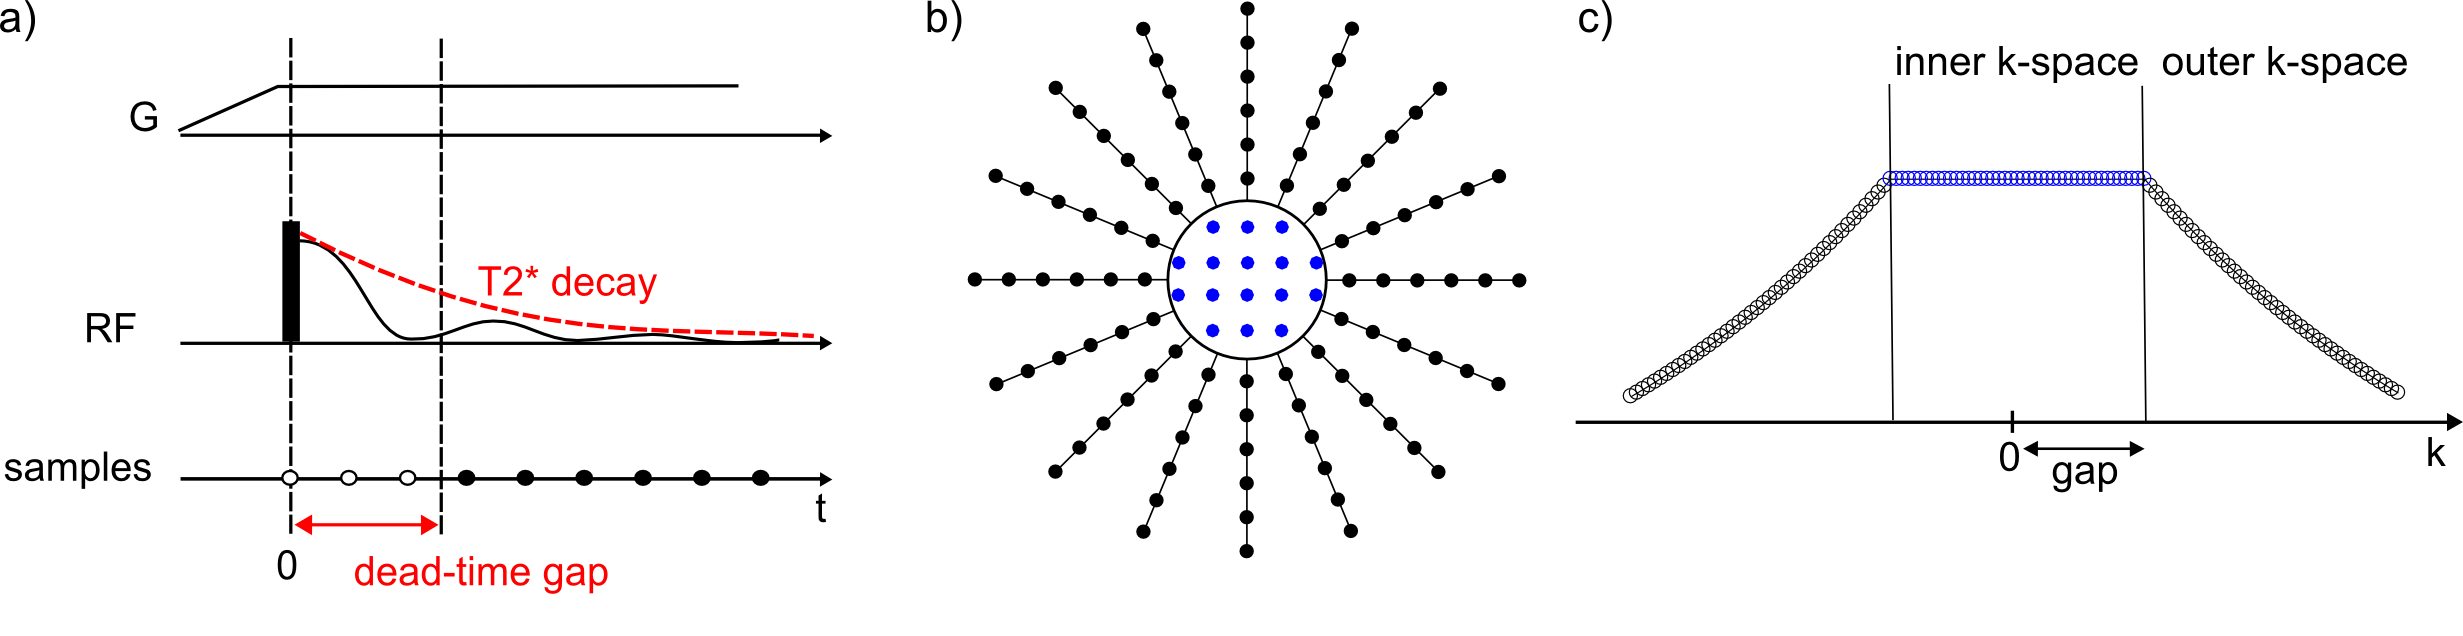
The PETRA technique in Fig. 1 was used with a hard pulse of 2 $$$\mu s$$$ and gradient strengths of 40 and 200 mT/m.
Images were reconstructed using an iterative conjugate gradient algorithm (8). Data obtained with different gradient strengths were compared by magnitude image subtraction. Negative values in the subtraction data were considered as artifacts and set to zero.
PSF calculation
3D PSFs were calculated analytically by Fourier transformation of the k-space T2-weighting functions to investigate spatial resolution and support image interpretation.
Results
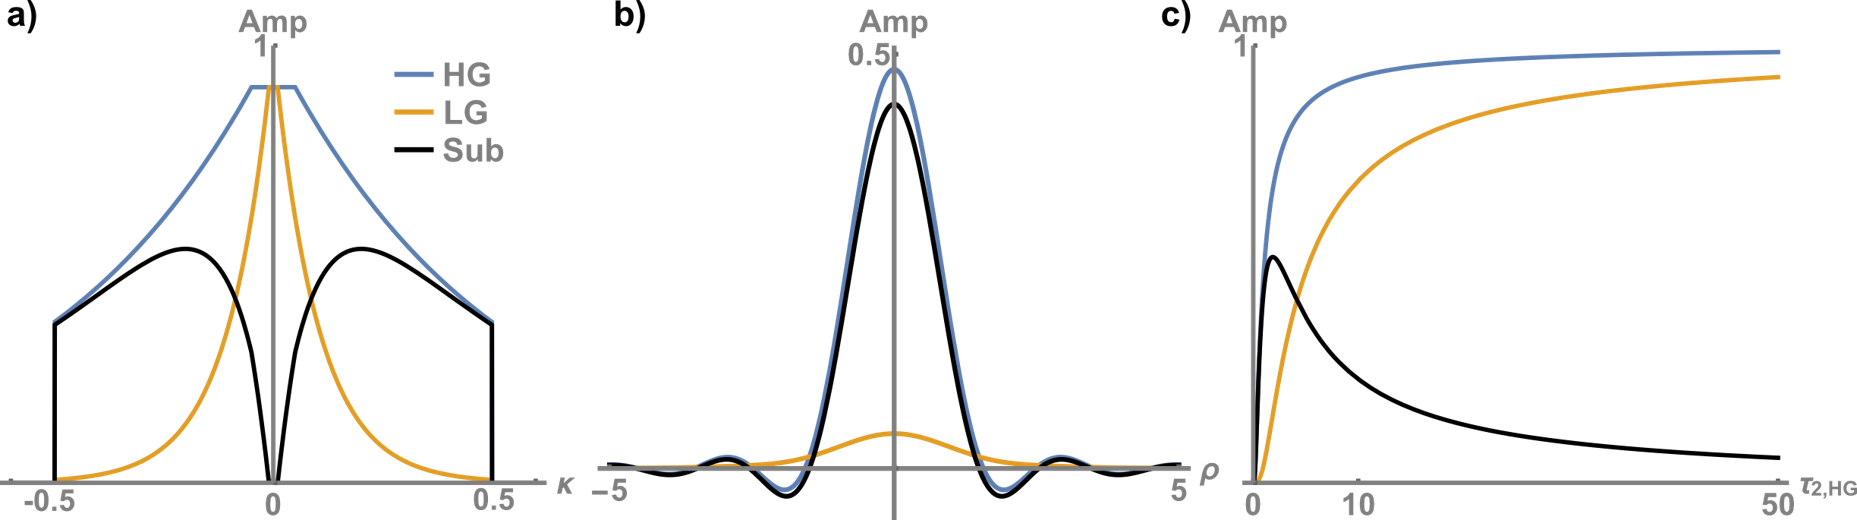
Figure 2: A high gradient provides high encoding speed and results in lower T2 weighting and a wider plateau in the k-space center (at fixed dead time) (Fig. 2a). This leads to a high and narrow PSF main lobe as opposed to using low gradient (Fig. 2b).Subtracting high- and low-gradient acquisitions in k-space engenders an unusual T2 weighting with zero amplitude in the k-space center (Fig. 2a). The resulting PSF shows a relatively benign behavior with only a slight shift towards negative values but without any strong side lobes (Fig. 2b).
In Fig. 2c, PSF heights are plotted as a function of the normalized relaxation constant $$$\tau_{2,HG} = T_{2}/T_{enc,HG} $$$ with the encoding time at high gradient $$$T_{enc,HG} $$$. As $$$\tau_{2,HG}$$$ increases, the PSF heights for both high and low gradient increase since effects of signal decay are reduced. However, the subtraction peaks around $$$\tau_{2,HG}$$$= 1, suggesting that signals with T2 on the order of $$$T_{enc,HG} $$$ are emphasized.
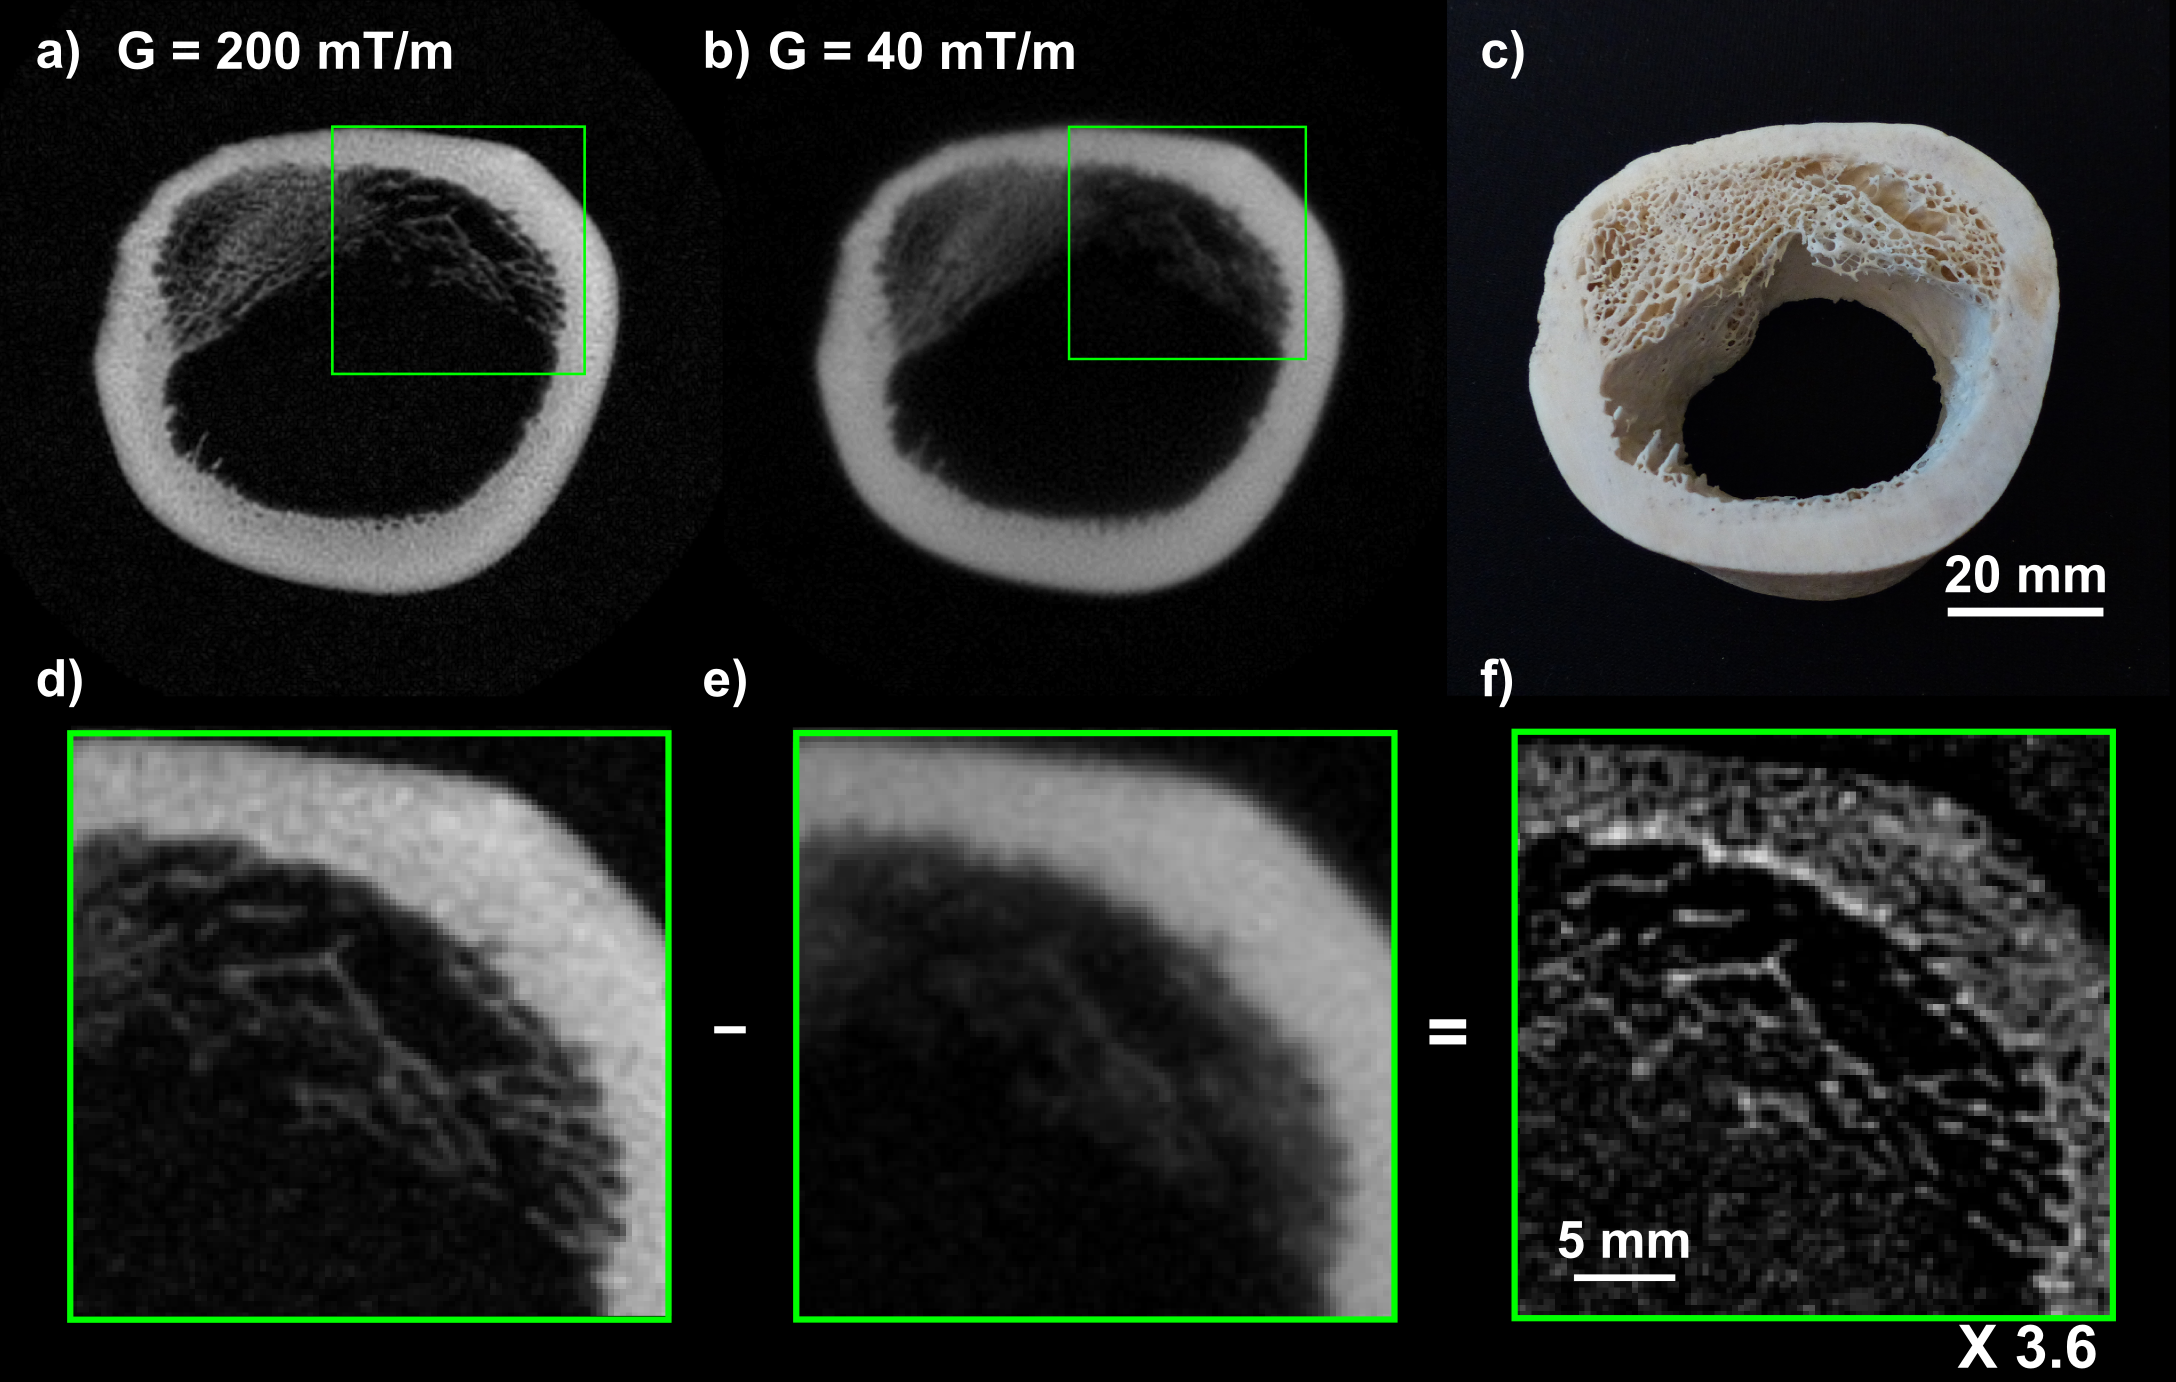
Figure 3: As predicted by the PSFs, the high gradient images of the bone (Figs. 3a and 3d) exhibit high resolution of fine structures, especially in the trabecular bone as illustrated in Figure 3d. The improvement of resolution is even more evident after subtraction (Fig. 3f) where fine structures are highlighted.
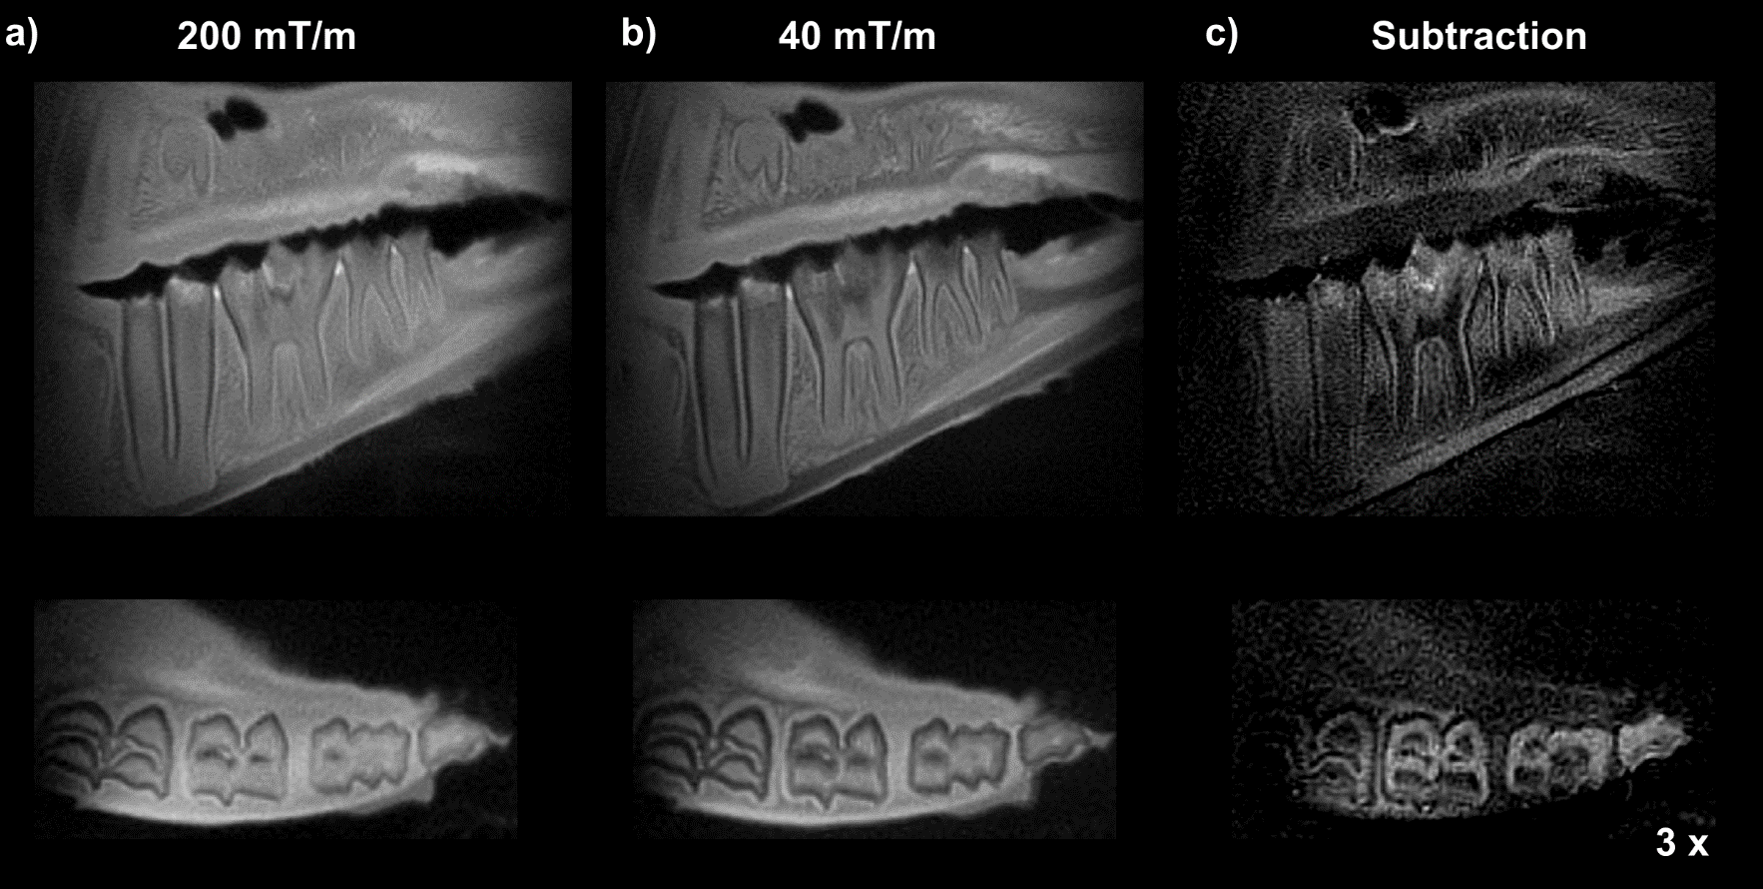
Figure 4: The loss of intensity between high- and low-gradient images (Figs. 4a and 4b) can be attributed to the decay of short-T2 signals originating from bones and teeth. These are featured in the subtraction image (Fig 4c), in agreement with the PSFs simulations.
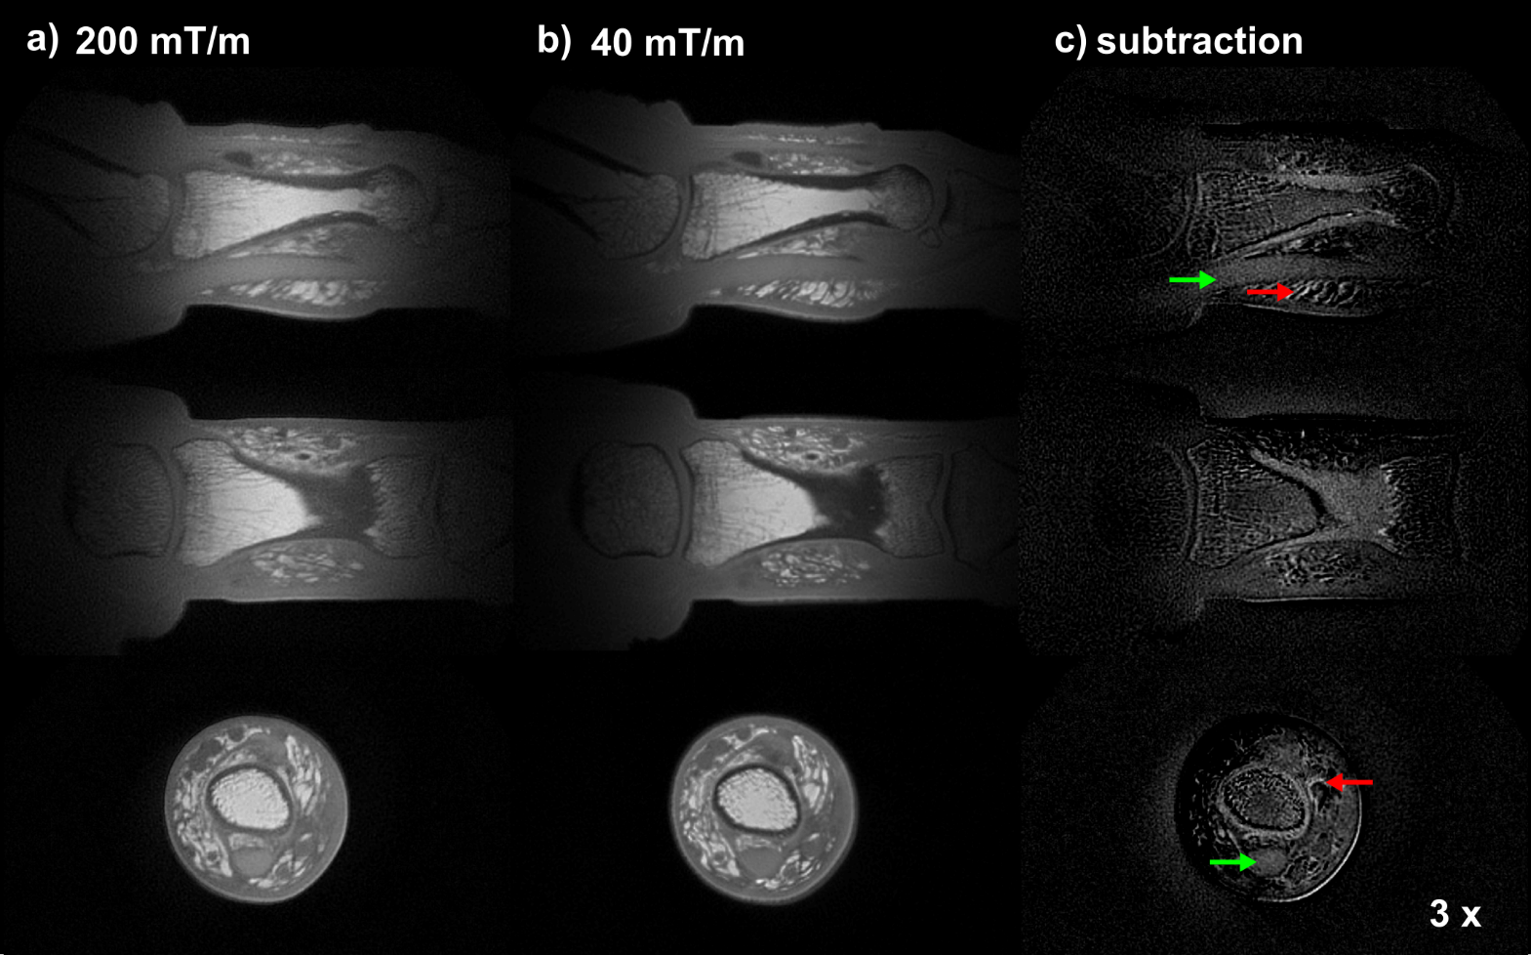
Figure 5: Tissues in the thumb containing fast relaxing spins are emphasized in the subtraction image (Fig. 5c) where also fine details can be observed. Intensity variations of low spatial frequencies are attributed to residual imperfections in the base images, possibly related to eddy currents.
Discussion
In this work it has been demonstrated that for imaging tissues with very short T2 the use of high gradients leads to clearly improved resolution and increased signal, affecting in particular fine structures.Overall, PSF simulations predicted such behavior and are a good means to quantitatively investigate resolution aspects. However, signal intensities derived from PSFs may deviate strongly from experimental observations as contributions from neighboring locations due to blurring are not taken into account. This particularly affects large signal patches and can only be solved by full 3D simulations.
PSF calculations also showed that subtraction of high- and low-gradient data emphasizes short-T2 tissues. Hence, such subtraction images are a useful tool to investigate short-T2 performance.
Conclusion
The presented combination of state-of-the-art short-T2 hardware and methodology suggests promising application in diverse domains such as high-resolution imaging of bones or teeth, depiction of the myelin sheath (9) or collagen, as well as material studies.Acknowledgements
No acknowledgement found.References
(1) Weiger M, Overweg J, Rösler MB, Froidevaux R, Hennel F, Wilm BJ, Penn A, Sturzenegger U, Schuth W, Mathlener M, et al. A high-performance gradient insert for rapid and short-T 2 imaging at full duty cycle. Magn Reson Med 2018;79:3256–66.
(2) Callaghan PT, Eccles CD. Sensitivity and resolution in NMR imaging. J Magn Reson 1987;71:426–45.
(3) Rahmer J, Börnert P, Groen J, Bos C. Three-dimensional radial ultrashort echo-time imaging with T2 adapted sampling. Magn Reson Med 2006;55:1075–82.
(4) Grodzki DM, Jakob PM, Heismann B. Ultrashort echo time imaging using pointwise encoding time reduction with radial acquisition (PETRA). Magn Reson Med 2012;67:510–8.
(5) Brunner DO, Furrer L, Weiger M, Baumberger W, Schmid T, Reber J, Dietrich BE, Wilm BJ, Froidevaux R, Pruessmann KP. Symmetrically biased T/R switches for NMR and MRI with microsecond dead time. J Magn Reson 2016;263:147–55.
(6) Dietrich BE, Brunner DO, Wilm BJ, BarmeT C, Gross S, Kasper L, Haeberlin M, Schmid T, Vannesjo SJ, Pruessmann KP. A field camera for MR sequence monitoring and system analysis. Magn Reson Med 2016;75:1831–40.
(7) Weiger M, Brunner DO, Schmid T, Froidevaux R, Rösler MB, Gross S, Pruessmann KP. A virtually 1H-free birdcage coil for zero echo time MRI without background signal. Magn Reson Med 2017;78:399–407.
(8) Pruessmann KP, Weiger M, Börnert P, Boesiger P. Advances in sensitivity encoding with arbitrary k-space trajectories. Magn Reson Med 2001;46:638–51.
(9) Weiger M, Pruessmann KP. Short-T2 MRI: Principles and recent advances. Prog Nucl Magn Reson Spectrosc 2019.
Figures