3707
High resolution T1 mapping with reduced B1+ sensitivity using the FLAWS sequence at 7T1Univ Rennes, CRLCC Eugene Marquis, Inserm, LTSI-UMR 1099, F-35000 Rennes, France, 2The Australian e-Health Research Centre, CSIRO, Brisbane, Australia, 3Data 61, CSIRO, Brisbane, Australia
Synopsis
The MP2RAGE sequence can be used to provide 7T T1-weighted images and T1 maps with reduced transmitted bias field (B1+) sensitivity, at the cost of limiting the image resolution and contrast to noise ratio (CNR). The FLAWS sequence was derived from the MP2RAGE sequence to provide multiple T1-weigthed contrasts that were shown to be of interest for a wide range of clinical applications. The current study shows that the FLAWS sequence can be used to generate 7T T1-weigthed images and T1 maps with reduced B1+ sensitivity, while overcoming the resolution and CNR limitations imposed to the MP2RAGE sequence.
Introduction
The MP2RAGE sequence provides T1-weighted images with a reduced B1 sensitivity [1] and allows for the measurement of T1 relaxation time. However, the T1 mapping using MP2RAGE is limited by the transmitted bias field (B1+), thus producing unreliable T1 maps at ultra-high fields [2]. Marques et al. proposed a set of parameters to reduce the B1+ sensitivity of the 7T MP2RAGE data, at the cost of limiting its resolution and contrast to noise ratio (CNR) [2].The FLAWS sequence [3] was derived from the MP2RAGE sequence to provide multiple co-registered T1-weigthed contrasts: an FGATIR-like contrast that could be of interest for deep brain stimulation surgery planning; an MPRAGE-like contrast for structural imaging; and a DIR-like contrast that may facilitate the detection of brain lesions.
In this context, the current study aims at showing that the FLAWS sequence can be used to generate high resolution T1 maps with reduced B1+ sensitivity.
Materials and methods
After obtaining written consent, experiments were performed on six healthy volunteers (age: 21-48 years old, 2 females) with a 7T whole body MRI research scanner (Siemens Healthcare, Erlangen, Germany) equipped with a 32 channel head coil (Nova Medical, Wilmington, USA). A B1+ map was acquired for each volunteer using the SA2RAGE sequence [4]. The MP2RAGE sequence was acquired with parameters optimized for reduced B1+ sensitivity (1mm isotropic resolution, acquisition time: 10mins) [2]. The FLAWS sequence was acquired with parameters which were optimized in the current study (TR=5s, TI1/TI2=0.64s/1.43s, α1/α2=4°/8°, 0.8mm isotropic resolution, matrix 240×240×192, acquisition time: 10mins). The optimization was performed using a method previously validated for 1.5T FLAWS imaging [5]. The FLAWS T1 map was reconstructed using lookup-tables of the FLAWS-hc signal (see [5] for more information about the FLAWS-hc signal reconstruction).The contrast to noise ratio (CNR) per unit of time between brain tissues was measured in MP2RAGE and FLAWS bias reduced images within regions of interests (ROIs) defined in [3]. The CNR per unit of time was measured using its standard equation that can be found in [1]. The MP2RAGE and FLAWS CNRs were compared using the Wilcoxon signed rank test.
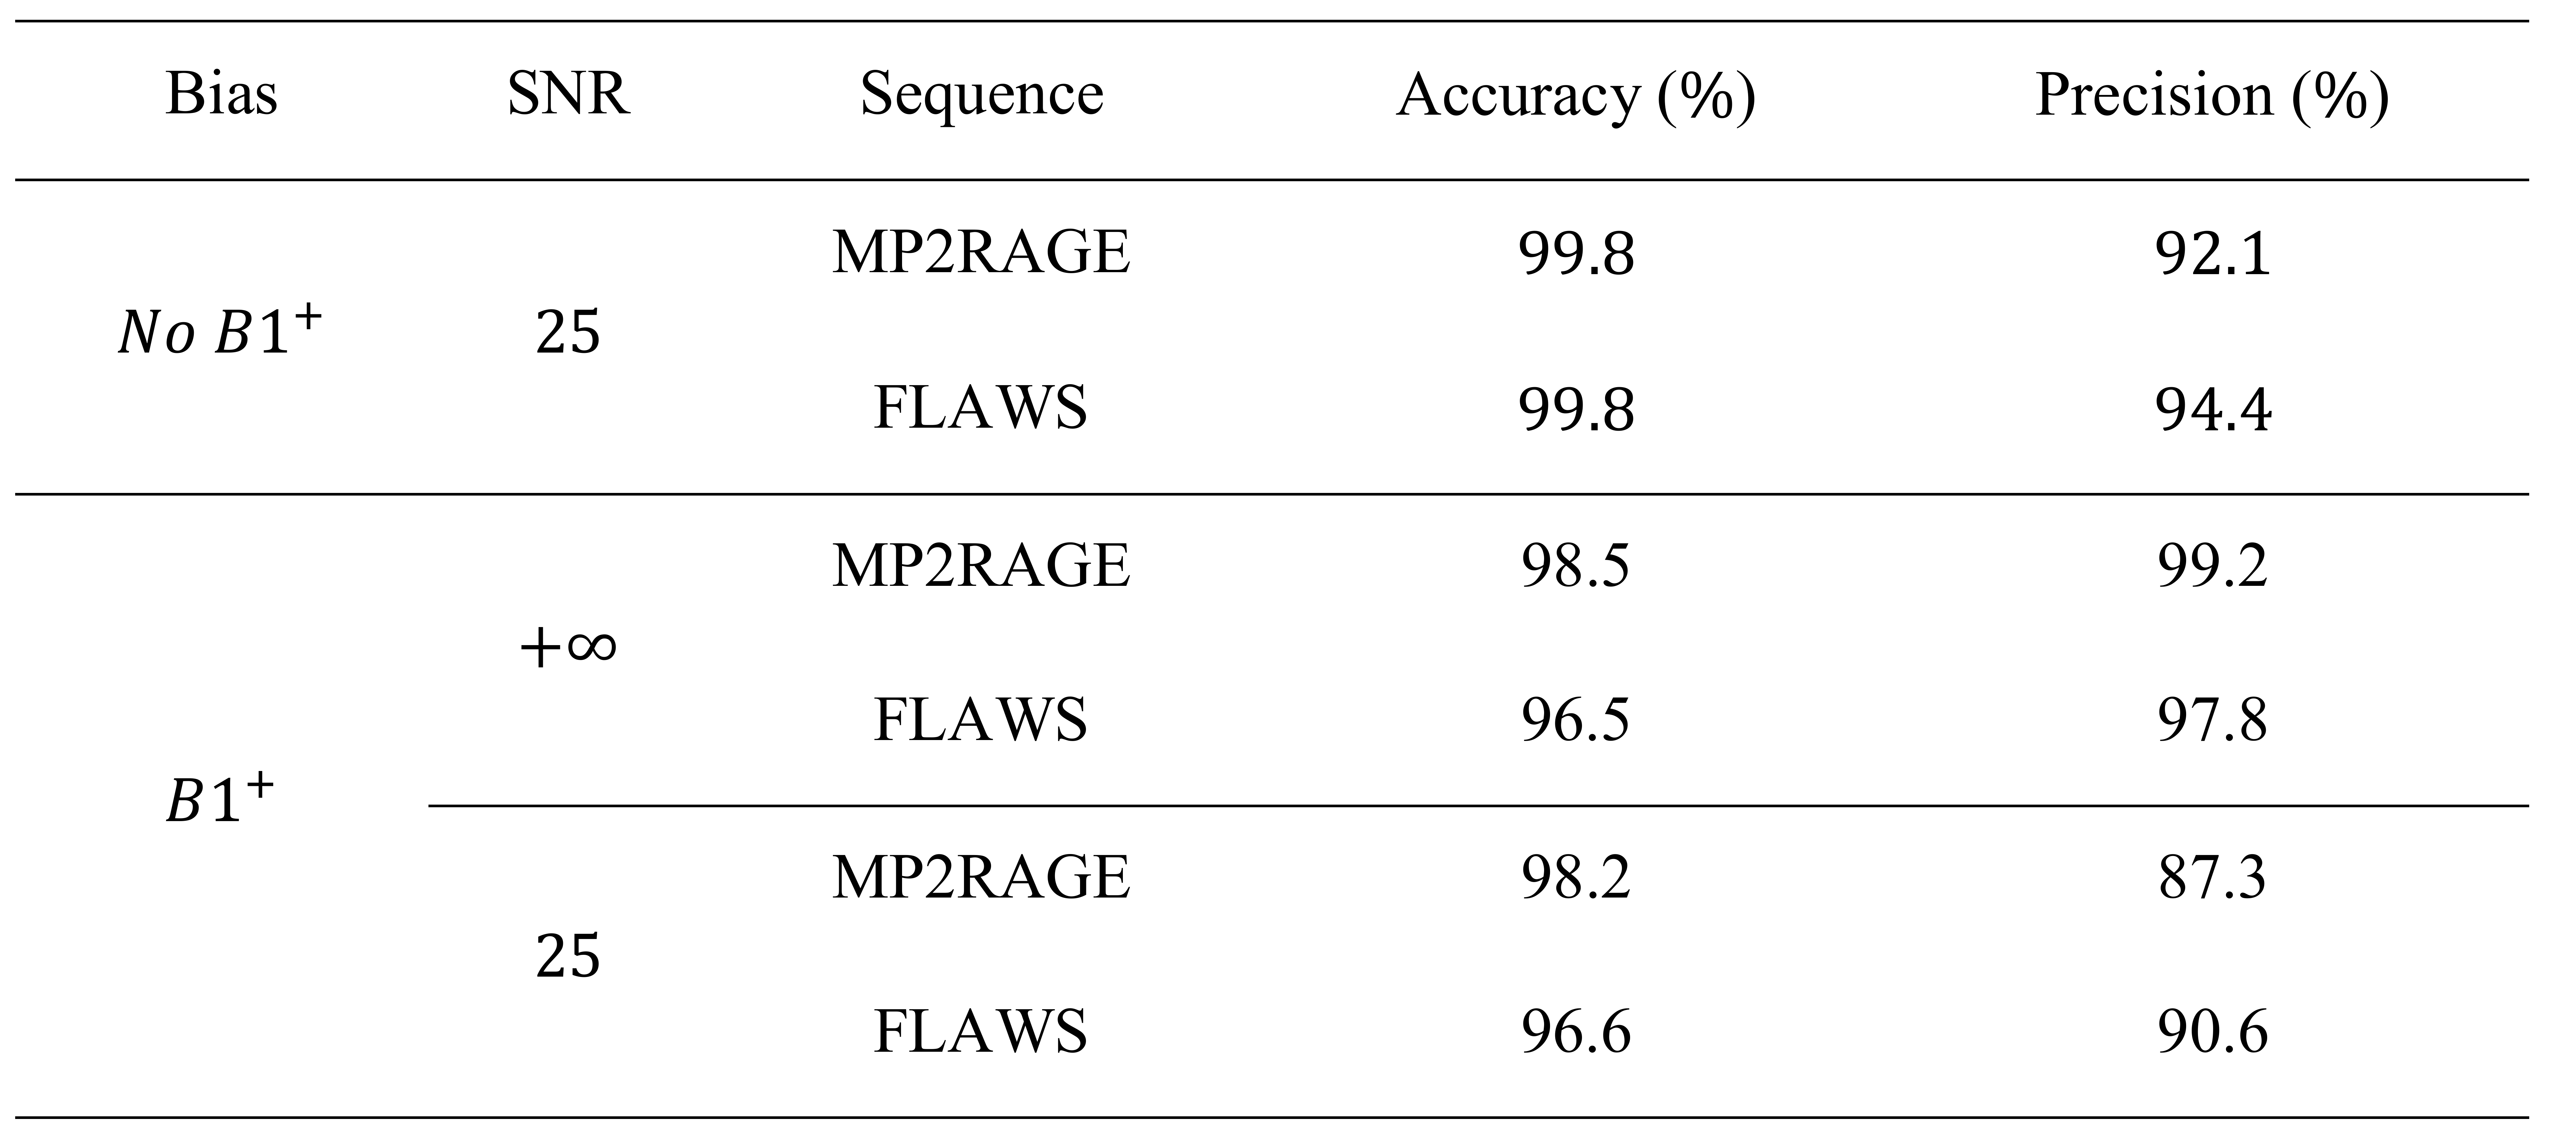
The accuracy and the precision of the MP2RAGE and FLAWS T1 measurements were determined with Monte-Carlo experiments simulated by solving the Bloch equations of the sequences. To increase the consistency between the in-vivo and theoretical experiments, the simulations were performed with SNR and B1+ distributions determined from the acquired data. The in-vivo MP2RAGE and FLAWS T1 values were measured within ROIs defined in [6]. The effect of the B1+ on the FLAWS T1 mapping was assessed in-vivo by computing the correlation between the T1 relaxation time and the B1+ within the white matter and cortical gray matter segmentations (determined with FreeSurfer [7]) of each volunteer.
Results
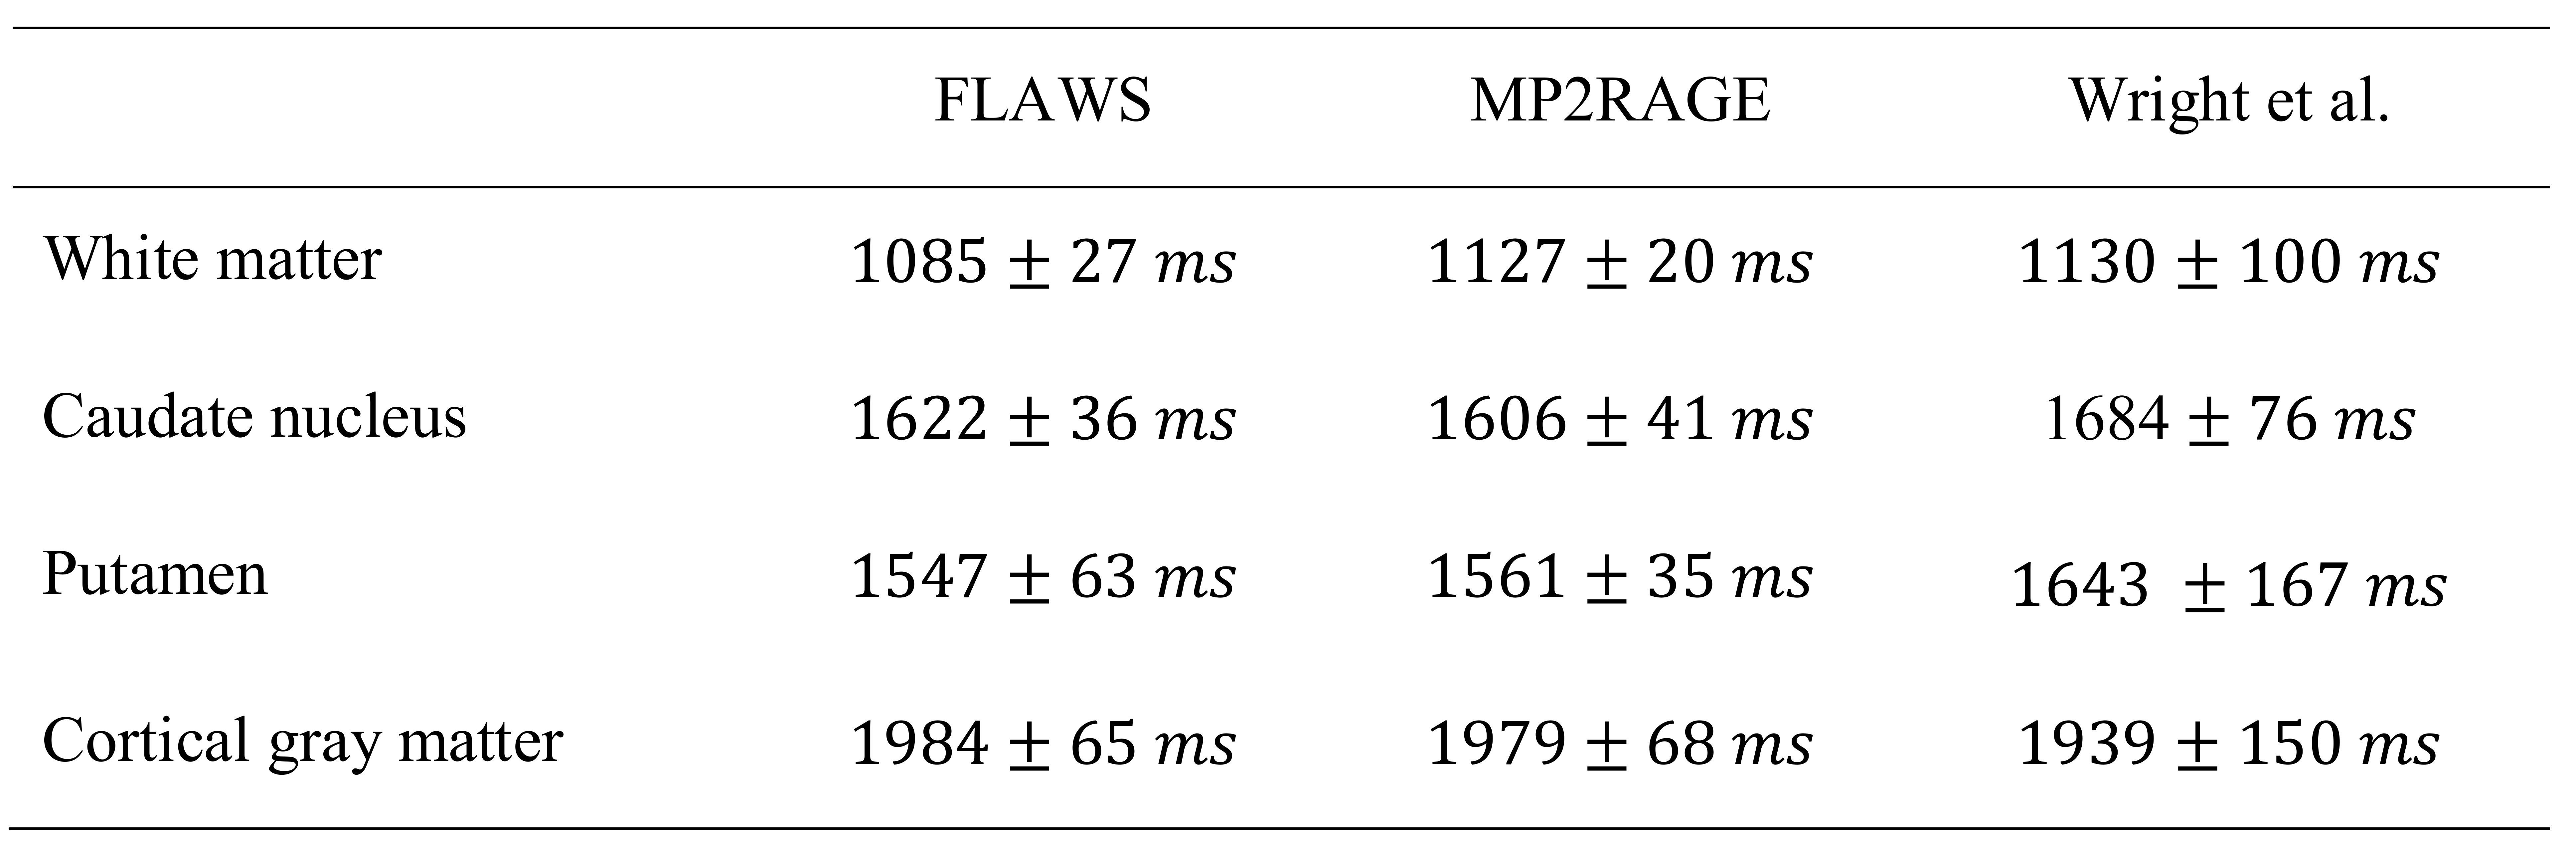
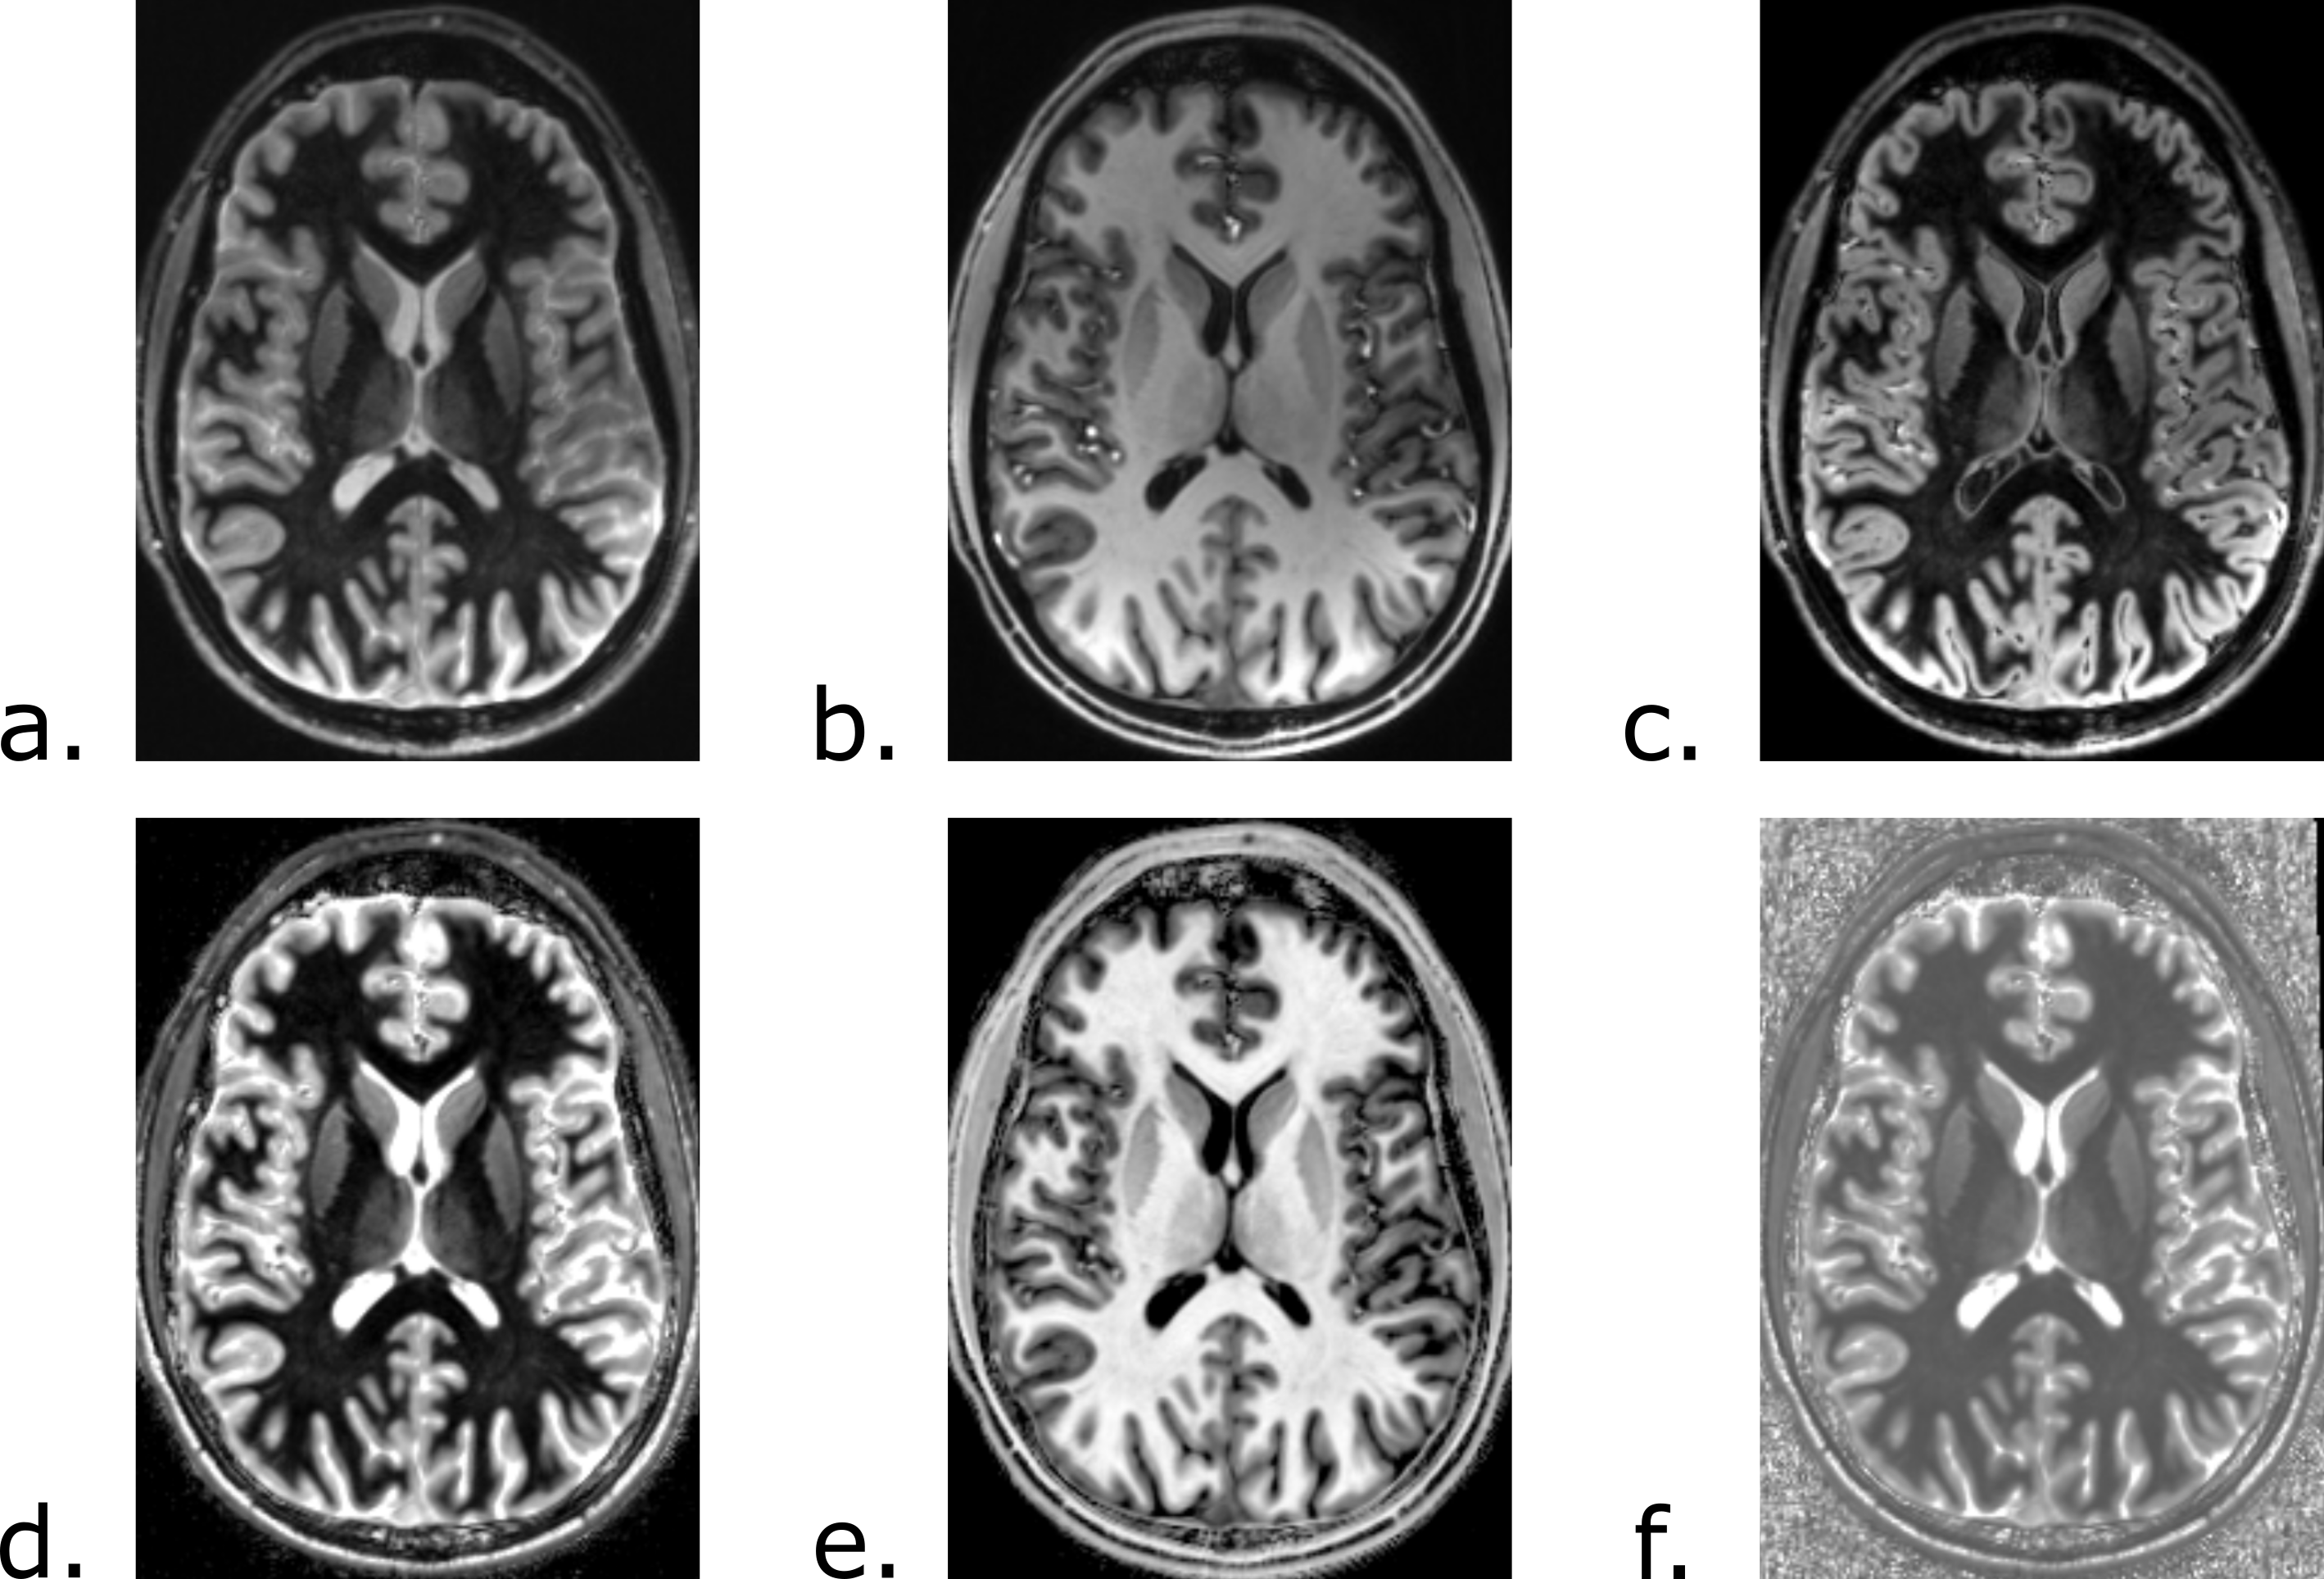
The different contrasts obtained with the FLAWS sequence are presented in Figure 1. The WM/GM CNR was not significantly different between the bias reduced FLAWS images and the bias reduced MP2RAGE images (p=0.401). The WM/CSF and GM/CSF CNRs were significantly higher in the bias reduced FLAWS images (pWM/CSF=0.036; pGM/CSF=0.036).The high accuracy and precision of the FLAWS and MP2RAGE T1 mappings can be seen in Table 1. The average in-vivo T1 values measured with the FLAWS sequence are in agreement with other T1 mapping methods, as shown in Table 2.
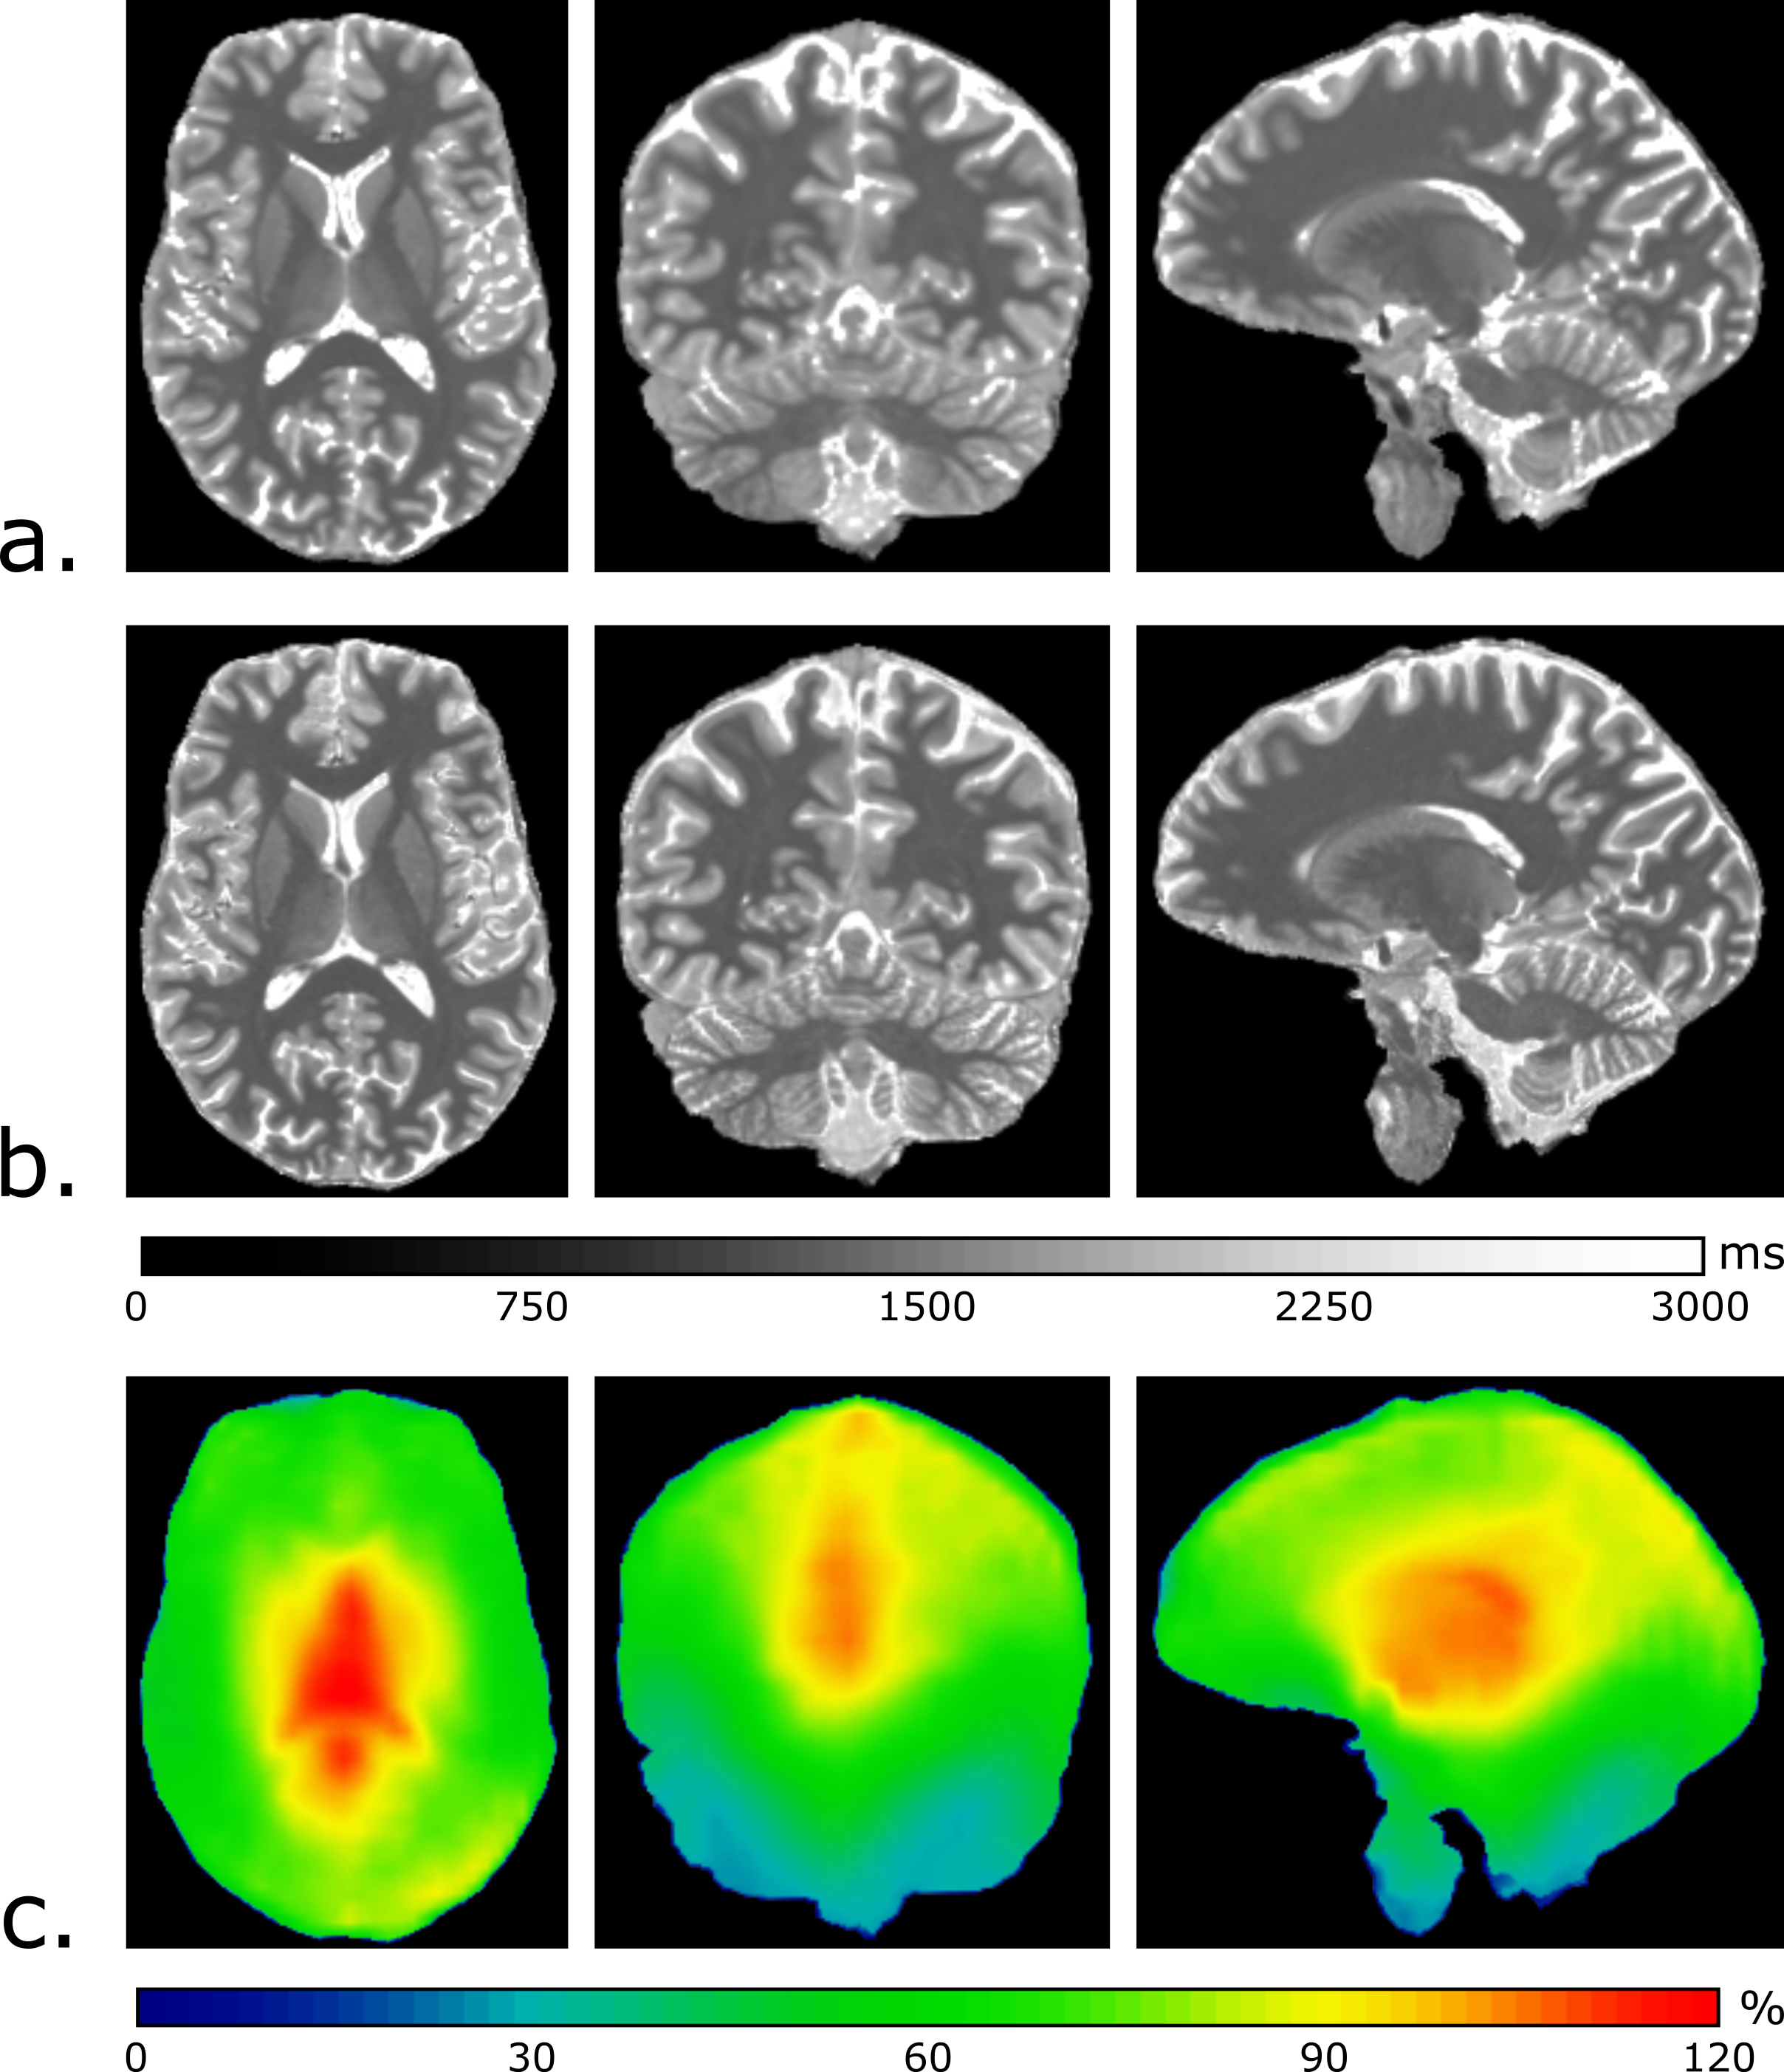
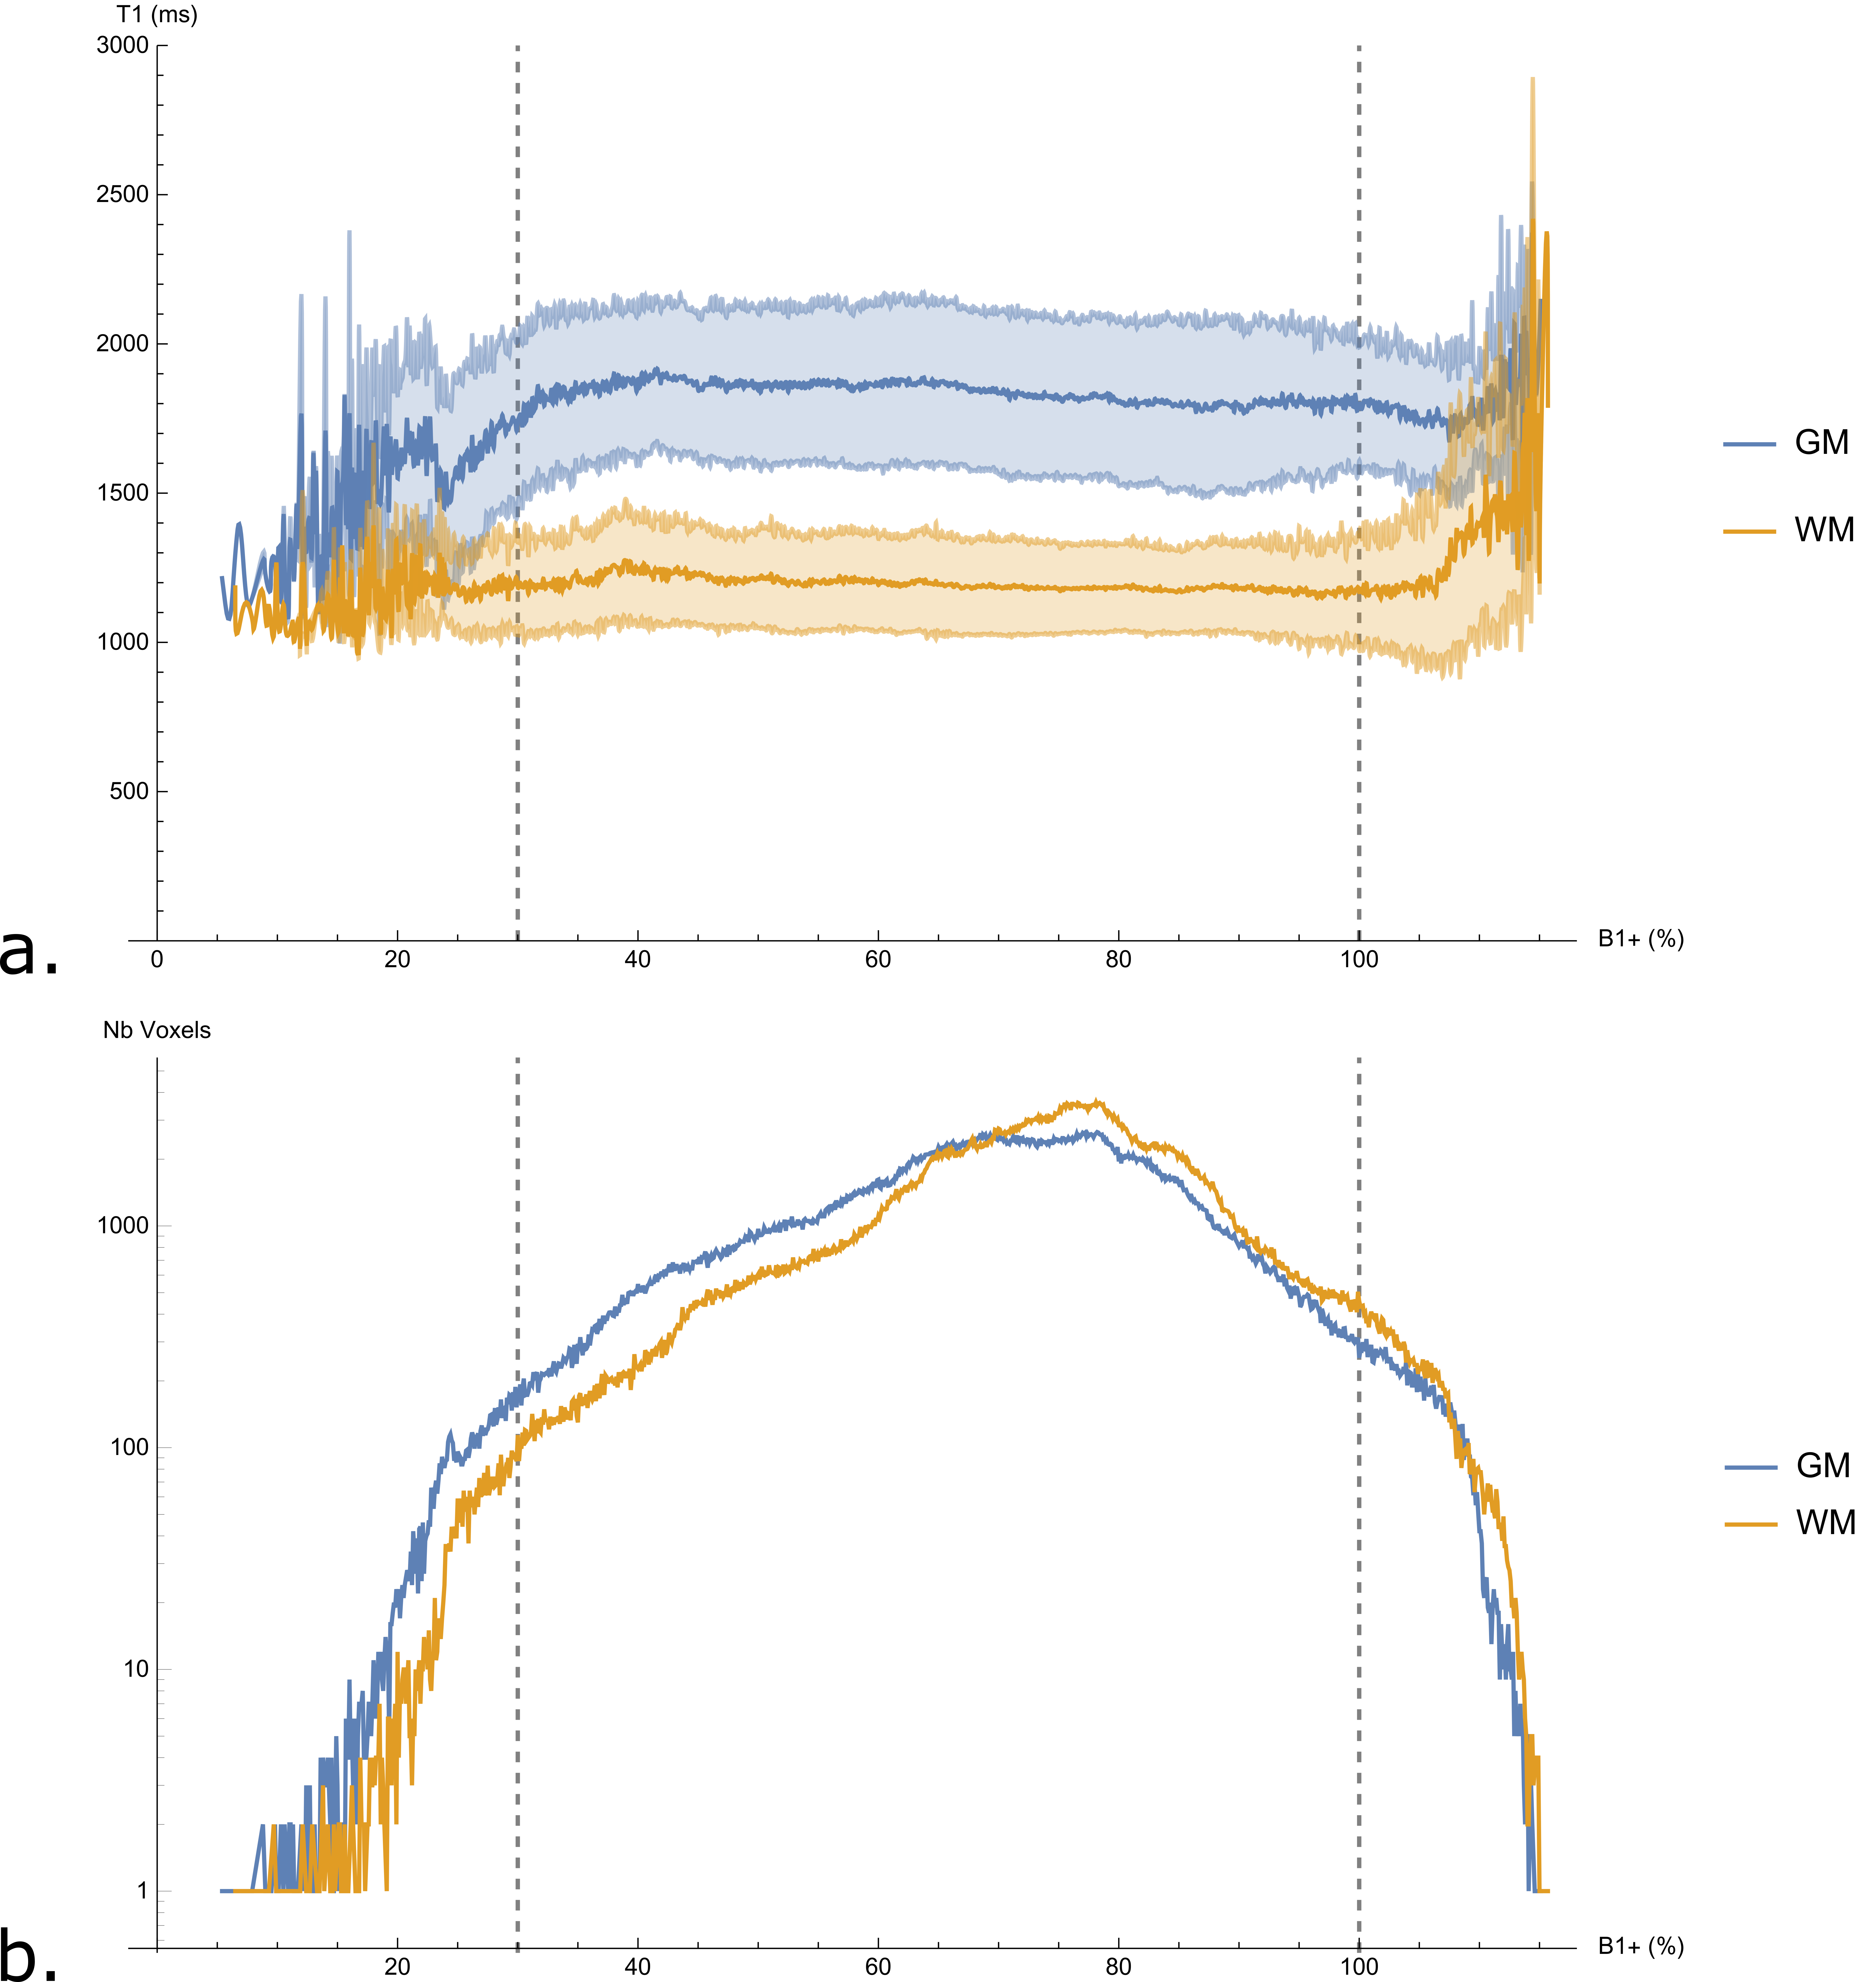
Examples of in-vivo T1 maps and B1+ maps obtained with the FLAWS, MP2RAGE and SA2RAGE sequences are shown in Figure 2. The in-vivo T1 values measured with FLAWS within WM and cortical GM segmentations of one subject as a function of B1+ are reported in Figure 3a. The effect of the B1+ on T1 estimation appeared to be negligible for B1+ values within the 30%-100% range for all the volunteers. However, the T1 values tend to diverge outside of this range. Figure 3b shows that a small number of voxels are characterized by a B1+ value outside of the 30%-100% range (0.58% and 1.01% of the WM and cortical GM voxels, respectively). A qualitative assessment indicated that most of these voxels were located in areas characterized by strong susceptibility changes (near the ear canals and the frontal sinuses) or were misclassified due to skull-stripping and segmentation errors.
The average correlation between the T1 relaxation time and the B1+ was weak within the WM and cortical GM segmentations of the six volunteers (rWM=-0.026±0.021; rGM=-0.081±0.038). The correlation remains weak when computed within the 30%-100% range (rWM=-0.050±0.027; rGM=-0.100±0.032).
Discussion/Conclusion
The results of the current study showed that the CNRs between brain tissues of the bias reduced FLAWS images are equal to or higher than the ones of the bias reduced MP2RAGE sequence. In addition, it was shown that the FLAWS sequence can be used to generate T1 maps with reduced B1+ sensitivity at the field strength of 7T.In conclusion, the current study suggest that the FLAWS sequence is suitable for T1-weighted imaging and mapping providing similarly reduced B1+ sensitivity as the optimized MP2RAGE sequence, while i) overcoming the resolution and CNR constraints imposed to the MP2RAGE sequence optimized for reduced B1+ sensitivity; and ii) providing additional T1-weigthed contrasts of interest for a wide range of clinical applications [3,5].
Acknowledgements
The authors acknowledge the facilities and the scientific
and technical assistance of the National Imaging Facility at the Centre for
Advanced Imaging, University of Queensland, Australia. The authors would also
like to thank Siemens Healthcare for providing the MP2RAGE WIP 944 that allowed
to perform the experiments on the scanner. Finally, the authors thank the
“Region Bretagne” which partially funded the current study.
References
[1] Marques JP, Kober T, Krueger G, van der Zwaag W, Van de Moortele P-F, Gruetter R. MP2RAGE, a self bias-field corrected sequence for improved segmentation and T1-mapping at high field. Neuroimage 2010;49:1271–81. doi:10.1016/j.neuroimage.2009.10.002.
[2] Marques JP, Gruetter R. New Developments and Applications of the MP2RAGE Sequence - Focusing the Contrast and High Spatial Resolution R1 Mapping. PLoS One 2013;8:e69294. doi:10.1371/journal.pone.0069294.
[3] Tanner M, Gambarota G, Kober T, Krueger G, Erritzoe D, Marques JP, et al. Fluid and white matter suppression with the MP2RAGE sequence. J Magn Reson Imaging 2012;35:1063–70. doi:10.1002/jmri.23532.
[4] Eggenschwiler F, Kober T, Magill AW, Gruetter R, Marques JP. SA2RAGE: A new sequence for fast B1+-mapping. Magn Reson Med 2012;67:1609–19. doi:10.1002/mrm.23145.
[5] Beaumont J, Saint-Jalmes H, Acosta O, Kober T, Tanner M, Ferré JC, et al. Multi T1-weighted contrast MRI with fluid and white matter suppression at 1.5 T. Magn Reson Imaging 2019;63:217–25. doi:10.1016/J.MRI.2019.08.010.
[6] Wright PJ, Mougin OE, Totman JJ, Peters AM, Brookes MJ, Coxon R, et al. Water proton T1 measurements in brain tissue at 7, 3, and 1.5T using IR-EPI, IR-TSE, and MPRAGE: results and optimization. Magn Reson Mater Physics, Biol Med 2008;21:121–30. doi:10.1007/s10334-008-0104-8.
[7] Fischl B. FreeSurfer. Neuroimage 2012;62:774–81. doi:10.1016/j.neuroimage.2012.01.021.
Figures