3706
High resolution multi T1-weighted contrast with reduced B1 sensitivity using the FLAWS sequence at 7T1Univ Rennes, CRLCC Eugene Marquis, Inserm, LTSI-UMR 1099, F-35000 Rennes, France, 2The Australian e-Health Research Centre, CSIRO, Brisbane, Australia, 3Univ Rennes, Inria, CNRS, Inserm, IRISA, EMPENN ERL U-1228, F-35000 Rennes, France, 4CHU Rennes, Department of Neuroradiology, F35033 Rennes, France, 5Data 61, CSIRO, Brisbane, Australia
Synopsis
Recent studies showed that the FLAWS sequence provides multiple co-registered T1-weighted contrasts of the brain that exhibit reduced B1 sensitivity. In particular, the FLAWS sequence allows for the generation of a standard anatomical contrast, a contrast with WM signal suppression and a GM-specific contrast. This study introduces a combination of FLAWS images to generate a new contrast that may be suitable for the detection of brain lesions at 7T. While the preliminary results of this study are promising, a further validation is required by imaging subjects with lesions and comparing the new FLAWS contrast with other MR sequences.
Introduction
The increased signal available at 7T magnetic resonance (MR) imaging has significant clinical potential in the study of human brain structures, enabling improvements to resolution and/or signal to noise ratio of the acquired data [1]. However, 7T MR imaging is characterized by an increased B1 sensitivity which can affect image quality and interpretation.Recent studies showed that the FLAWS sequence [2], derived from the MP2RAGE sequence [3], provides multiple co-registered T1-weighted contrasts of the brain, with reduced B1 sensitivity [4,5]. Specifically, voxel-wise combinations of the FLAWS acquired images, named FLAWS1 and FLAWS2, allow to generate bias reduced FGATIR-like contrasts, characterized by a suppression of the WM signal, and MPRAGE-like contrasts [4], as well as bias reduced DIR-like contrasts that could be of interest for the detection of brain lesions [5,6].
In this context, the current study aims at providing a new FLAWS contrast, inspired by the T2-weighted FLAIR contrast [7], that could facilitate the detection of brain lesions using the FLAWS sequence.
Materials and methods
The T2-weighted FLAIR contrast is characterized by a signal increasing when the T1 and T2 relaxation times of brain tissue increase, with a suppression of the cerebrospinal fluid (CSF) signal [7]. The following equation allows to obtain a new FLAWS T1-weighted contrast, named the “FLAWS fluid nulled kontrast” (FLAWS-funk). Its signal is increasing when the T1 relaxation time of brain tissue increase, while the CSF signal is suppressed: $$S_{funk}=\frac{S1+2λ S2}{max(S1,λ S2)}$$With S1 (resp. S2) the signal of FLAWS1 (resp. FLAWS2) and λ a regularization parameter used to determine the T1 relaxation time from which the FLAWS-funk signal should be suppressed. As FLAWS-funk is generated from a ratio of the FLAWS1 and FLAWS2 signals, its signal is characterized by a reduced B1 sensitivity and an independence to M0 and T2* [3]. An evaluation of the FLAWS-funk signal expression showed that the signal to noise ratio (SNR) of white matter (WM) and gray matter (GM) should be higher in FLAWS-funk than in FLAWS1 and FLAWS2 (results not shown).In the current study, the value of λ was determined to make the FLAWS-funk signal decreasing from the cutoff relaxation time T1C=2292ms, corresponding to the mean plus one standard deviation of the longest T1 among the T1 of WM, juxtacortical, leukocortical and intracortical lesions [8].
FLAWS-funk images of lesions were simulated using Bloch equations from partial volume (PV) maps of brain tissues provided by BrainWeb [9]. Lesions were simulated with different severities using the definition of lesion severity introduced in [10].
After obtaining written informed consent, in-vivo experiments were performed on six healthy volunteers (age: 21-48 years old, 2 females) with a 7T whole body MRI research scanner (Siemens Healthcare, Erlangen, Germany) equipped with a 32 channel head coil (Nova Medical, Wilmington, USA). The FLAWS sequence was acquired with parameters optimized in the current study (TR=5s, TI1/TI2=0.64s/1.43s, α1/α2=4°/8°, 0.8mm isotropic resolution, matrix 240×240×192, acquisition time: 10mins). The optimization was performed with a method previously used for 1.5T FLAWS imaging [4].
The contrast (CN) and contrast to noise ratio (CNR) per unit of time between brain tissues was measured in FLAWS images within regions of interests (ROIs) defined in [2]. The CN and CNR per unit of time were measured using their standard equations that can be found in [3]. The SNR of the FLAWS-funk signal was measured in brain tissues as a ratio of the mean ROI signal divided by its standard deviation.
Results
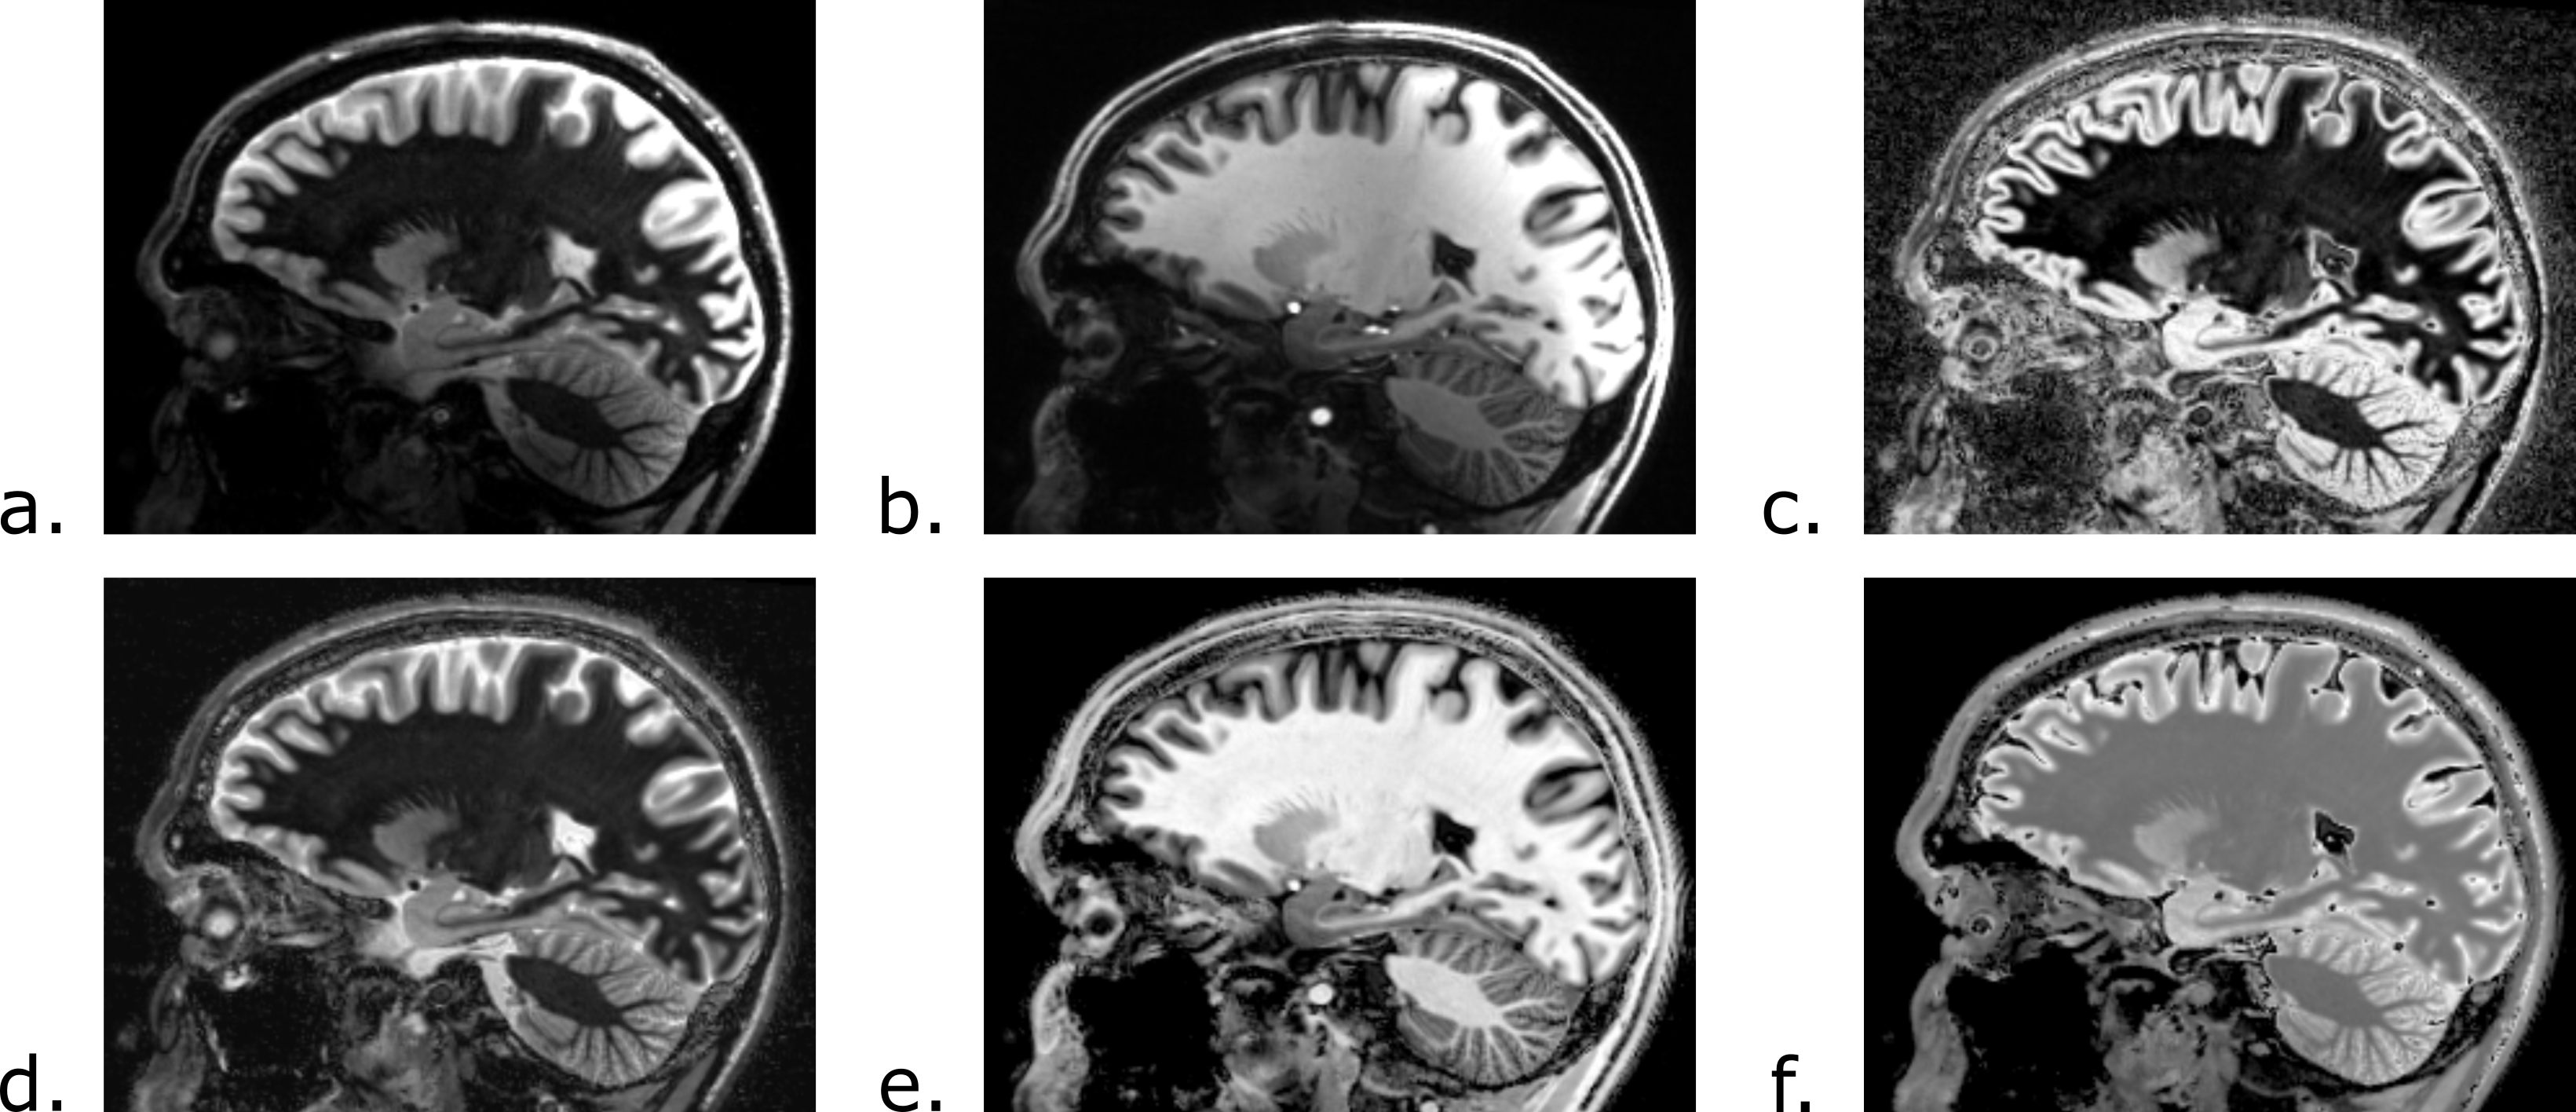
Simulations of the FLAWS-funk signal with the Bloch equations indicate that λ should have a value of 1.63 to suppress the FLAWS-funk signal from T1C=2292ms. FLAWS signal simulations, presented in Figure 1, show that the FLAWS-funk signal is different from the other bias reduced FLAWS signals and is characterized by properties similar to the FLAIR signal. The simulation of FLAWS-funk images using the BrainWeb PV maps also suggests that FLAWS-funk could be of interest to facilitate lesion detection from FLAWS imaging, as shown in Figure 2.In-vivo imaging confirms that the new FLAWS-funk contrast is characterized by a reduced B1 sensitivity and is different from the other FLAWS contrasts, as shown in Figure 3 and Figure 4. Table 1 shows that the SNR measured in-vivo within WM and GM increases in FLAWS-funk compared to FLAWS1 and FLAWS2. The results presented in Table 1 also indicate that FLAWS-funk is characterized by a CSF suppressed signal and a low CN between WM and GM.
Discussion/Conclusion
Images at 7T are typically affected by an increase B1 sensitivity. In this study, we propose a new high resolution contrast, FLAWS-funk, which is inspired by the T2-weighted FLAIR contrast but exhibits reduced B1 sensitivity due to the properties inherent to the FLAWS images [3,4]. The contrast generated by FLAWS-funk can be adjusted with a parameter λ, which was optimized to visualize brain lesions as hyperintense as per T2-weighted FLAIR. Moreover, no extra acquisition time is required to generate FLAWS-funk images. While the preliminary results of the current study are promising, a further validation is required by imaging subjects with lesions as well as comparing FLAWS-funk images to images provided by other MR sequences.Acknowledgements
The authors acknowledge the facilities and the scientific and technical assistance of the National Imaging Facility at the Centre for Advanced Imaging, University of Queensland, Australia. The authors would also like to thank Siemens Healthcare for providing the MP2RAGE WIP 944 that allowed to perform the experiments on the scanner. Finally, the authors thank the “Region Bretagne” which partially funded the current study.References
[1] Trattnig S, Springer E, Bogner W, Hangel G, Strasser B, Dymerska B, et al. Key clinical benefits of neuroimaging at 7 T. Neuroimage 2018;168:477–89. doi:10.1016/j.neuroimage.2016.11.031.
[2] Tanner M, Gambarota G, Kober T, Krueger G, Erritzoe D, Marques JP, et al. Fluid and white matter suppression with the MP2RAGE sequence. J Magn Reson Imaging 2012;35:1063–70. doi:10.1002/jmri.23532.
[3] Marques JP, Kober T, Krueger G, van der Zwaag W, Van de Moortele P-F, Gruetter R. MP2RAGE, a self bias-field corrected sequence for improved segmentation and T1-mapping at high field. Neuroimage 2010;49:1271–81. doi:10.1016/j.neuroimage.2009.10.002.
[4] Beaumont J, Saint-Jalmes H, Acosta O, Kober T, Tanner M, Ferré JC, et al. Multi T1-weighted contrast MRI with fluid and white matter suppression at 1.5 T. Magn Reson Imaging 2019;63:217–25. doi:10.1016/J.MRI.2019.08.010.
[5] Marques JP, Gruetter R. New Developments and Applications of the MP2RAGE Sequence - Focusing the Contrast and High Spatial Resolution R1 Mapping. PLoS One 2013;8:e69294. doi:10.1371/journal.pone.0069294.
[6] Urushibata Y, Kuribayashi H, Fujimoto K, Kober T, Grinstead JW, Isa T, et al. Advantages of fluid and white matter suppression (FLAWS) with MP2RAGE compared with double inversion recovery turbo spin echo (DIR-TSE) at 7T. Eur J Radiol 2019;116:160–4. doi:10.1016/j.ejrad.2019.04.019.
[7] De Coene B, Hajnal J V, Gatehouse P, Longmore DB, White SJ, Oatridge A, et al. MR of the brain using fluid-attenuated inversion recovery (FLAIR) pulse sequences. AJNR Am J Neuroradiol 1992;13:1555–64.
[8] Beck ES, Sati P, Sethi V, Kober T, Dewey B, Bhargava P, et al. Improved Visualization of Cortical Lesions in Multiple Sclerosis Using 7T MP2RAGE. Am J Neuroradiol 2018;39:459–66. doi:10.3174/ajnr.A5534.
[9] Cocosco CA, Kollokian V, Kwan RK-S, Pike GB, Evans AC. BrainWeb: Online Interface to a 3D MRI Simulated Brain Database. Neuroimage 1997;5:425.
[10] Zhan W, Zhang Y, Mueller SG, Lorenzen P, Hadjidemetriou S, Schuff N, et al. Characterization of white matter degeneration in elderly subjects by magnetic resonance diffusion and FLAIR imaging correlation. Neuroimage 2009;47:T58–65. doi:10.1016/J.NEUROIMAGE.2009.02.004.
[11] O ’brien KR, Kober T, Hagmann P, Maeder P, Marques J, Lazeyras F, et al. Robust T1-Weighted Structural Brain Imaging and Morphometry at 7T Using MP2RAGE 2014. doi:10.1371/journal.pone.0099676.
Figures