3705
Fat Suppressed Magnetization Transfer Contrast Imaging Near Metal1Electrical Engineering, Stanford University, Stanford, CA, United States, 2Radiology, Stanford University, Stanford, CA, United States, 3Bioengineering, Stanford University, Stanford, CA, United States
Synopsis
Imaging with fat suppression near metal-induced off-resonance has limited options due to the spectral ambiguity between fat and water. We propose Magnetization Transfer (MT) as an alternative for fat suppressed imaging near metal. We demonstrate that fat suppressed images can be efficiently obtained by modifying slice interleaving of conventional multispectral acquisitions that utilize fast spin echo readouts. These high RF power fast spin echo readouts act as MT preparation pulses for adjacent slices. Furthermore, we show that the image contrast can be predicted by Bloch simulations that incorporate the two-pool model and validate the simulations with in-vivo measurements.
Introduction
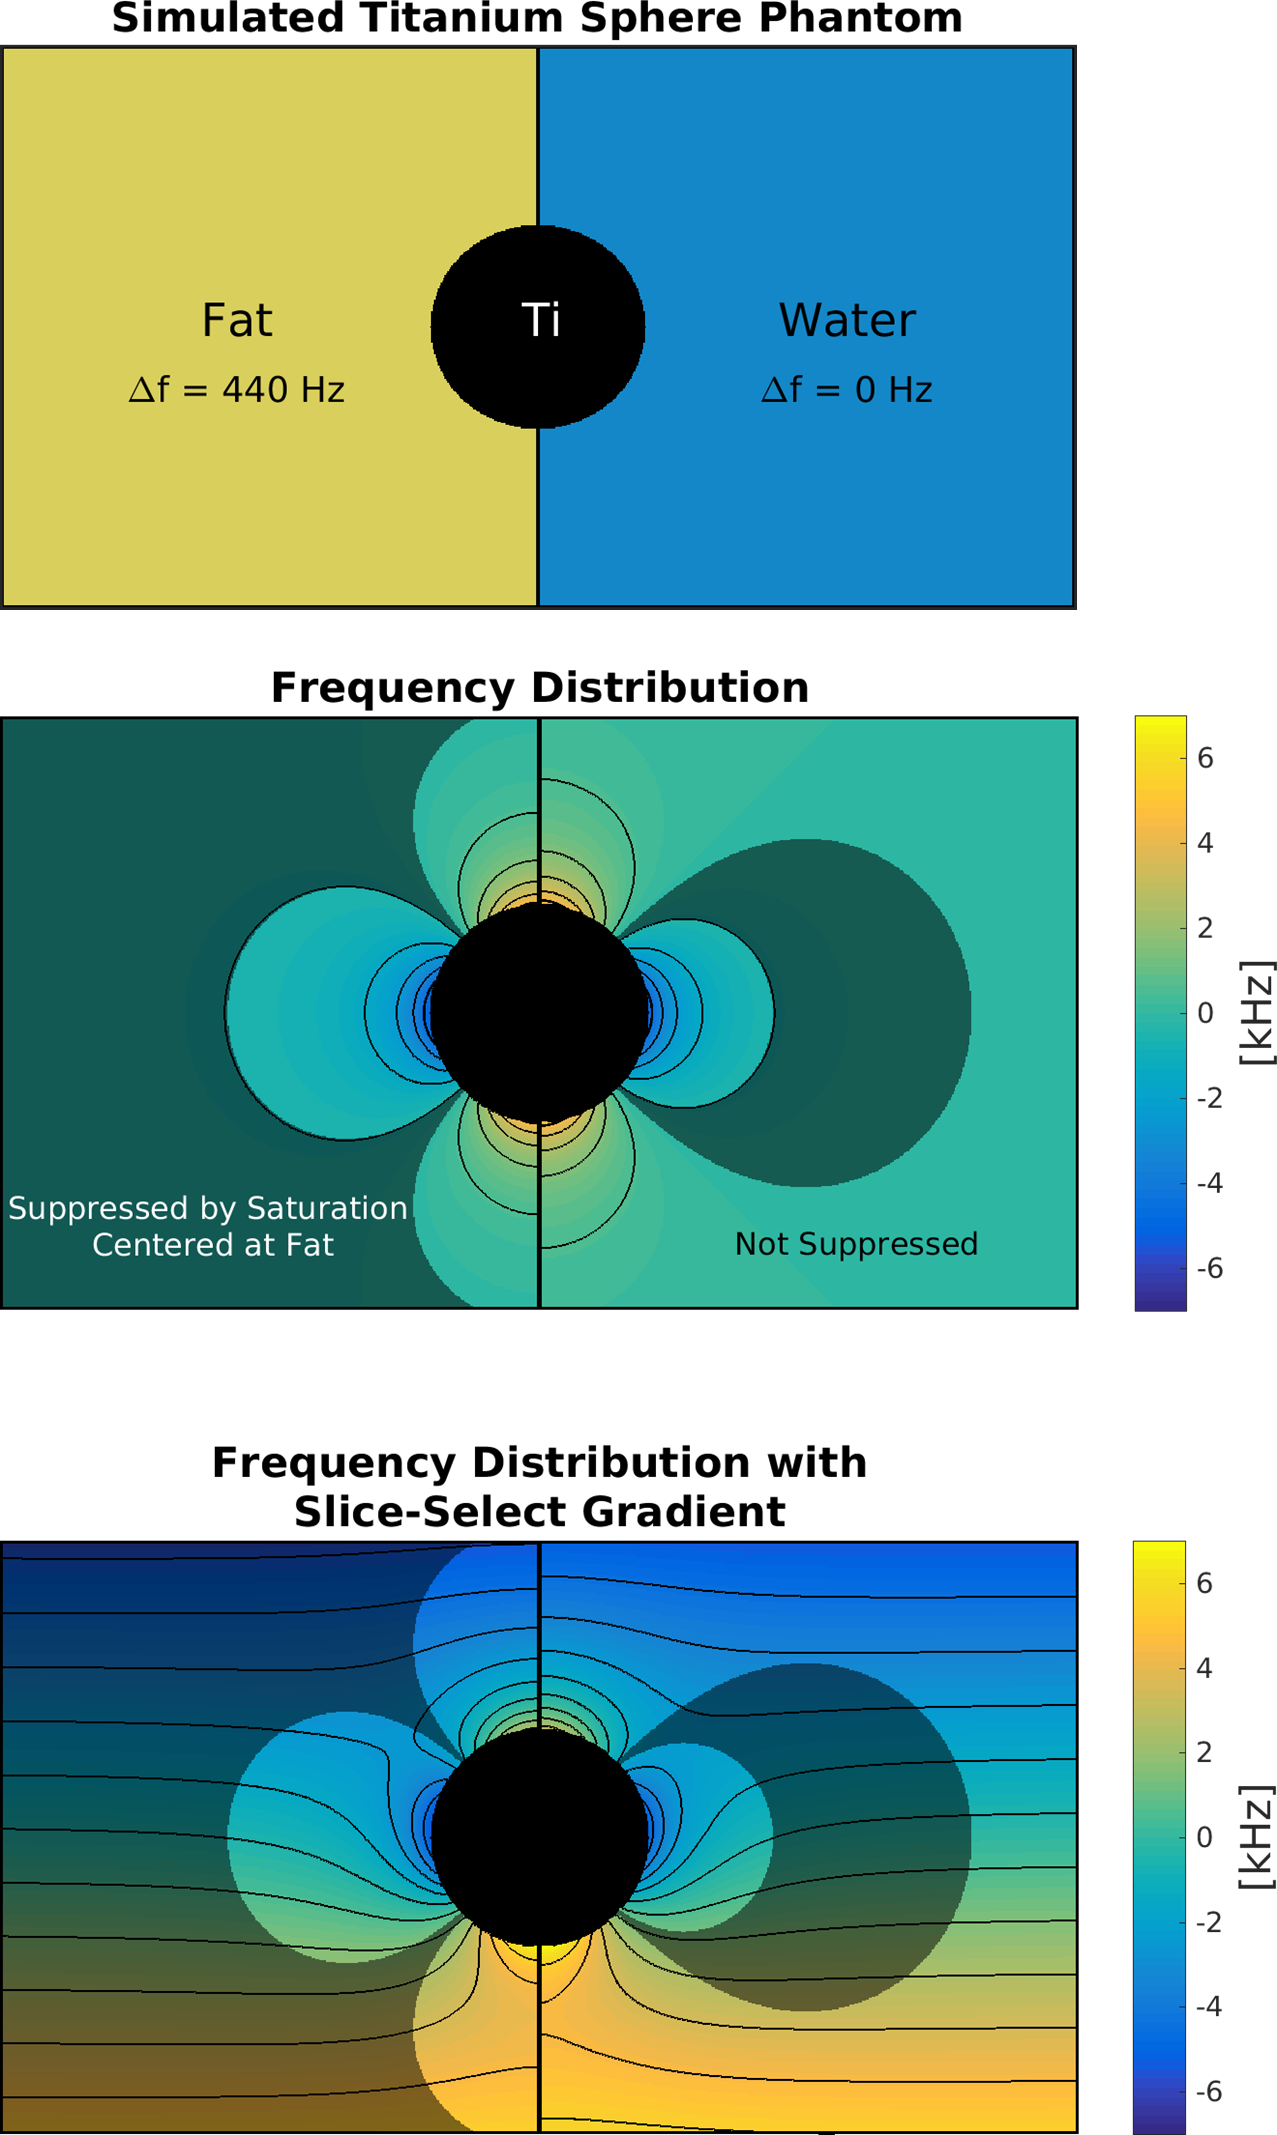
Fat suppressed imaging in multispectral acquisitions such as MAVRIC-SL1 and SEMAC2 have limited options. Methods that exploit the spectral separation of fat and water leave residual fat and suppress water, shown in Figure 1. T1 inversion is undesirable for suppressing fat during Gadolium (Gd) injection since inversion may suppress regions with contrast uptake3.We propose Magnetization Transfer (MT) as an alternative for fat suppressed imaging near metal. Multispectral sequences use long FSE readouts which impart MT contrast in adjacent slices due to off-resonance saturation from slice-select gradients and high RF power4. Since MT exchange between fat and proteins is negligible compared to water and proteins5, 6, the difference of an MT weighted (MTW) and MT unweighted (MTU) acquisition suppresses fat signal.
With a modified slice interleaving, MTW and MTU images can be acquired using FSE readouts as pseudo MT preparation pulses. The resulting MT contrast is dependent on many parameters including RF power, TR, and slice order. Sequence parameters must also suppress susceptibility induced off-resonance artifacts while respecting SAR limits and possible heating near the metallic implant. We show that an EPG simulation incorporating the two-pool model7 can estimate MT contrast obtained from slice interleaving and guide selection of sequence parameters. We also present preliminary in vivo fat suppressed scans using the MT effect in a volunteer with metallic screws.
Methods
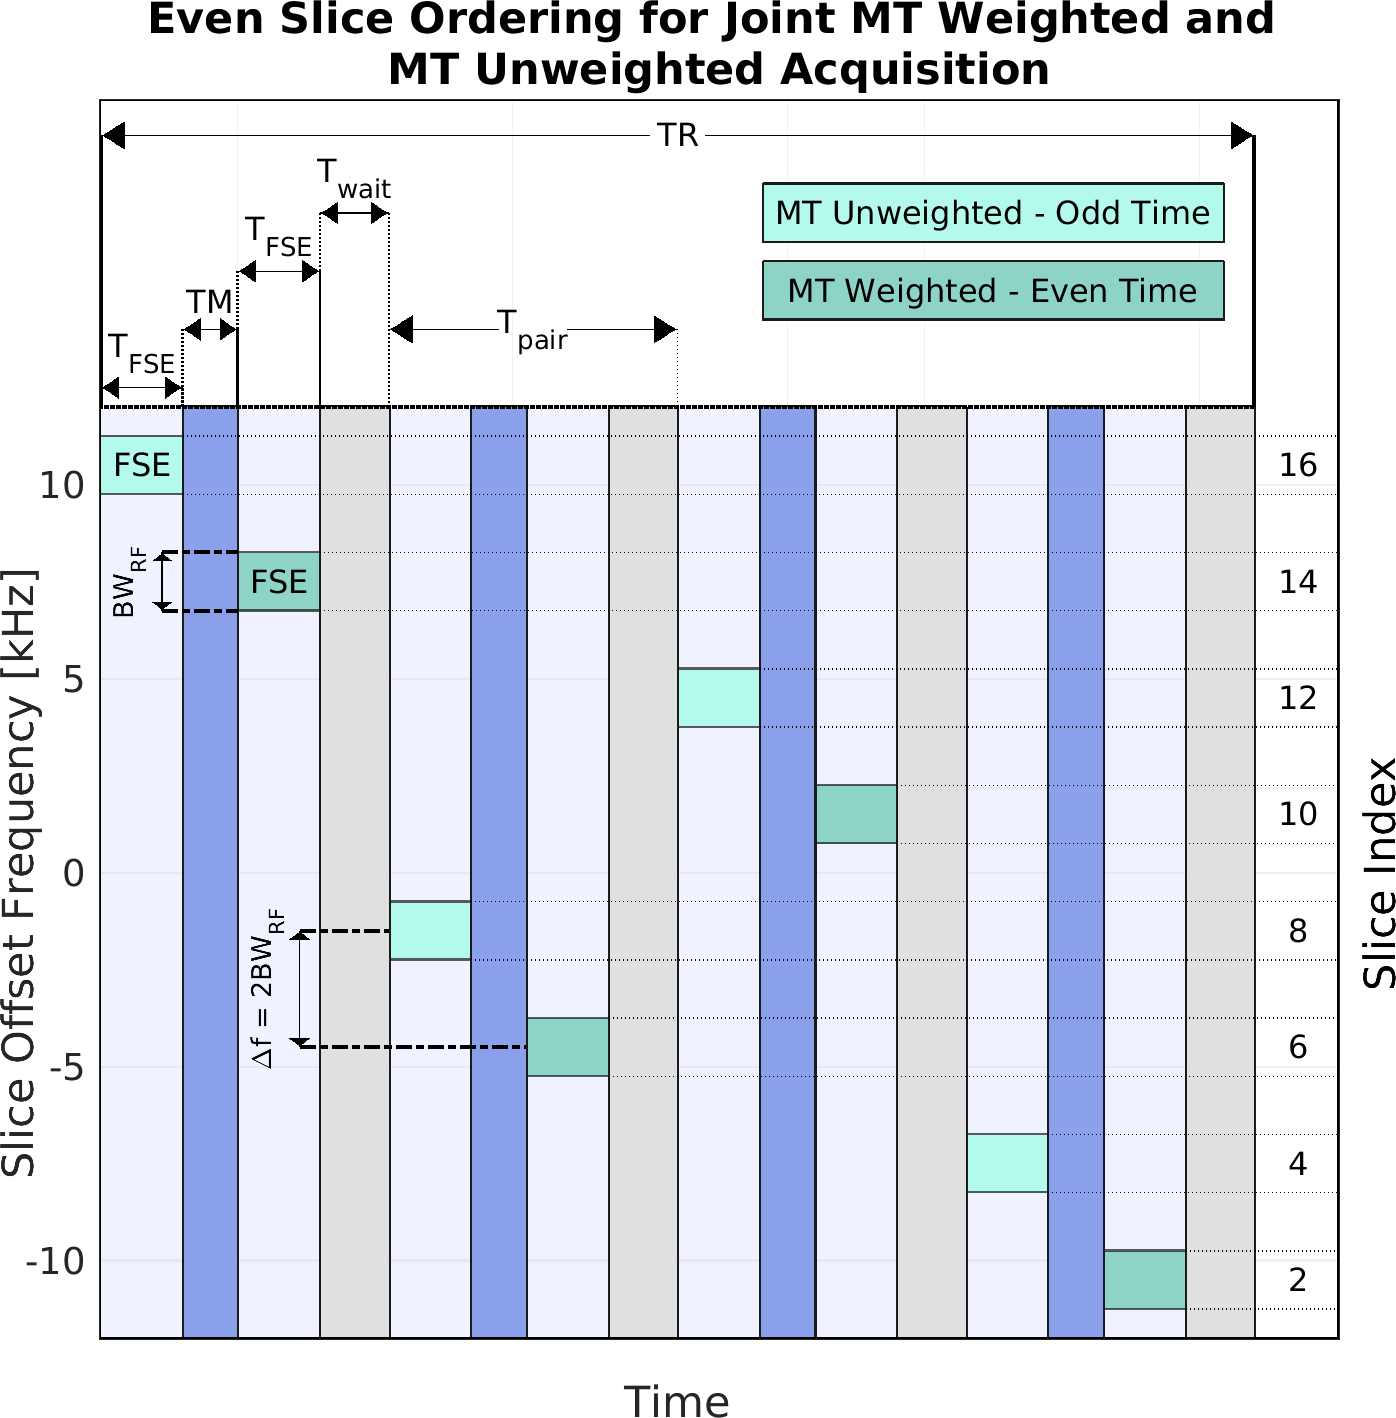
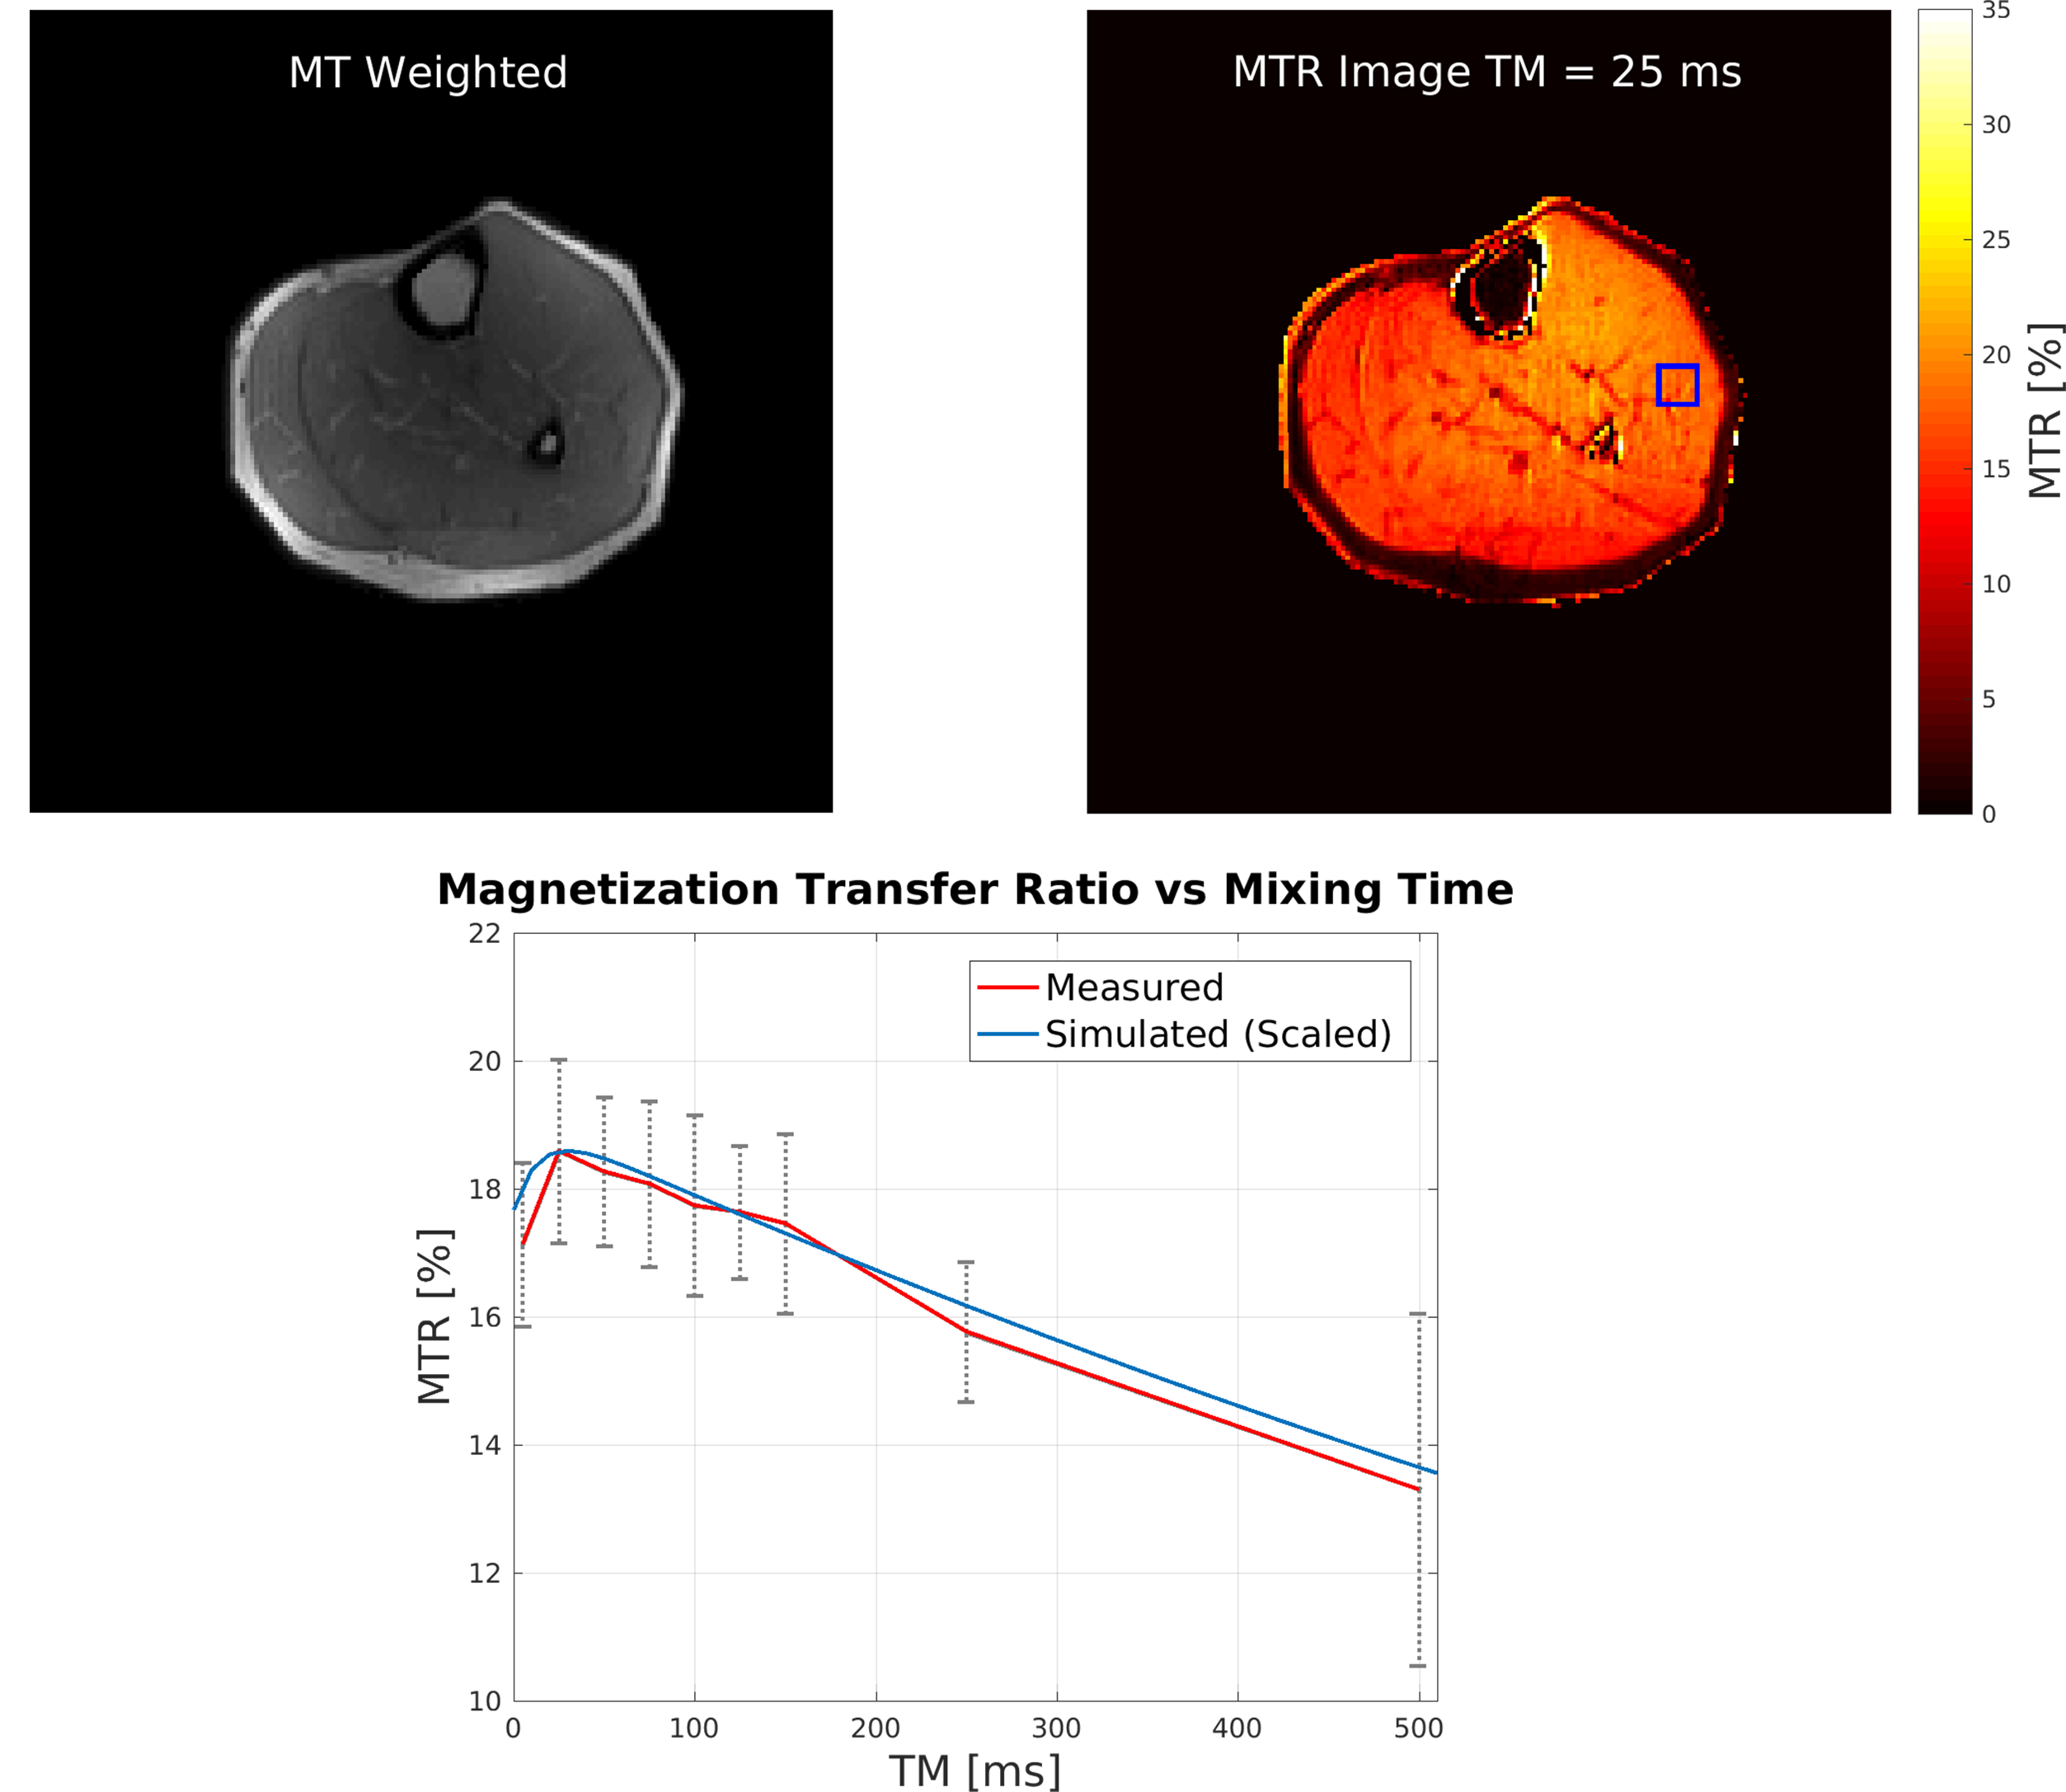
We adapted the slice ordering in a SEMAC acquisition split into even and odd slices. The slice ordering for even slices is shown in Figure 2. To obtain full MTW and MTU volumes, the acquisition is performed in the forward direction and repeated with time reversal. Slices are paired with a mixing time (TM) between readouts that permits exchange between pools. The slice ordering aims for the first slice of each pair to be MT unweighted and for the second slice to be MT weighted. Each slice's primary source of MT contrast is from the readout immediately before it, but residual effects from other slices are observable at shorter TRs. For shorter TRs, MTU slices have some MT weighting due to readouts in non-adjacent slices which affects contrast uniformity across slices.First, we analyzed the effect of TM on the MT Ratio (MTR) in skeletal muscle of a healthy volunteer. A volunteer’s calf was scanned at 3T (GE Signa Premier) under IRB approval. Common sequence parameters in experiments were 1.5 kHz RF BW, ETL=28, ESP=5.8 ms, refocusing flip angle=120°, readout BW=+/-50kHz, matrix 168×168, FOV=20cm, slice thickness=4 mm, 16-channel knee coil. TM was varied from 5-500 ms in a 2-slice experiment with TR=8 seconds. The MTR in a manually chosen ROI was compared to simulations using quantitative MT parameters for muscle8. Simulations were scaled to the signal values in the experimental data.
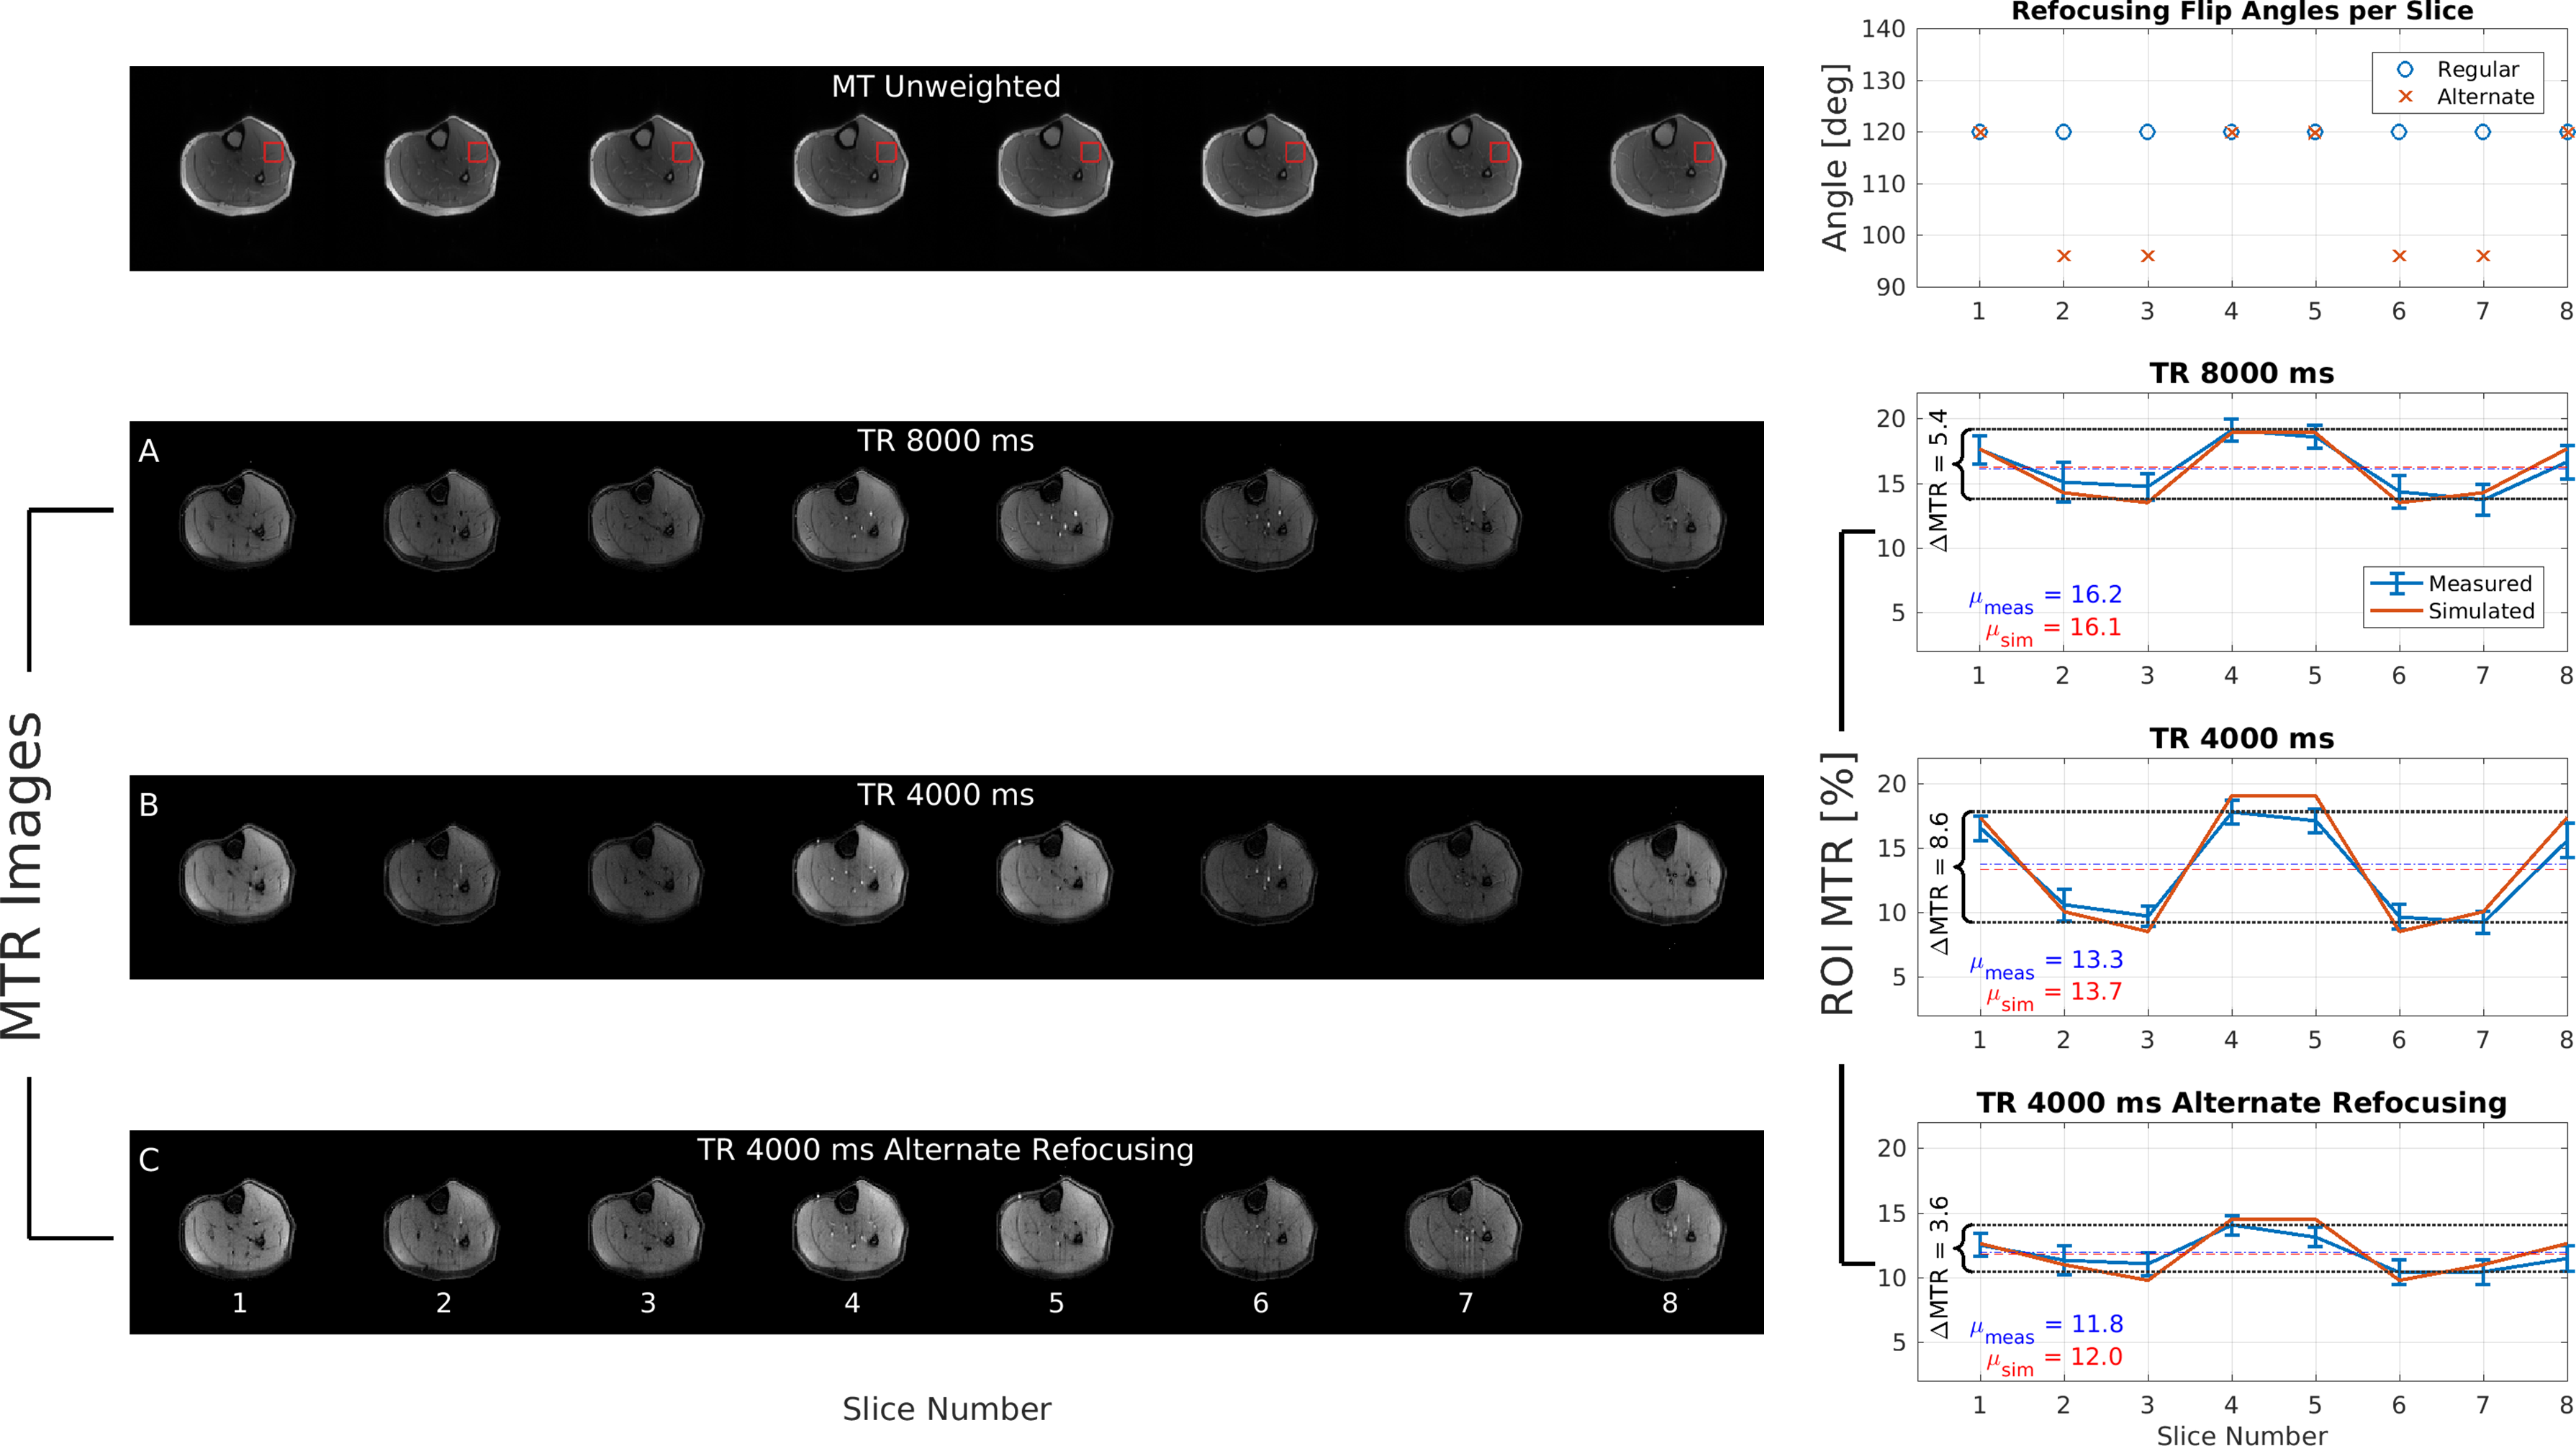
In the second experiment, we demonstrate that MT contrast uniformity is affected by TR and refocusing flip angles. Even slices using the slice ordering in Figure 2 (8 total slices) were acquired with TRs of 8 and 4 seconds, TM=100 ms. For TR=4 seconds, the acquisition was repeated with the flip angle reduced to 96° in certain slices. The flip angle reduction was determined via simulation to improve MTR uniformity.
Finally, the modified SEMAC acquisition was performed in a consenting volunteer with knee screws. Acquisition parameters: FOV=20×20 cm, matrix=192×192×16, readout BW=+/-125kHz, rfref=100°, 2×2 uniform under sampling, partial Fourier=0.6, total time 7:00, other parameters identical.
Results
In Figure 3, the mixing time that maximizes MTR (TM=30 ms) is predicted by simulation. The MTR of 18.5% indicates that significant MT contrast is created by FSE readouts. For TM > 30 ms, T1 recovery dominates residual exchange between pools which reduces MTR.In the 8-slice experiment (Figure 4), MTR is non-uniform across slices for TR=4 seconds due to incomplete recovery of magnetization from exchange in adjacent FSE readouts. For TR=8 seconds, mean MTR and MTR uniformity are improved at the cost of increased acquisition time. Both trends validate simulation results. Reducing the refocusing flip angle of certain slices improves contrast uniformity but reduces total mean MTR and SNR in slices with reduced refocusing flip angle.
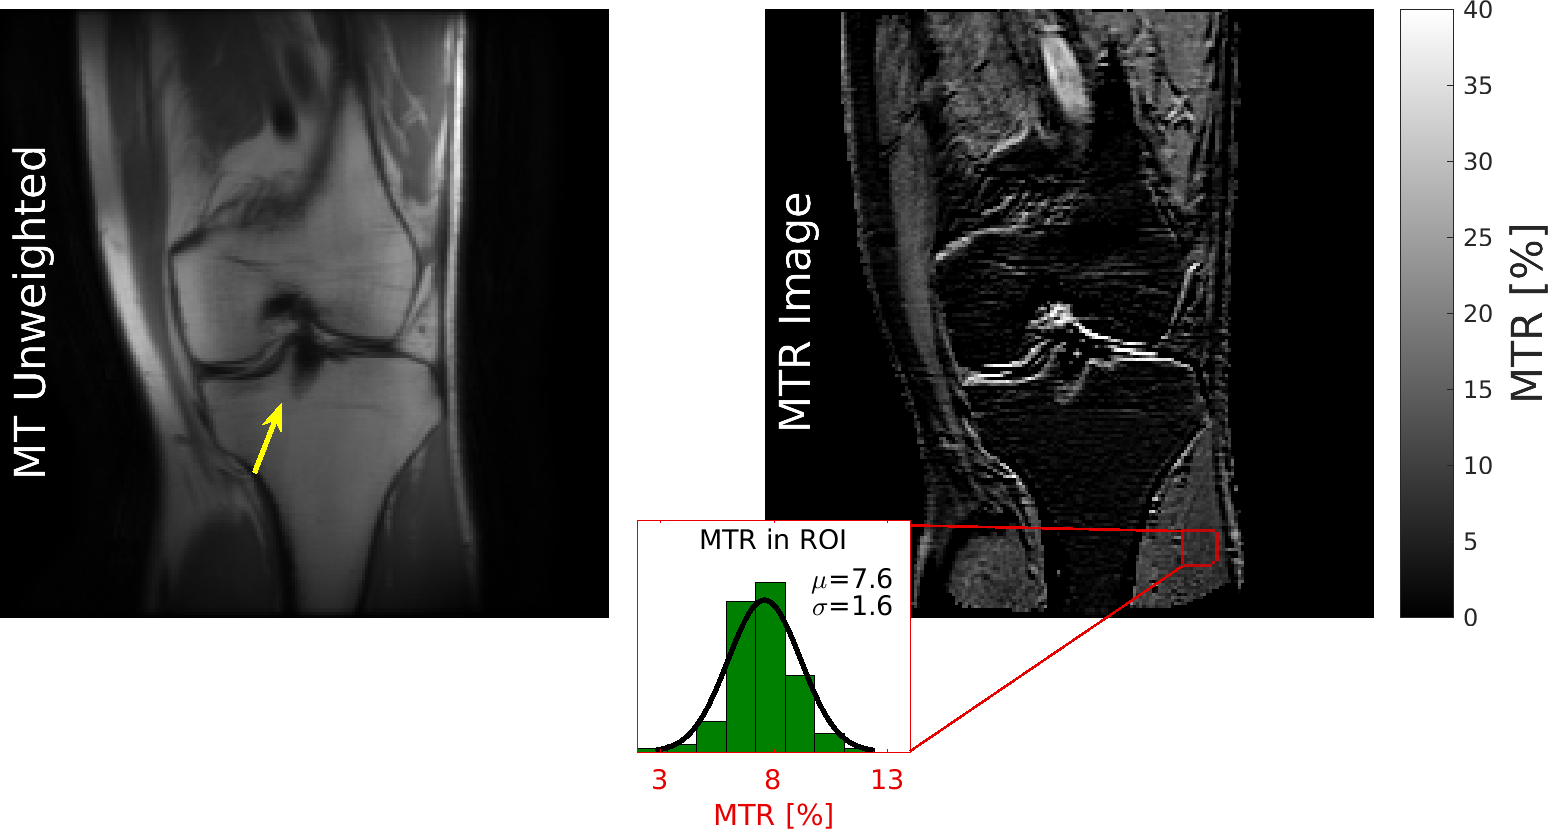
In the knee acquisition (Figure 5), bone marrow and fat are suppressed in MTR images, with some high MTR outlines in low-signal regions. SNR is reduced compared to 2D experiments due to higher readout BW, reduced refocusing flip angle, and undersampling. Larger refocusing flip angles improves MTR SNR, but also reduces contrast uniformity across slices which requires increased TR and scan time to compensate.
Discussion
The EPG-MT simulation is an approximation of the acquisition since only the center frequency of each slice is considered, neglecting the bandwidth created by slice-select gradients. Slice orderings for acquisitions with additional slices can be verified using simulation. The proposed method doubles scan time but would benefit from compressed sensing which demonstrates high acceleration for multispectral acquisitions9. The T1 contrast, which is required for visualizing Gd uptake, must still be investigated.Conclusion
Magnetization transfer effect from FSE readouts can be leveraged to obtain fat suppressed images near metal at the cost of increased scan time. The contrast is predictable by simulation and verified in vivo.Acknowledgements
R01 EB017739. GE Healthcare. Karolinska Neuro MR Physics group for pulse programming assistance.References
1. Koch K, et al. Imaging near metal with a MAVRIC-SEMAC hybrid. MRM. 2011;65(1):71-82.
2. Lu W, et al. SEMAC: Slice Encoding for Metal Artifact Correction in MRI. MRM. 2009;62(1):66-76.
3. Vanel D. MRI of bone metastases: the choice of sequence. Cancer Imaging. 2004;4(1):30-35.
4. Dixon et al. Incidental magnetization transfer contrast in standard multislice imaging. MRM. 1990;8(4):417-422.
5. Chen JH, et al. High-resolution MAS NMR spectroscopy detection of the spin magnetization exchange by cross-relaxation and chemical exchange in intact cell lines and human tissue specimens. MRM. 2006;55:1246-1256.
6. Chen JH, et al. Fat-free MRI based on magnetization exchange. MRM. 2010;63(3):713-718.
7. Malik S, et al. Extended Phase Graph Formalism for Systems with Magnetization Transfer and Exchange. MRM. 2018;80:767-779.
8. Stanisz G, et al. T1, T2 relaxation and magnetization transfer in tissue at 3T. MRM. 2005;54(3):507-512.
9. Levine E, et al. Accelerated three-dimensional multispectral MRI with robust principal component analysis for separation of on- and off-resonance signals. MRM. 2018;79:1495-1505.
Figures