3695
Optimization of adiabatic pulses for Pulsed ASL at 7T – Comparison with Pseudo-continuous ASL1Laboratory of FMRI Technology (LOFT), Mark & Mary Stevens Neuroimaging and Informatics Institute, Keck School of Medicine, University of Southern California (USC), Los Angeles, CA, United States, 2School of Information Technology and Electrical Engineering, The University of Queensland,, Brisbane, Australia, 3ARC Training Centre for Innovation in Biomedical Imaging Technology, The University of Queensland, Brisbane, Australia
Synopsis
The goal of this work was to optimize and evaluate four types of adiabatic pulses for pulsed ASL (PASL) at 7T including Hyperbolic Secant (HS), WURST, FOCI and trFOCI pulses using theoretical simulation, phantom and in vivo scans, and compare them with pseudo-continuous ASL (pCASL). PASL with WURST pulse outperformed PASL with HS, FOCI and trFOCI in terms of labeling efficiency and residual signal, and also showed higher labeling efficiency compared with pCASL, and thus is recommended for 7T perfusion measurement.
Introduction
Ultrahigh-field offers dual benefits for Arterial Spin Labeling (ASL), including increased SNR and prolonged tracer half-life (blood T1). However, challenges remain for implementing ASL, including B1/B0 inhomogeneities and RF power deposition. Due to its insensitivity to B1 inhomogeneity, adiabatic pulses are commonly used in pulsed ASL (PASL) to achieve wideband inversion. Meanwhile, pseudo-Continuous ASL (pCASL) provides a residual-free perfusion map although the labeling efficiency is affected by the B1/B0 inhomogeneities. The goal of this work was to optimize and evaluate four types of adiabatic pulses for pulsed ASL (PASL) at 7T including Hyperbolic Secant (HS)1, Wideband Uniform Rate Smooth Truncation (WURST)2, Frequency offset corrected inversion (FOCI)3 and time-resampled FOCI (trFOCI)4 pulses with simulation, phantom and in-vivo scans, and compare the perfusion measurement with pCASL.Method
1. Loss function definitionThe loss function considers two characteristics of the inversion profile: the total inversion efficiency (mean deviation from ideal inversion in the labeling region) and the uniformity (standard deviation) of the inversion band, which reflects the two terms in the loss function (Eq. 1). A pre-defined weight(w=300) was used to combine the two terms.$$Loss = Efficiency Penalty + w\times Uniformity Penalty ... ... (Eq. 1)$$
2. Parameter optimization
HS, WURST, and FOCI pulses are all defined by two parameters1,2,3. The inversion profile was simulated by Bloch equation in the 2-dimensional parameter space and the loss map was calculated.
For trFOCI which has 11 parameters4, since it is nearly impossible to traverse the 11-dimensional parameter space, a genetic algorithm modified from [4] was used for optimization. In each generation, the population was produced as mutations and two-point crossovers of the “winners” (parameters with lower loss) in the last generation. A greedy-hill-climbing method was used to further lower the loss by adjusting each parameter at one time iteratively.
For all four types of pulses, the optimizations considered B0 offsets of 300Hz/0/-300Hz linear shift in z-direction, and B1 inhomogeneity of 25%/50%/75%/100% scaling of the target B1.
3. Phantom experiments
Phantom and in-vivo experiments were performed on Magnetom Terra 7T (Siemen Healthcare, Erlangen, Germany) with 32-channel head coil (Nova Medical, MA, USA). In order to test the inversion profile, the optimized pulses were applied with corresponding gradients in the readout direction, immediately after which one slice was acquired with turbo flash (TFL) readout. The inversion thickness was set to be 70mm, 100mm, and 300mm. The sequences were tested on an oil phantom.
4. In-vivo experiments
Tested on three subjects, the optimized pulses were implemented in a Flow Attenuated Inversion Recovery sequence respectively, with a single-shot TFL readout (TR=4000ms, selective inversion thickness=100mm, non-selective inversion=300mm, TI2/TI1=1600/700ms, slice number=9, slice TR=150ms, FOV=210$$$\times $$$192.5mm, matrix size=96$$$\times $$$88, phase partial Fourier=6/8, 50 measurements for 3min22sec). Pairwise subtraction of label/control images was performed followed by averaging to generate the perfusion and CBF maps5, assuming labeling efficiency=0.95.
The pCASL imaging sequence used the same TFL readout as PASL(TR=6000ms, labeling duration=1500ms, PLD=1500ms). The perfusion and CBF maps were also calculated5, assuming labeling efficiency=0.67 based on Bloch equation simulation.
5. Labeling efficiency and residual signal estimation
For all three subjects, the average gray matter CBF was calculated for each slice and then averaged across subjects, and the relative ratio against PCASL CBF for each slice was also calculated, as well as the standard deviation (SD) of the CBF ratio across slices.
Results
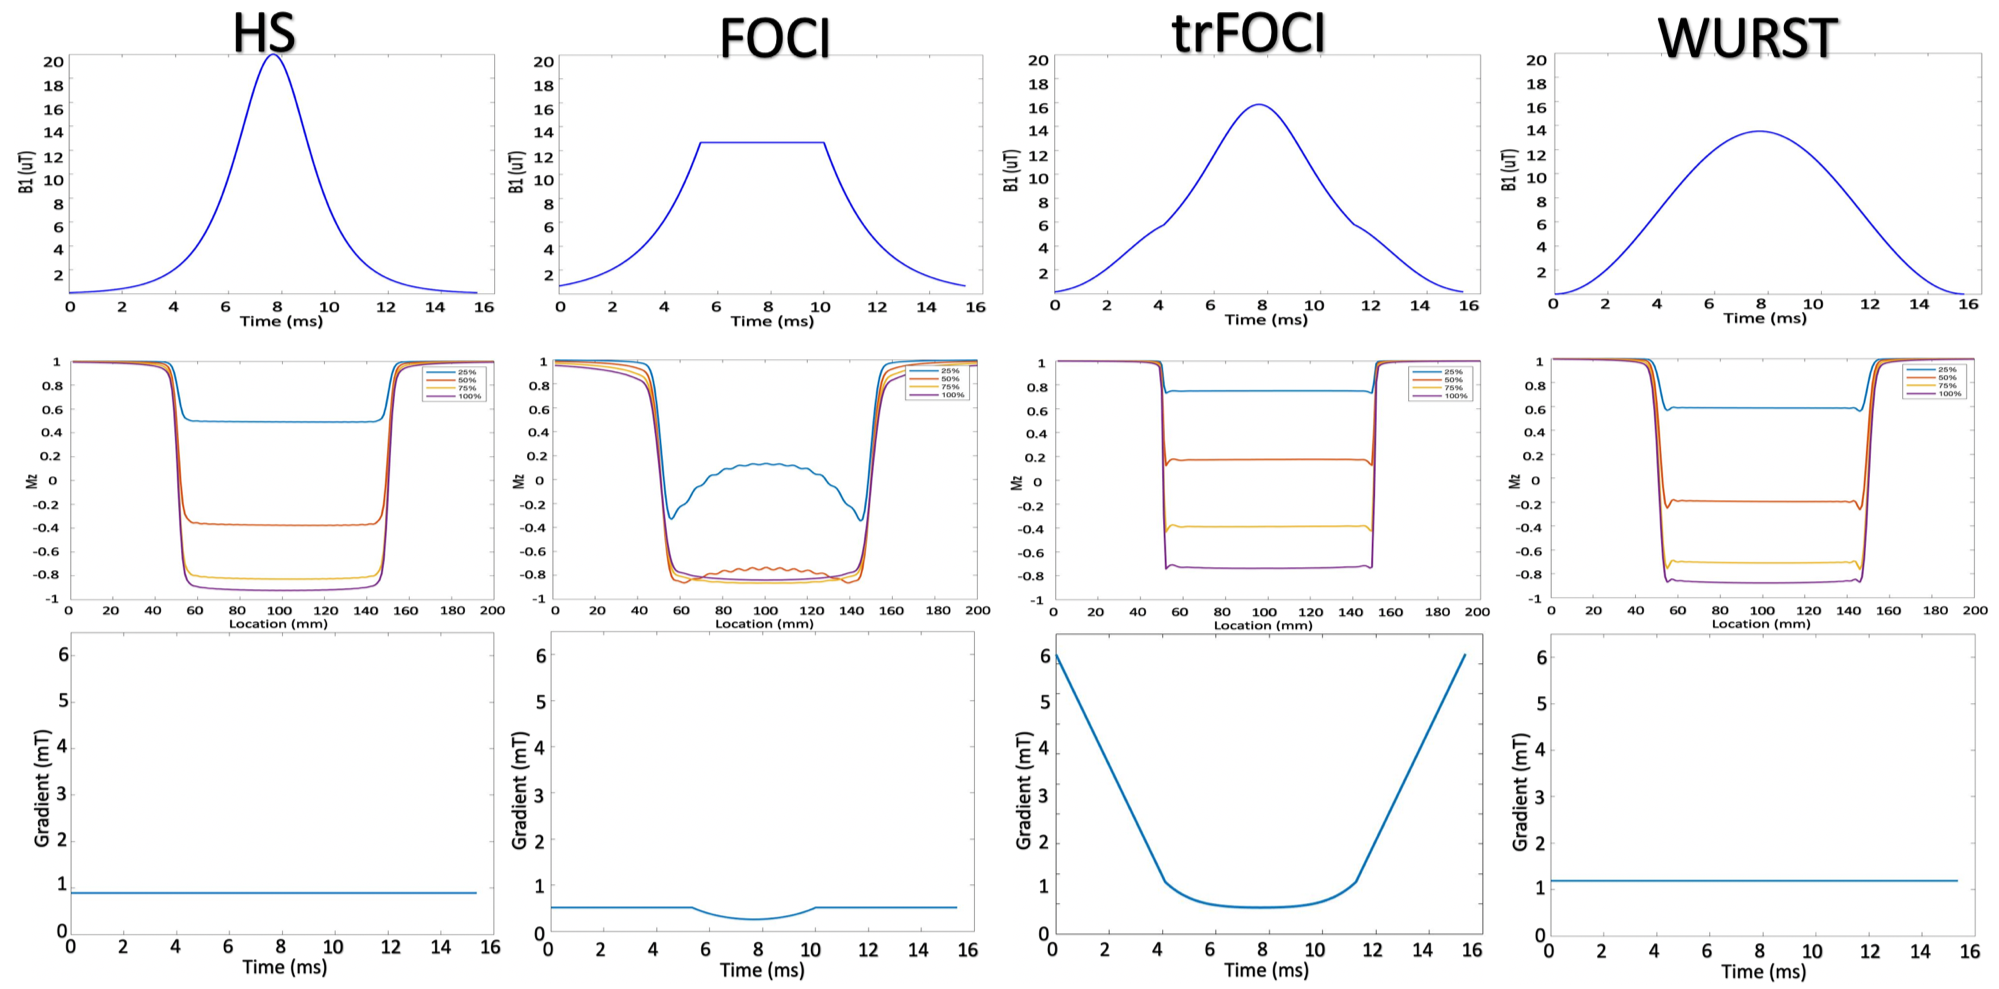
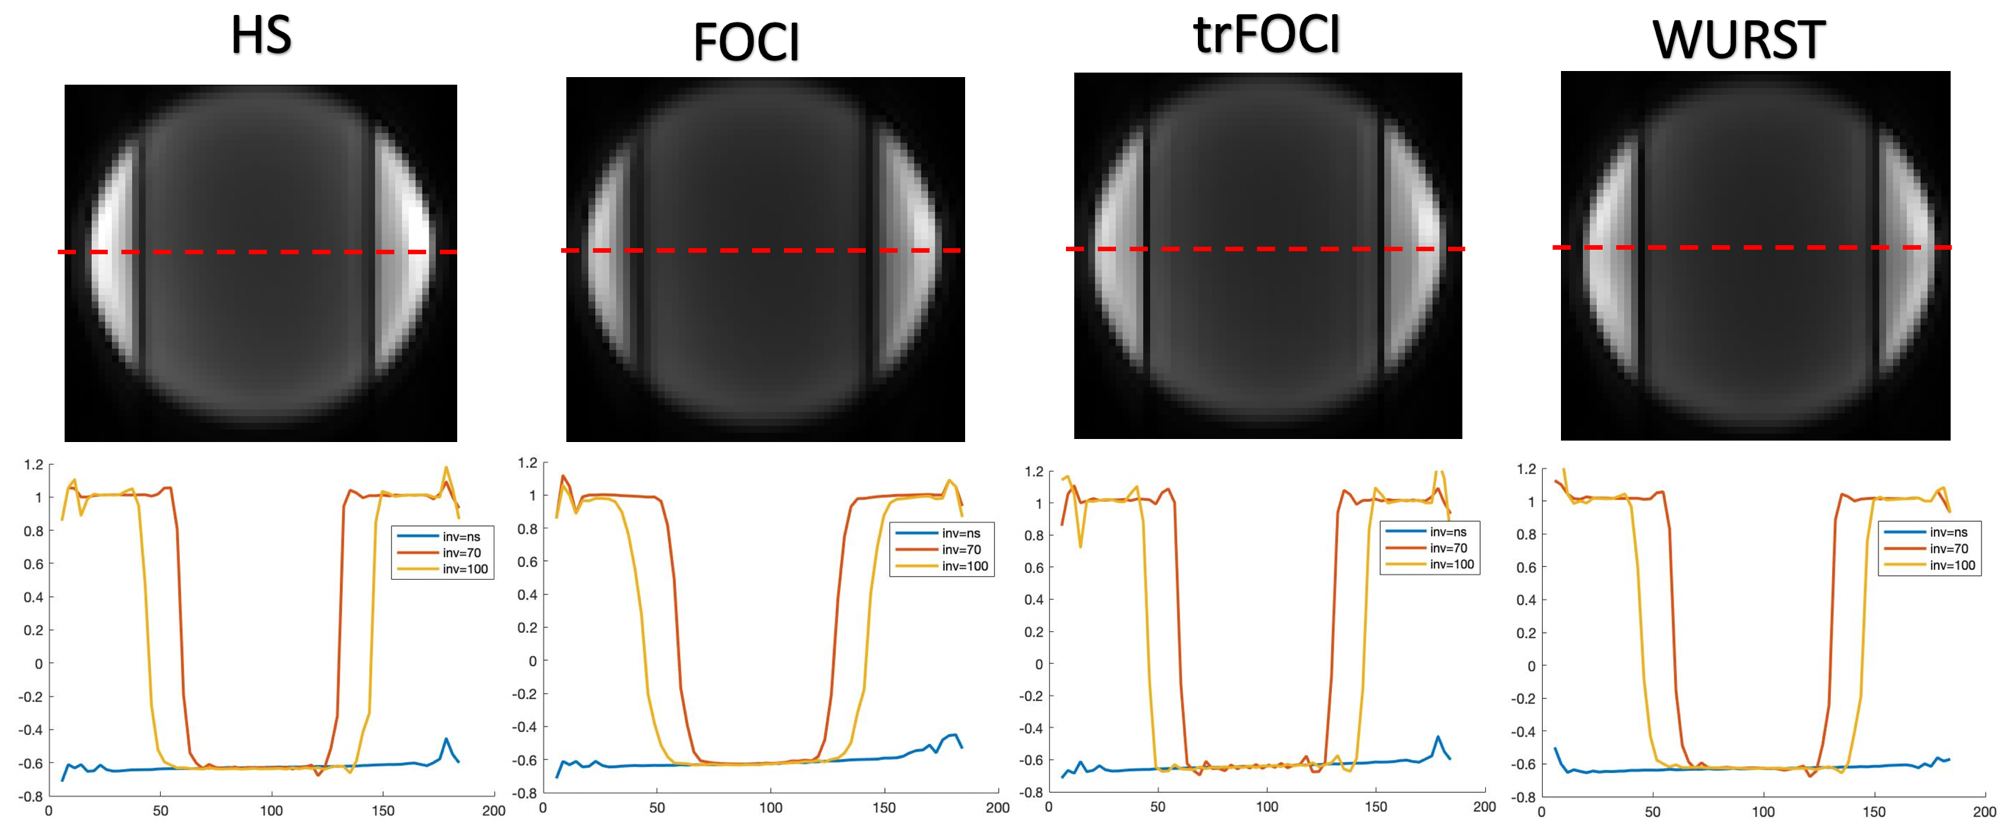
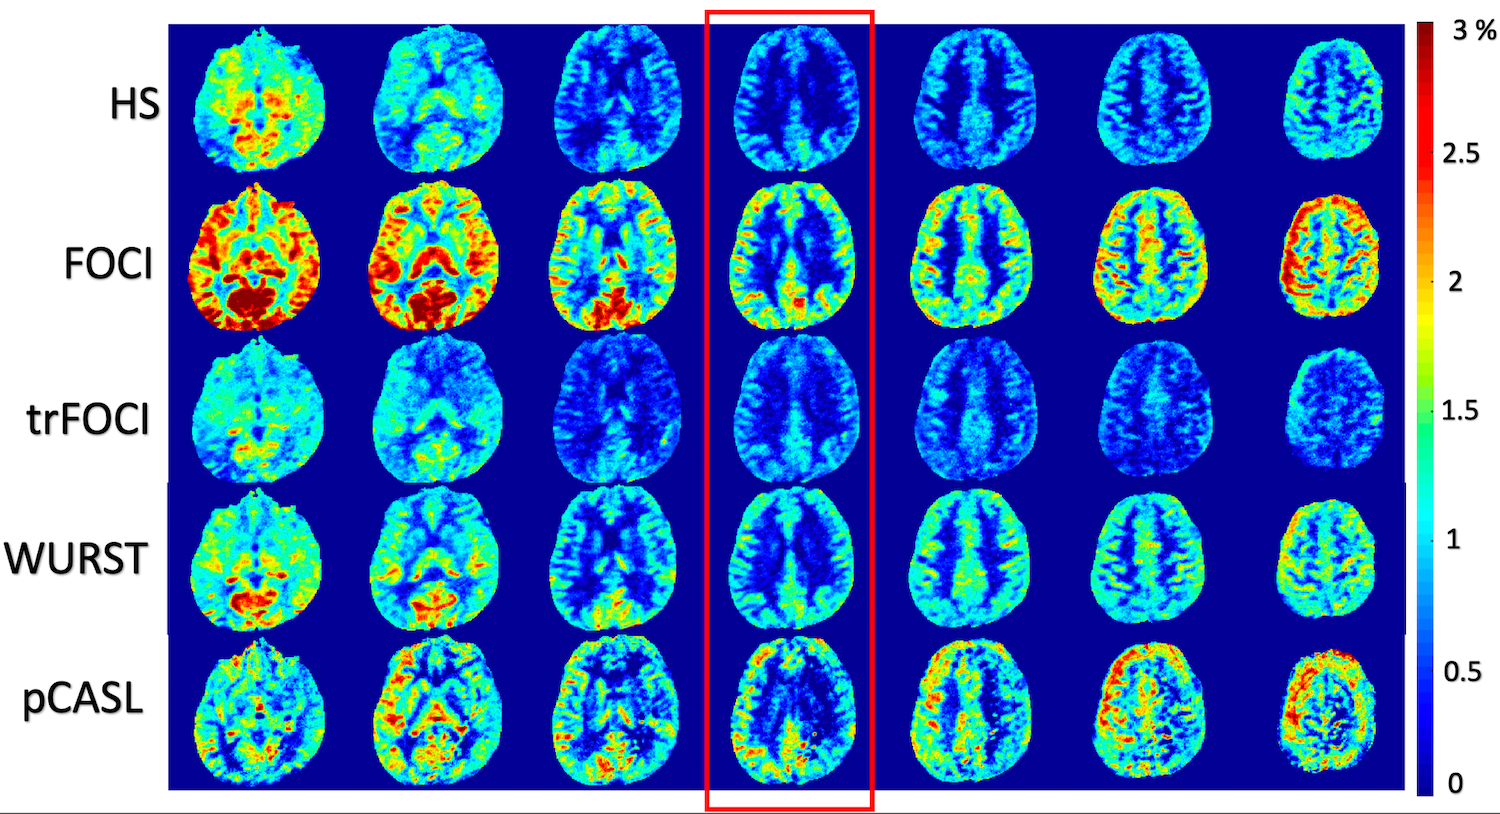
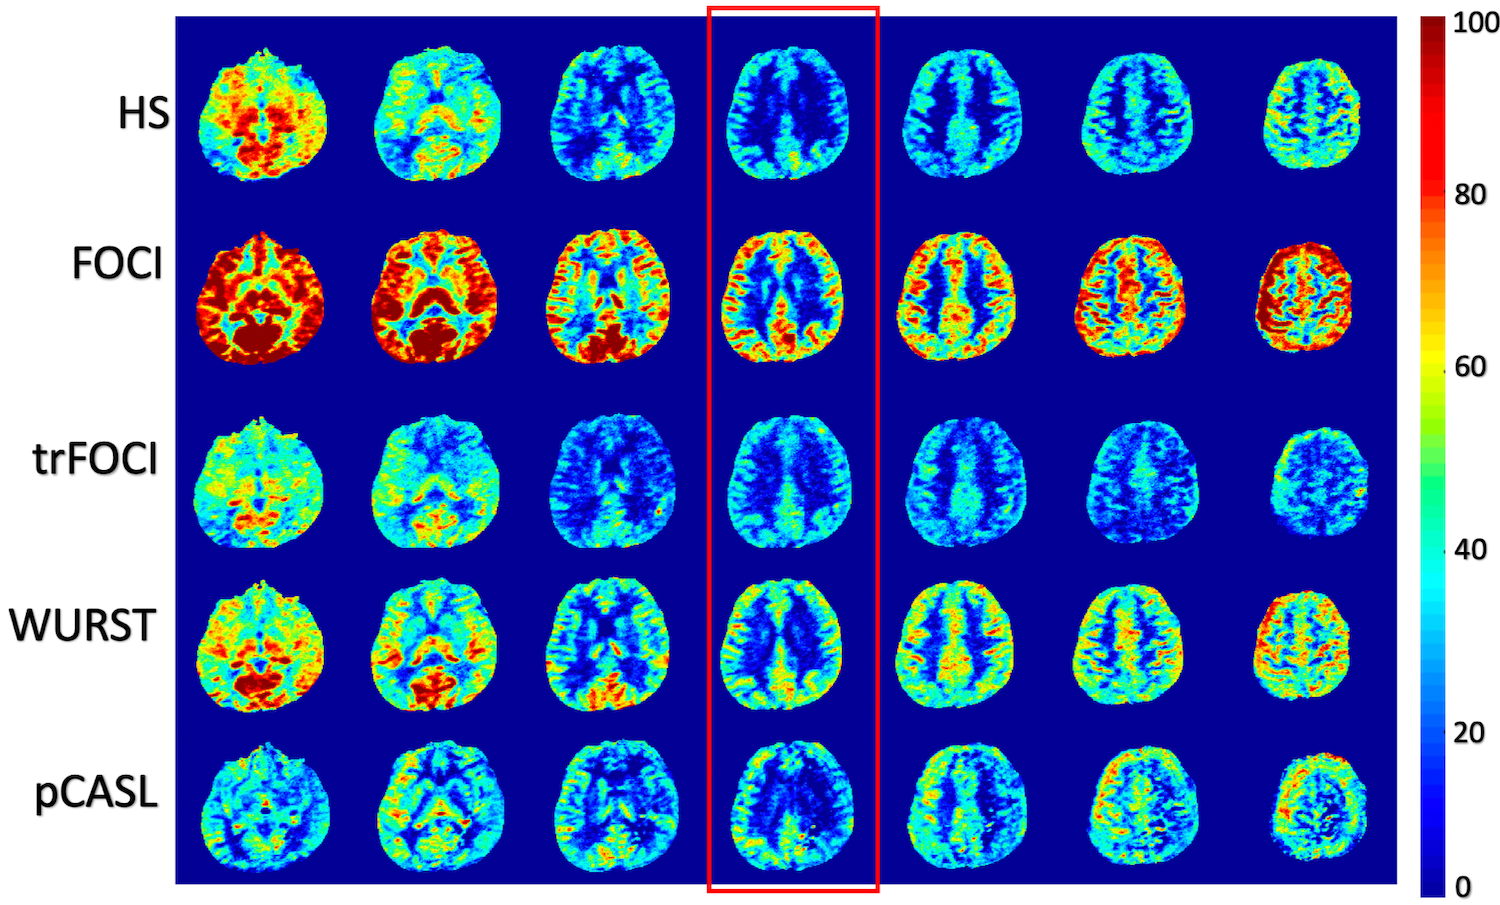
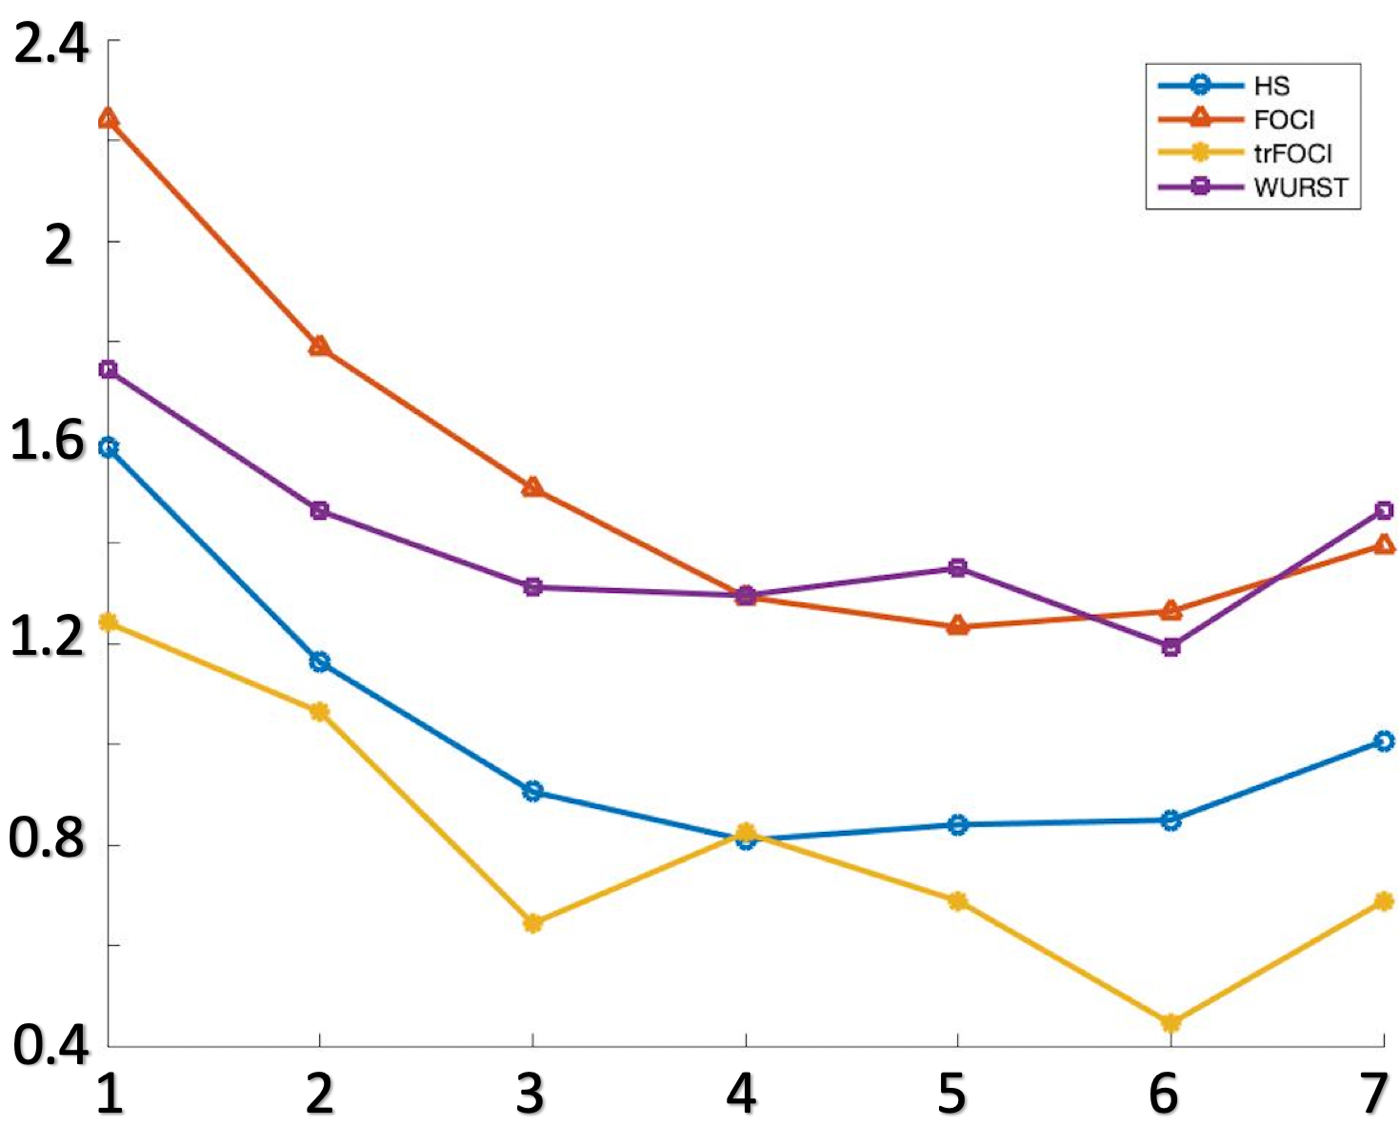
Figure 1 shows the RF, the gradient waveforms and the inversion profile of the optimized pulses. When B1 was scaled by 50%, FOCI could not achieve the designed inversion band. trFOCI had the sharpest transition band, and trFOCI and WURST had a relatively uniform inversion band.The inversion profile in the phantom experiments was consistent with simulation results, except that with trFOCI, unexpected ripples appeared in the inversion band. The perfusion and CBF maps for one representative case are shown in Figure 3 and 4, respectively, where FOCI showed the strongest signal increase from the central slice to both edges, which is likely due to residual tissue signal; HS and trFOCI had lower signal intensity compared with WURST, which was also supported by Figure 5.
The ratio between PASL CBF and PCASL for the central slice (red box in Figure 3,4) was 0.8/1.3/0.8/1.3 for HS/FOCI/trFOCI/WURST, respectively, and the SD was 0.28/0.37/0.27/0.18. Assuming no residual signal was present at the center, the central slice CBF reflected the labeling efficiency relative to pCASL, while the SD across slices indicated the residual tissue signal intensity. Thus, WURST and FOCI showed the highest labeling efficiency, and WURST suffered the least from the residual signal.
Discussion and Conclusion
FOCI was more vulnerable to low B1 amplitude, had a relatively wider transition band and thus suffered more from residual signal compared with other pulses. WURST, HS, and trFOCI had similar performance in simulation and phantom experiments, while in-vivo experiments showed higher labeling efficiency and less residual signal with WURST.When compared with pCASL, PASL with WURST also showed higher labeling efficiency and tolerable residual, which may be due to that pCASL is sensitive to B0/B1 inhomogeneities at the labeling plane (typically at the base of the cerebellum) on 7T. Based on our testing and easier implementation, PASL with WURST pulse is recommended for 7T perfusion measurement.
Acknowledgements
This work was supported by National Institute of Health (NIH) grants UH2-NS100614.References
[1] Silver MS. Highly selective Pi/2 and Pi pulse generation. J Magn Res 1984;59:347–351.
[2] Kupce, E., and Ray Freeman. "Adiabatic pulses for wideband inversion and broadband decoupling." Journal of Magnetic Resonance, Series A 115.2 (1995): 273-276.
[3] Ordidge, Roger J., et al. "Frequency offset corrected inversion (FOCI) pulses for use in localized spectroscopy." Magnetic resonance in medicine 36.4 (1996): 562-566.
[4]Hurley, Aaron C., et al. "Tailored RF pulse for magnetization inversion at ultrahigh field." Magnetic Resonance in Medicine: An Official Journal of the International Society for Magnetic Resonance in Medicine 63.1 (2010): 51-58.
[5] Alsop, David C., et al. "Recommended implementation of arterial spin‐labeled perfusion MRI for clinical applications: a consensus of the ISMRM perfusion study group and the European consortium for ASL in dementia." Magnetic resonance in medicine 73.1 (2015): 102-116.
Figures