3681
Feasibility of Dynamic Inhaled Gas MRI-based Measurements using Acceleration Factors of 10 and 141Lawson Health Research Institute, London, ON, Canada, 2Physics and Astronomy, The University of Western Ontario, London, ON, Canada, 3The University of Western Ontario, London, ON, Canada, 4Montrel Neuro Institute, Montreal, QC, Canada, 5Thunder Bay Regional Research Institute,, Thunder Bay, ON, Canada, 6Philips Australia & New Zealand, North Ryde, Australia
Synopsis
We hypothesize that the SEM equation can be adapted for fitting the gas-density dependence of the MR signal similar to fitting time or b-value dependences S(n)=exp[-(nR)β], where 0<β<1, n is the image number and R is the apparent-fractional-ventilation parameter. This interpretation allows us to consider the signal-intensity variation as reflection of the underlying gas-density variation and hence, reconstruction of the under-sampled k-space using the adapted SEM equation. Lung fractional-ventilation maps have been generated using reconstructed images. We have demonstrated the feasibility of our approach using retrospective under-sampling mimicking acceleration factors of 10 and 14 in a small animal cohort.
Introduction
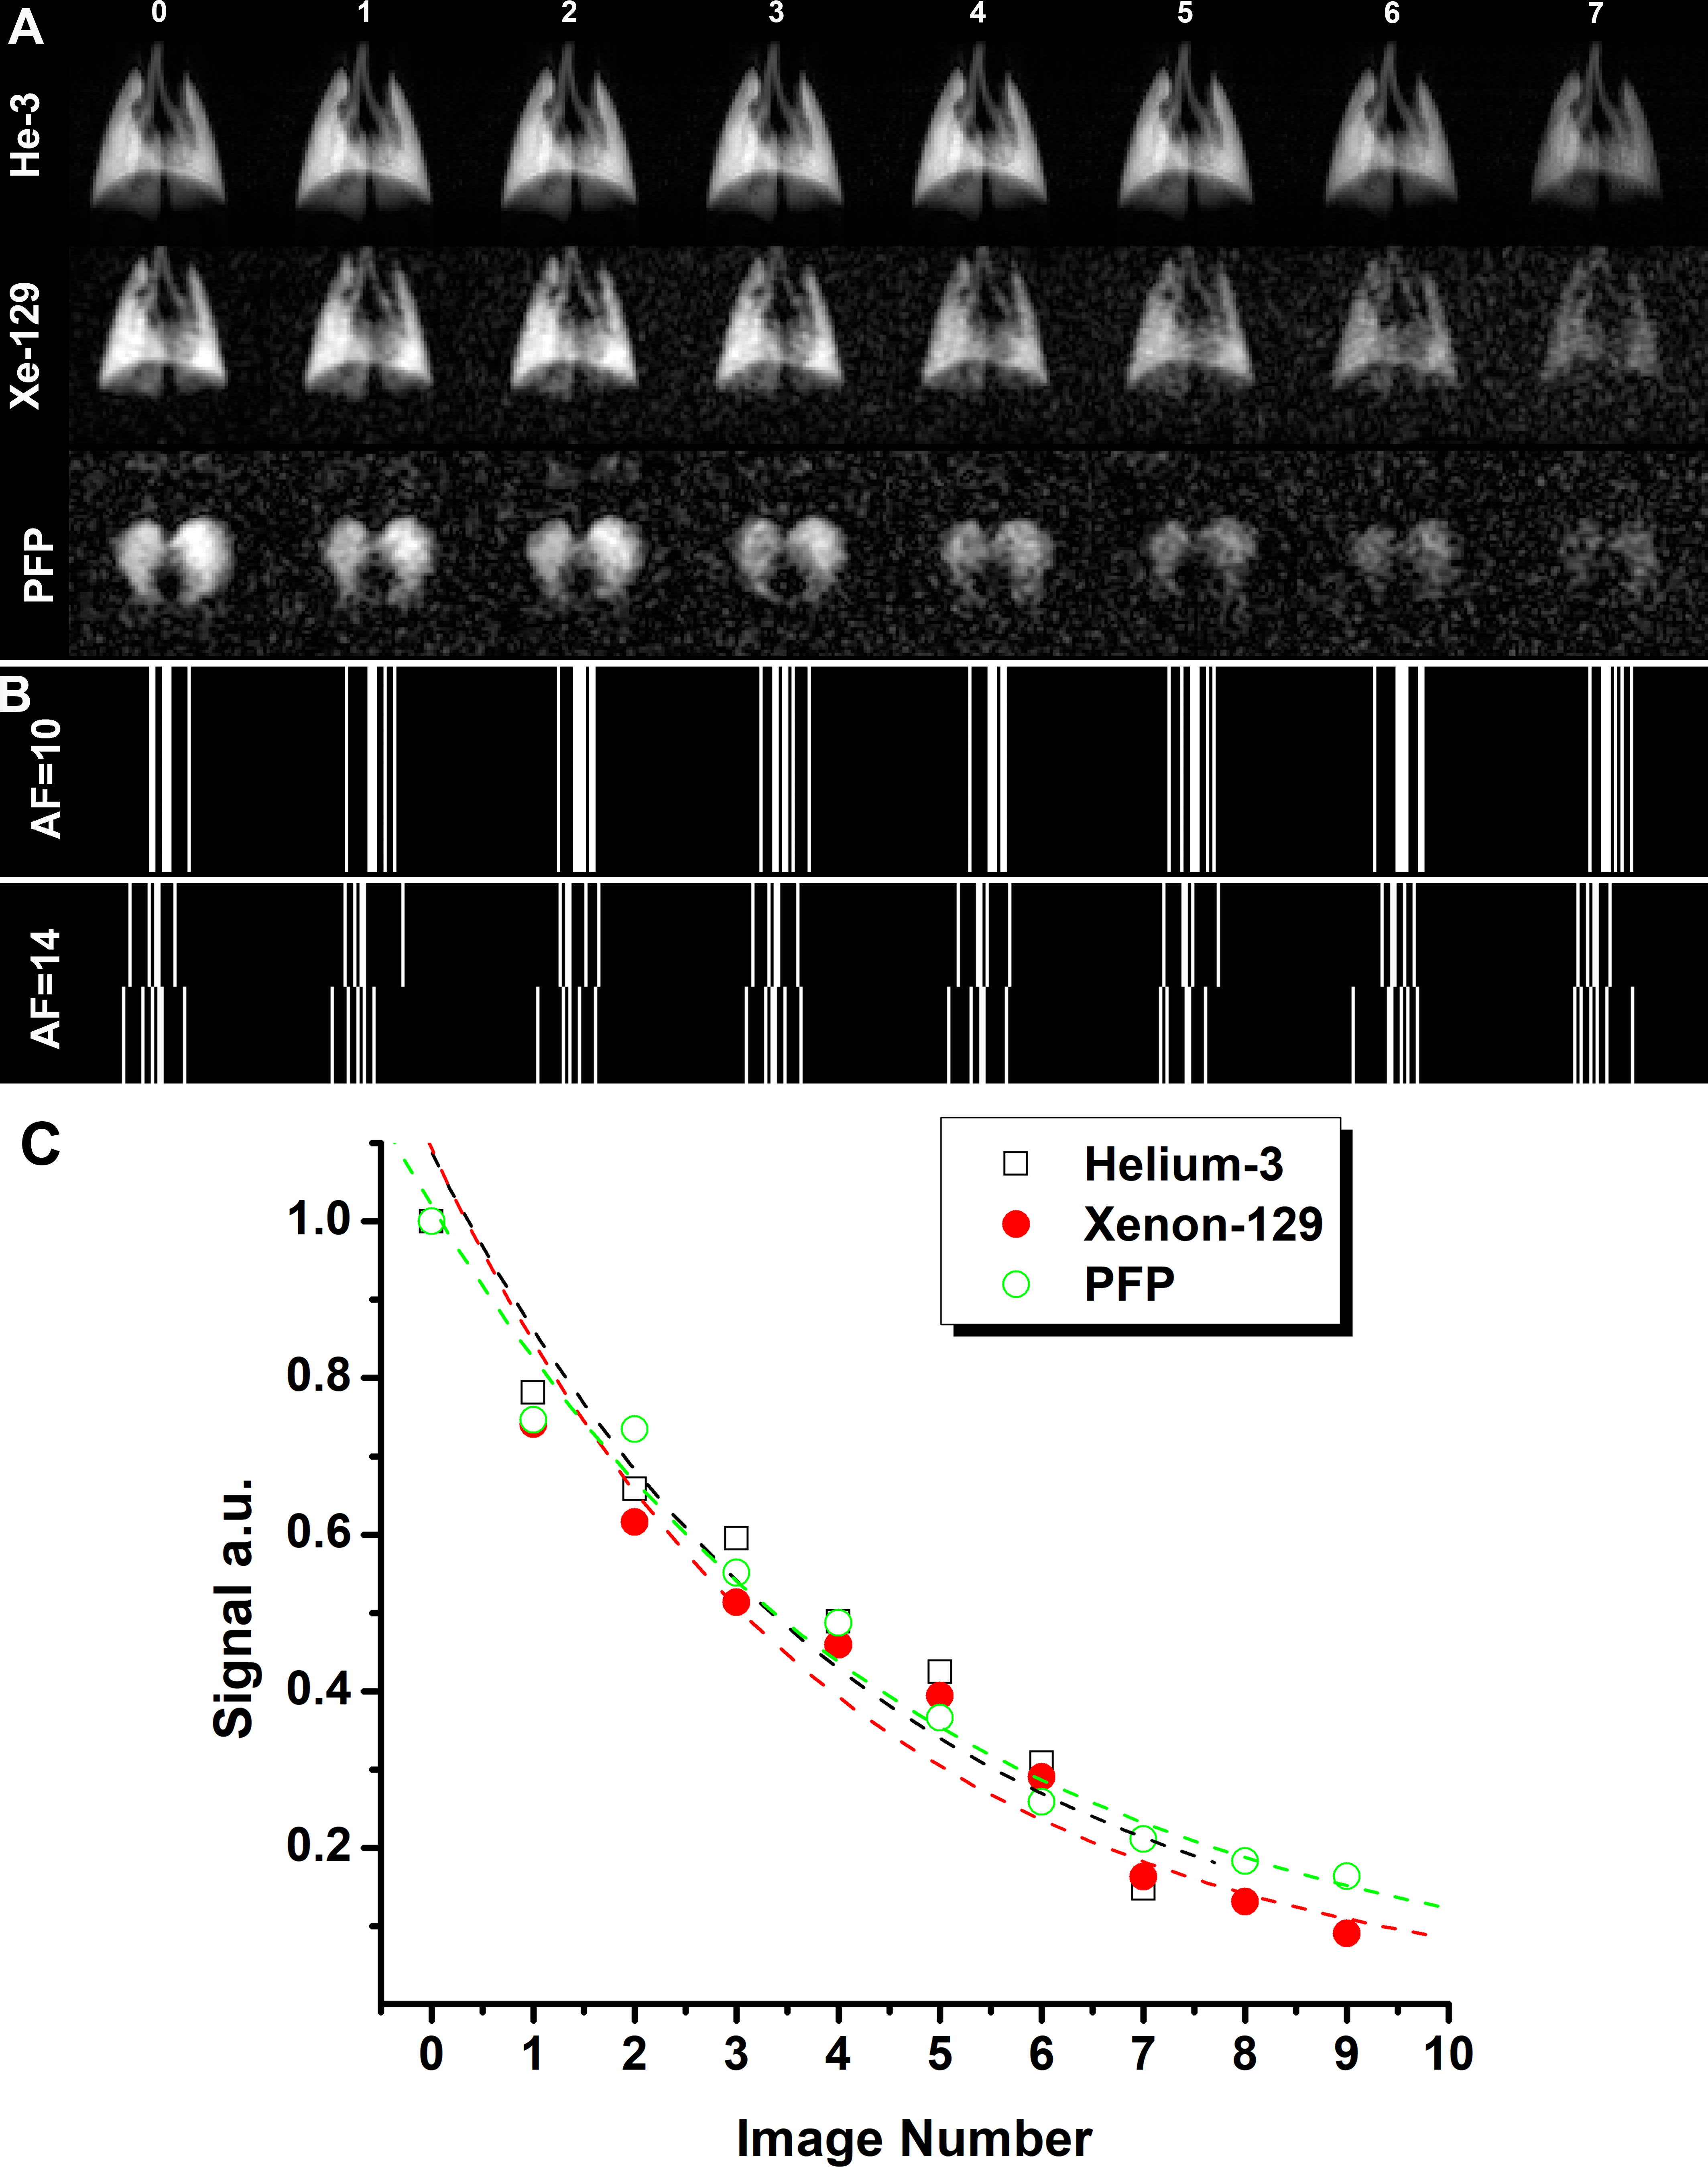
Inhaled gas (3He/129Xe/19F) MRI has been proven to be useful for dynamic lung imaging.1,2 These techniques enable acquisition of regional fractional-ventilation3-5 measurements which are very useful as CT-alternatives for detecting gas trapping in lung diseases such as lung inflammation, fibrosis and COPD.1 Thus, free-breathing 19F (C3F8 or PFP) dynamic lung imaging has been recently demonstrated in human lungs.6 This wash-out scheme ensures the gradual wash-out 19F gas within the 19F MRI lung images obtained from a COPD patient for eight wash-out breaths.6 Clearly, each new wash-out breath of air replaces some volume of the PFP gas in lung, so the signal intensity of the resulting images was gradually attenuated. The following equation can be fitted to the wash-out data:4 S(n)=S0(1-r)n, where S0 is the initial signal, n is the breath number, S(n) is the signal intensity after the nth wash-out breath and r is the fractional-ventilation parameter.4,7 r can be expressed as the fraction between fresh gas entering the lung and the total volume of gas within the lung (Vtotal):4,7 r=Vnew/Vtotal or Vnew/(Vnew+Vold). In order to improve the signal-to-noise ratio (SNR) from attenuating effects like O2-induced depolarization (hyperpolarized gas case) or due to low-thermally polarized spins (19F case), signal averaging and the compressed sensing method combined with the stretched-exponential-model8 (SEM) can be utilized. We hypothesize that the SEM equation can be adapted for fitting the gas density dependence of the MR signal similar to fitting time or b-value dependences:9,10 S(n)=exp[-(nR)β], where 0<β<1, n is the image number and R is the apparent fractional-ventilation parameter.11 This interpretation allows us to consider the MR signal intensity variation (Figure 2) as reflection of the underlying gas-density variation and hence, reconstruction of the under-sampled k-space using the adapted SEM equation. Lung fractional-ventilation maps can be generated using reconstructed images. Therefore, in this proof-of-concept evaluation, our objective was to demonstrate the feasibility of our approach using retrospective under-sampling mimicking acceleration factors (AF) of 10 (10% of the k-space points) and 14 (5% of the k-space points) in a small animal cohort from previously reported dynamic lung studies (3He/129Xe/19F MRI5,7).Methods
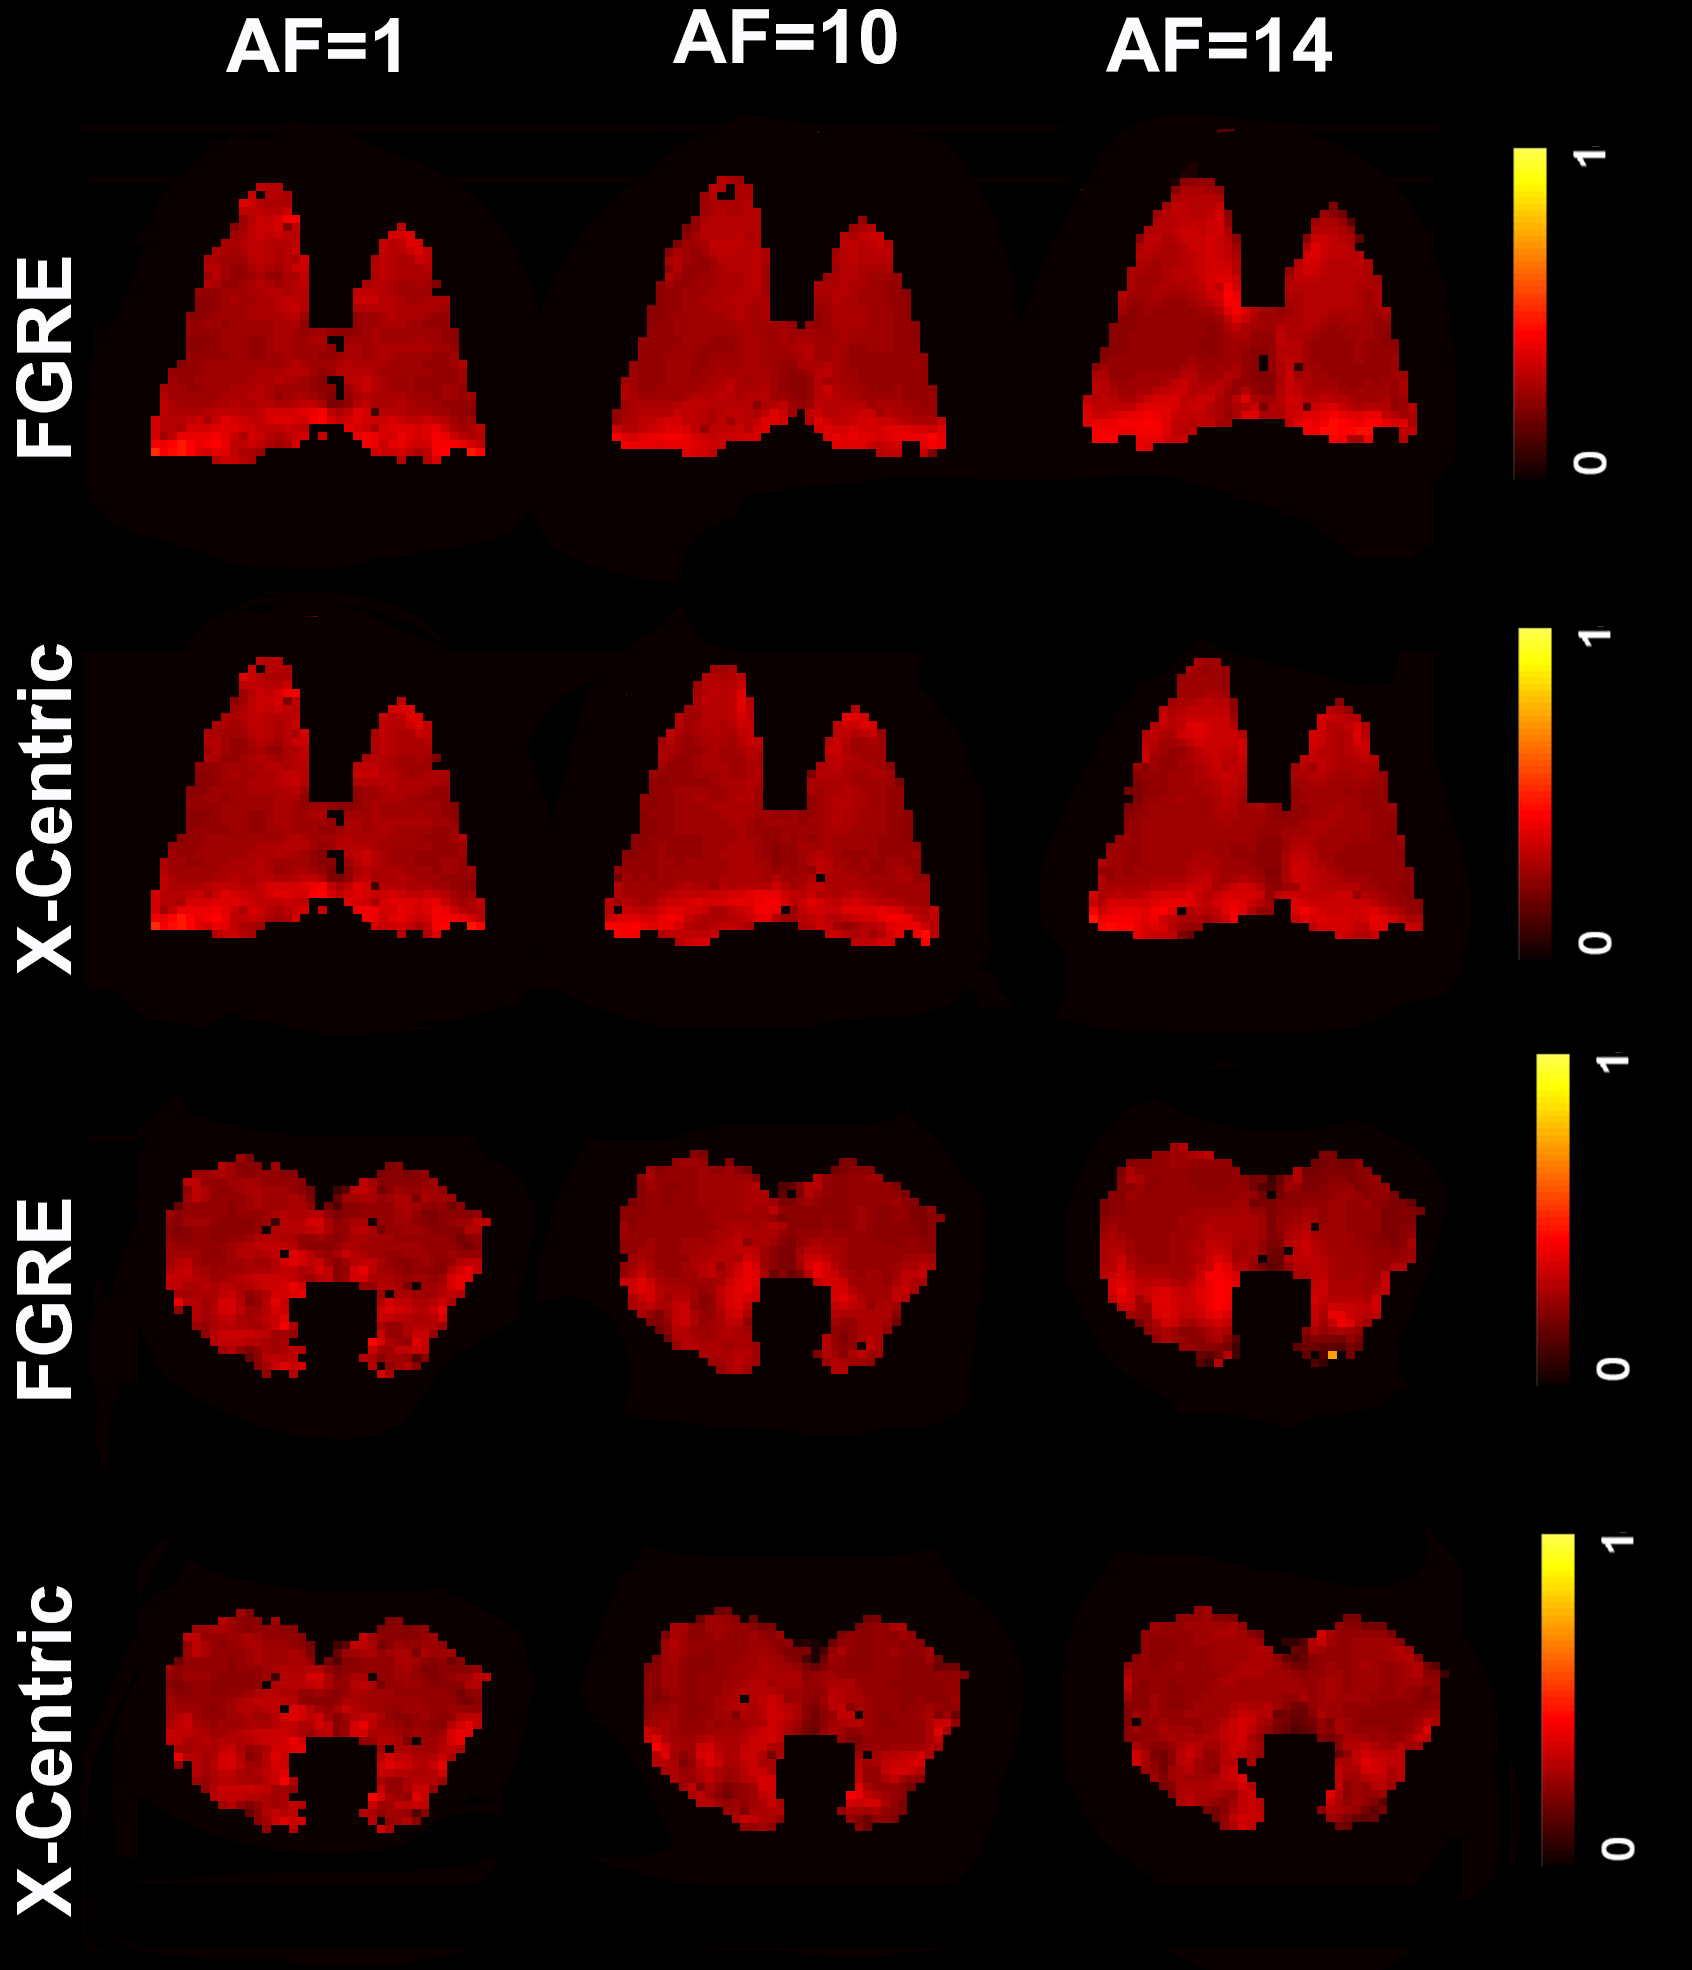
All animal studies were approved by our local ethics board. 3He/129Xe MR was performed on five control animals (Sprague Dawley rats) at 3.0T (MR750, GEHC, WI) using a high-performance insert-gradient-coil (G=500mT/m, slew-rate=2000T/m/s)12 and a commercial, xenon-quadrature-rat-sized 3He/129Xe RF coils13 (Morris Instruments, Canada). Pulse sequence details and the breathing protocol were previously described.5 19F MRI (SF6/PFP) ventilation measurements were performed using a 3.0T Philips Achieva scanner with maximum gradient strengths of 4 G/cm and a home-built rat-sized quadrature transmit/receive coil tuned to the 19F resonance frequency of 120.15 MHz. Pulse sequence details and the breathing protocol were previously described.7 Two Cartesian sampling schemes (FGRE and x-Centric14) was used to test the proposed method. Eight fully-sampled dynamic wash-out images were retrospectively under-sampled (AF=10 and 14) using random sampling patterns in the wash-out direction (Figure 1b). Thus, the signal intensity of the under-sampled k-spaces were represented as a functions of the image number (Figure 2) and then fit following Abascal et al method.15 Values of (n=0, 1, 2, 3, 4, 5, 6, 8) was used to fit the 3He/129Xe/19F under-sampled data and generate the mean fractional-ventilation maps.Results
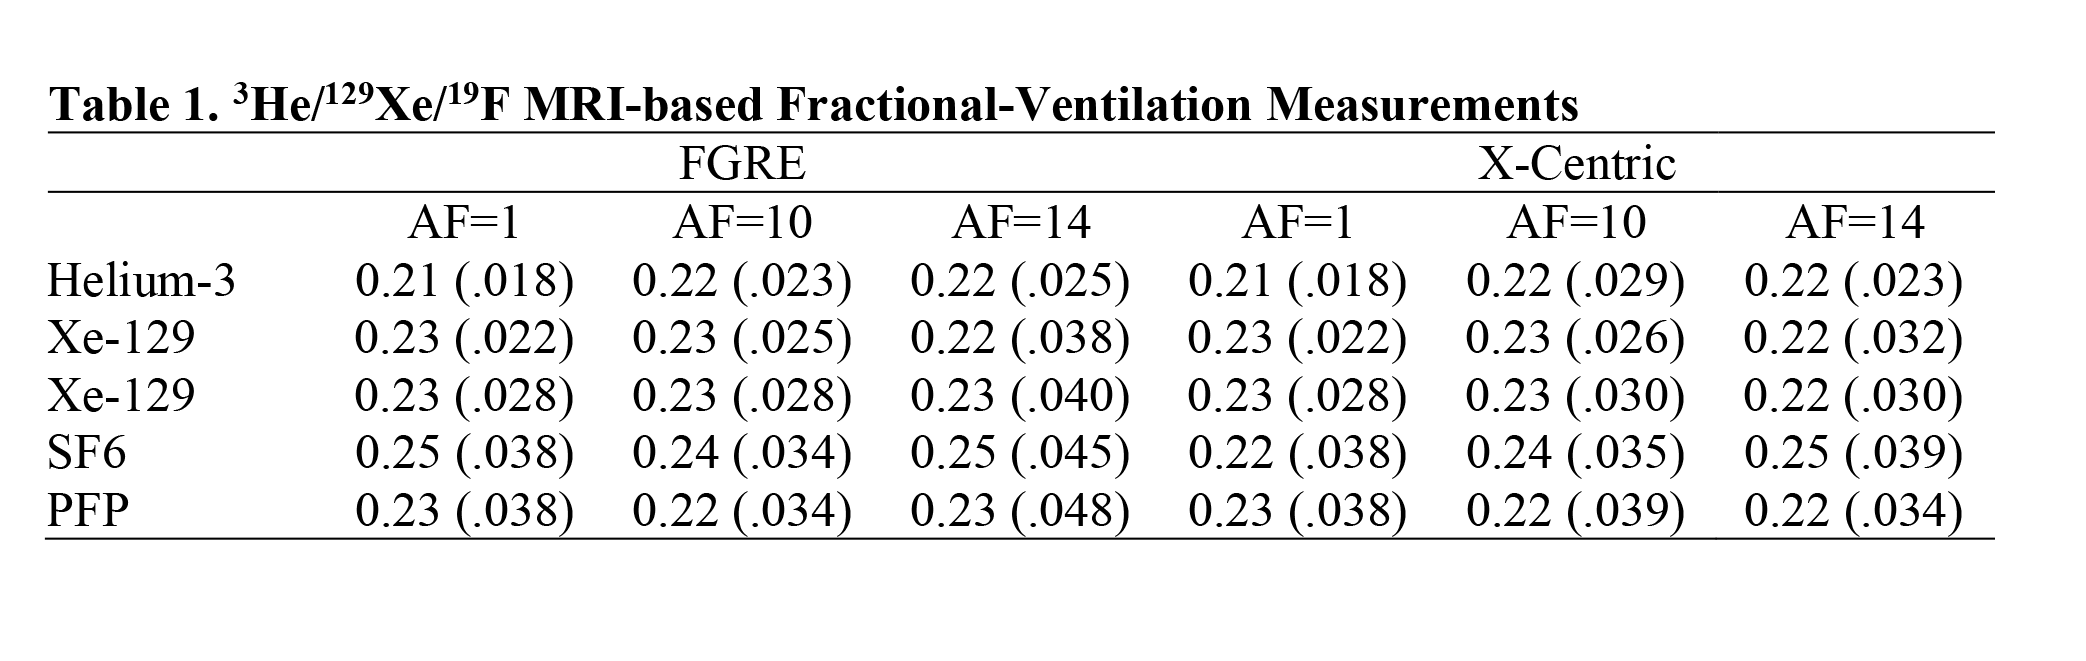
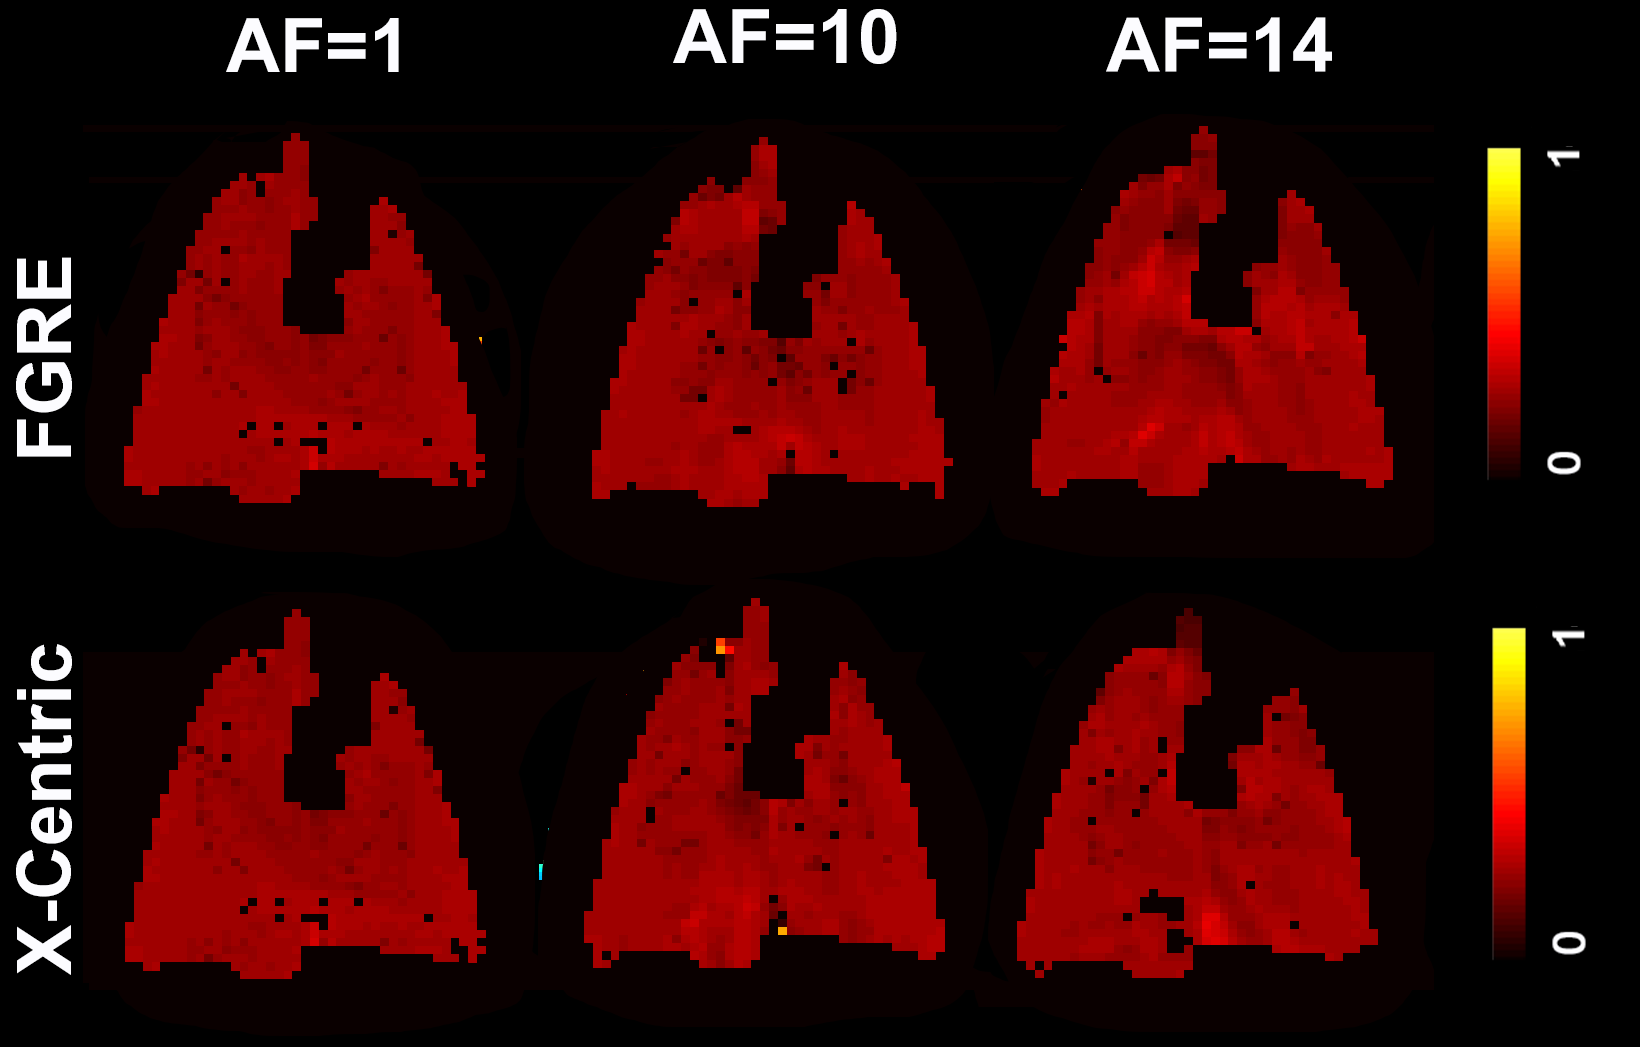
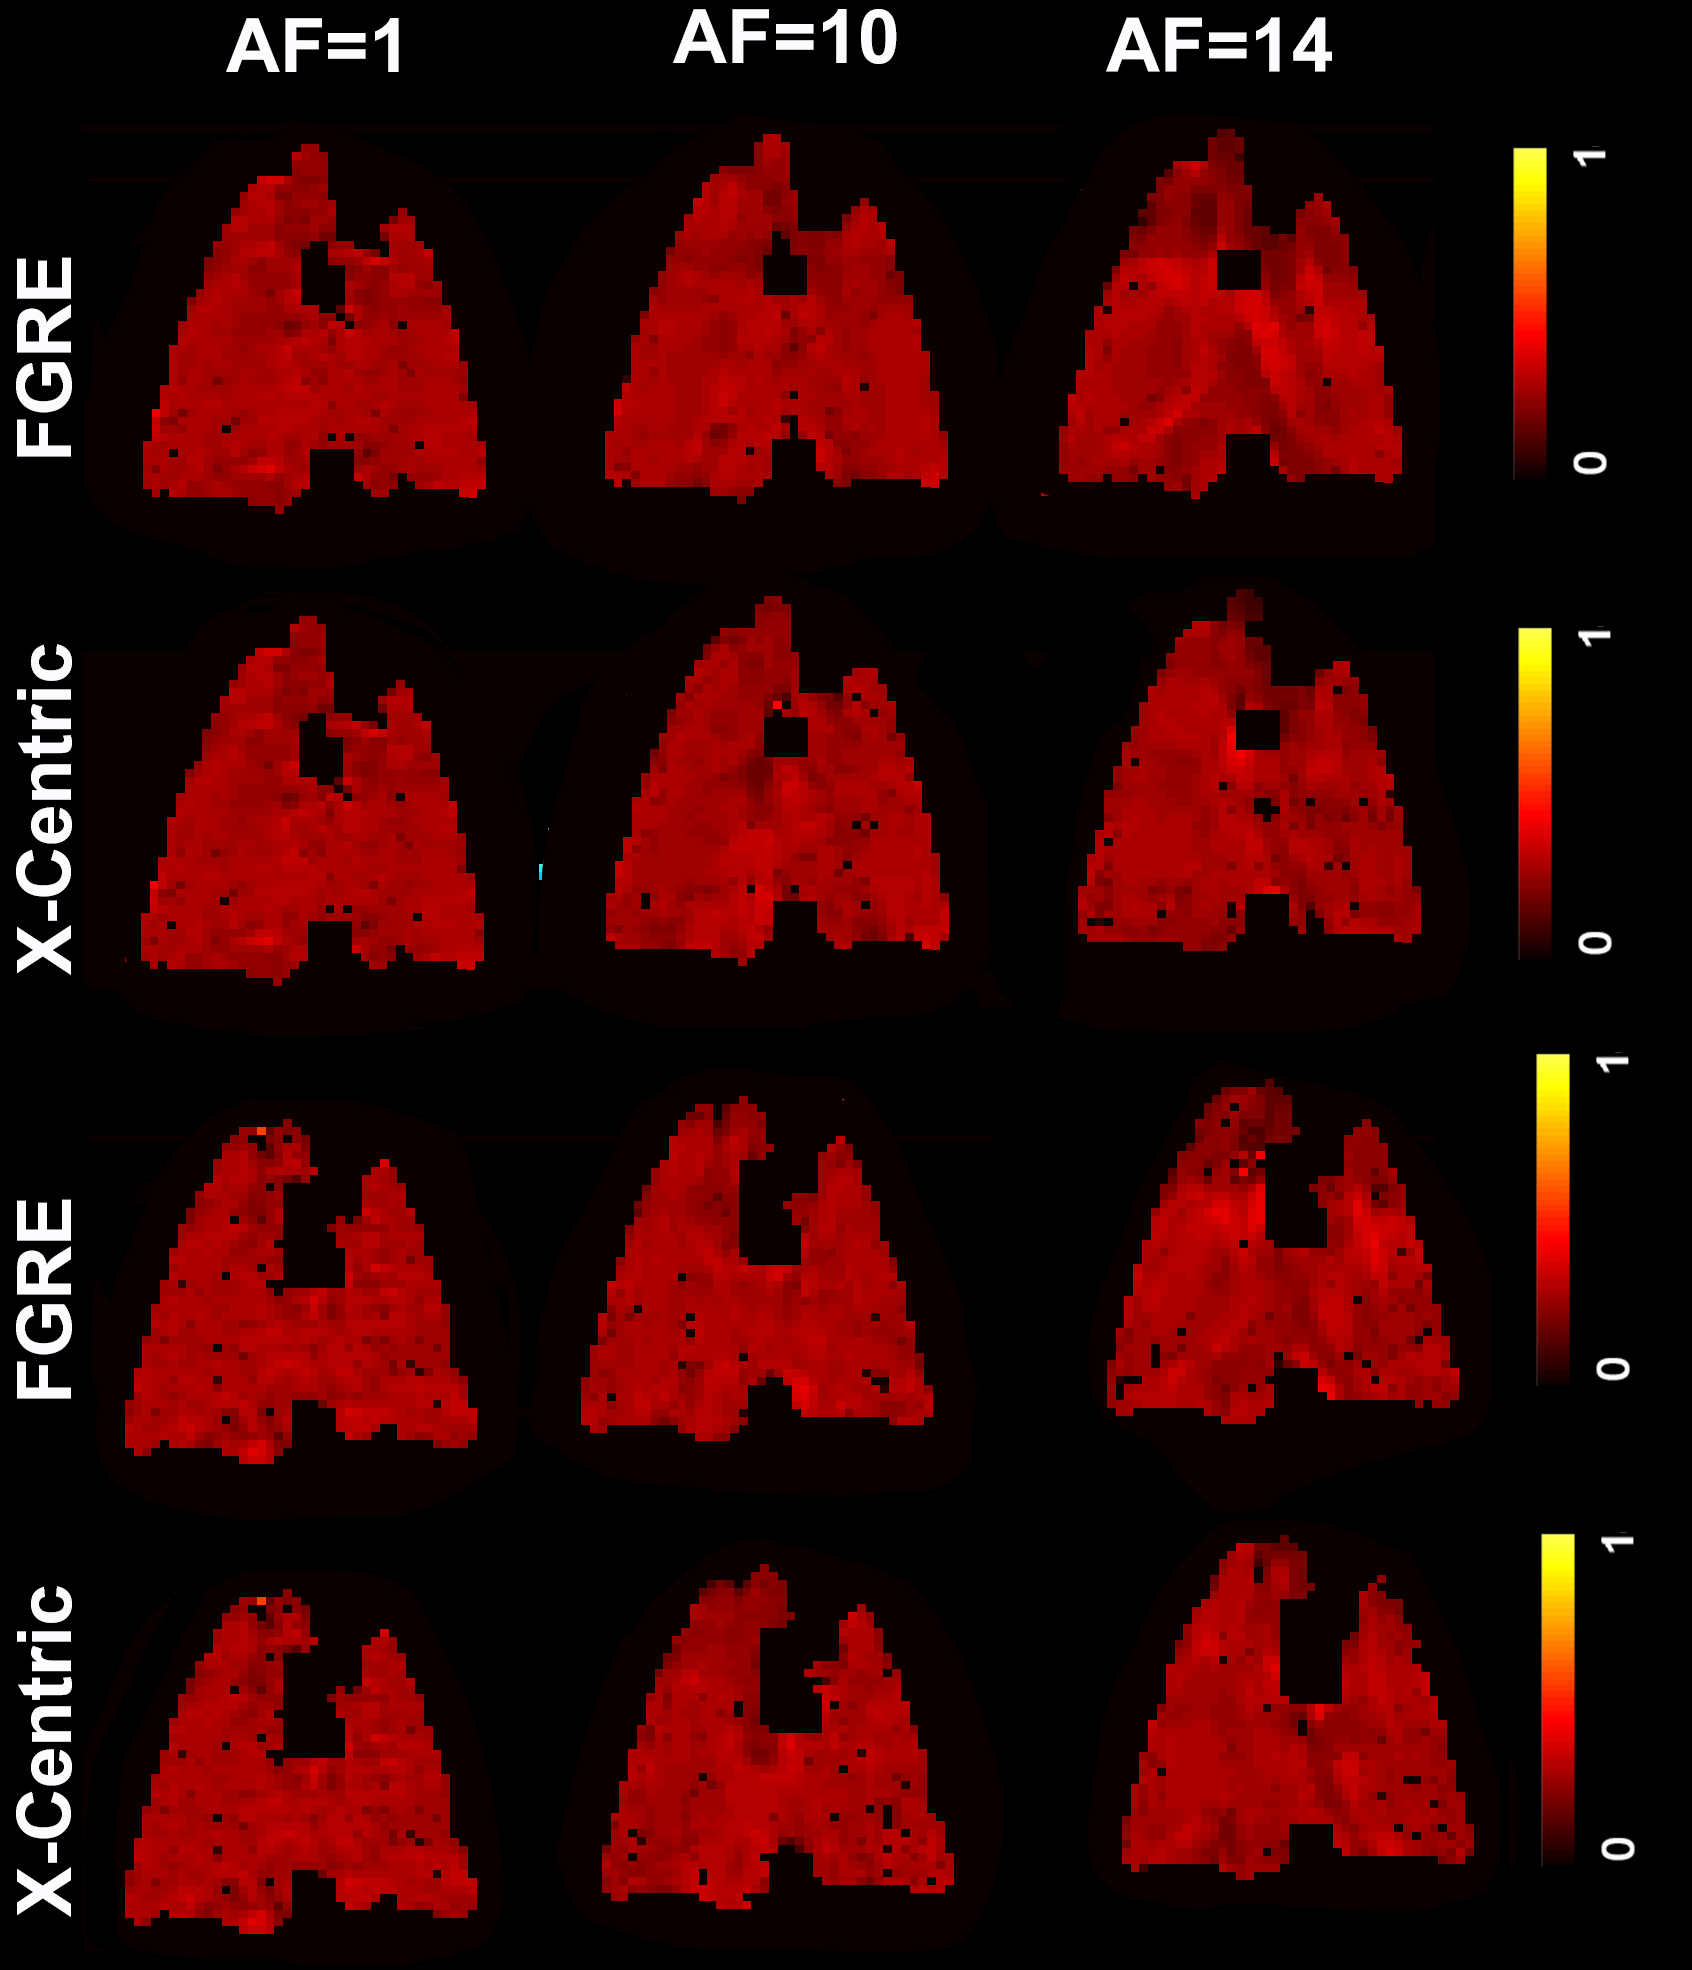
Figures 3, 4 and 5 show fractional-ventilation maps obtained for three gases for all rats and Table 1 shows the MRI-based mean fractional-ventilation estimates. The pixel-by-pixel differences between the original fully-sampled time-zero images and those reconstructed after retrospective under-sampling was within the interval of 11%-15% for all rats and both AFs, except for one PFP animal where the difference was more than 22%. We did not observe any difference between mean fractional-ventilation estimates obtained for the fully-sampled case and under-sampled cases.Discussion and Conclusion
In this proof-of-concept study, we showed that the SEM equation can be adapted for fitting the gas density dependence of the MR signal similar to fitting the time or b-value dependences. Our mean fractional-ventilation estimates were approximately twice smaller than the previously reported numbers.5,7 We propose to generate mean fractional-ventilation estimates using traditional and SEM-based approaches in order to investigate this mismatch. It is always possible to use the proposed approach to reconstruct the images from the under-sampled k-spaces and then use the reconstructed images to generate r utilizing the traditional approach.4 For the first time we have demonstrated that dynamic inhaled gas MRI-based lung measurements can be significantly accelerated by collecting as little as 5% of k-space without compromising the accuracy of the regional biomarkers such as regional fractional-ventilation estimates.Acknowledgements
No acknowledgement found.References
1 Couch, M. J. et al. Fractional ventilation mapping using inert fluorinated gas MRI in rat models of inflammation and fibrosis. NMR Biomed 29, 545-552, doi:10.1002/nbm.3493 (2016).
2 Couch, M. J., Ouriadov, A. V. & Albert, M. S. in Hyperpolarized and Inert Gas MRI 279-292 (Academic Press, 2017).
3 Deninger, A. J. et al. Quantitative measurement of regional lung ventilation using 3He MRI. Magnetic Resonance in Medicine 48, 223-232, doi:doi:10.1002/mrm.10206 (2002).
4 Santyr, G. E., Lam, W. W. & Ouriadov, A. Rapid and efficient mapping of regional ventilation in the rat lung using hyperpolarized 3He with Flip Angle Variation for Offset of RF and Relaxation (FAVOR). Magn Reson Med 59, 1304-1310, doi:10.1002/mrm.21582 (2008).
5 Couch, M. J., Ouriadov, A. & Santyr, G. E. Regional ventilation mapping of the rat lung using hyperpolarized (1)(2)(9)Xe magnetic resonance imaging. Magn Reson Med 68, 1623-1631, doi:10.1002/mrm.24152 (2012).
6 Gutberlet, M. et al. Free-breathing Dynamic (19)F Gas MR Imaging for Mapping of Regional Lung Ventilation in Patients with COPD. Radiology 286, 1040-1051, doi:10.1148/radiol.2017170591 (2018). 7 Ouriadov, A. V. et al. In vivo regional ventilation mapping using fluorinated gas MRI with an x-centric FGRE method. Magn Reson Med 74, 550-557, doi:10.1002/mrm.25406 (2015).
8 Chan, H. F., Stewart, N. J., Parra-Robles, J., Collier, G. J. & Wild, J. M. Whole lung morphometry with 3D multiple b-value hyperpolarized gas MRI and compressed sensing. Magn Reson Med 77, 1916-1925, doi:10.1002/mrm.26279 (2017).
9 Berberan-Santos, M. N., Bodunov, E. N. & Valeur, B. Mathematical functions for the analysis of luminescence decays with underlying distributions 1. Kohlrausch decay function (stretched exponential). Chemical Physics 315, 171-182, doi:10.1016/j.chemphys.2005.04.006 (2005).
10 Parra-Robles, J., Marshall, H. & Wild, J. M. Characterization of 3He Diffusion in Lungs using a Stretched Exponential Model [abstract]. ISMRM 21st Annual Meeting, 0820 (2013).
11 Fox, M. & Ouriadov, A. in Magnetic Resonance Imaging (ed Associate Prof. Lachezar Manchev) (IntechOpen Limited, 2019).
12 Foster-Gareau, P., Heyn, C., Alejski, A. & Rutt, B. K. Imaging single mammalian cells with a 1.5 T clinical MRI scanner. Magn Reson Med 49, 968-971, doi:10.1002/mrm.10417 (2003).
13 Kaushik, S. S. et al. Single-breath clinical imaging of hyperpolarized (129)Xe in the airspaces, barrier, and red blood cells using an interleaved 3D radial 1-point Dixon acquisition. Magn Reson Med 75, 1434-1443, doi:10.1002/mrm.25675 (2016).
14 Ouriadov, A. V. & Santyr, G. E. High spatial resolution hyperpolarized (3) He MRI of the rodent lung using a single breath X-centric gradient-recalled echo approach. Magn Reson Med 78, 2334-2341, doi:10.1002/mrm.26602 (2017).
15 Abascal, J. F. P. J., Desco, M. & Parra-Robles, J. Incorporation of prior knowledge of the signal behavior into the reconstruction to accelerate the acquisition of MR diffusion data. ArXiv e-prints 1702 (2017). <http://adsabs.harvard.edu/abs/2017arXiv170202743A>.
Figures