3678
A Phase unwrapping Method by Phase Partition and Local Polynomial Fitting with Application to Abdominal Quantitative Susceptibility Mapping1Magnetic Resonance Department, The First Affiliated Hospital of Zhengzhou University, Zhengzhou, China, 2Philips Healthcare, Guangzhou, China, 3School of Biomedical Engineering, Southern Medical University, Guangzhou, China
Synopsis
The accurate recovery of underlying true phase is vital for a large number of applications, such as water/fat separation, quantitative susceptibility mapping and brain imaging. In this work, we propose a 3D phase unwrapping method based on phase partition and local polynomial fitting. The simulated and in vivo experiments demonstrate the proposed method can obtain perfect unwrapped results even in the regions with low SNR and rapidly changed phase, and can be applied to the abdominal QSM.
Target Audience
Researchers who are interested in phase unwrapping (PU) and abdominal quantitative susceptibility mapping.Purpose
In MRI, the acquired signal is combined by magnitude and phase. The magnitude is usually used while phase discarded in clinical diagnosis. The acquired phase is generally wrapped back into (-π, π] range. However, accurate recovery of underlying true phase is vital for a large number of applications, such as water/fat separation [1], quantitative susceptibility mapping [2] and brain imaging [3].A large number of PU algorithms have been proposed, while most of them are generally challenged by noise and rapid phase change. In this work, we propose a 3D PU method based on the phase partition [4] and local polynomial fitting. The proposed method first clusters the input phase map into blocks by phase partition method. The blocks with the voxels less than a predefined threshold are classified into residual voxels. After that, the proposed method sequentially performs inter-block and residual voxel PU by the local polynomial fitting. The unwrapping starts with the largest block, and proceeds with the nearest blocks and voxels. The 3D simulation and in vivo abdominal data were implemented to evaluate the performance of the proposed method with comparisons to the PRELUDE [4], graph-cut [5], region-growing [6] and Laplacian_based methods [7].
Methods
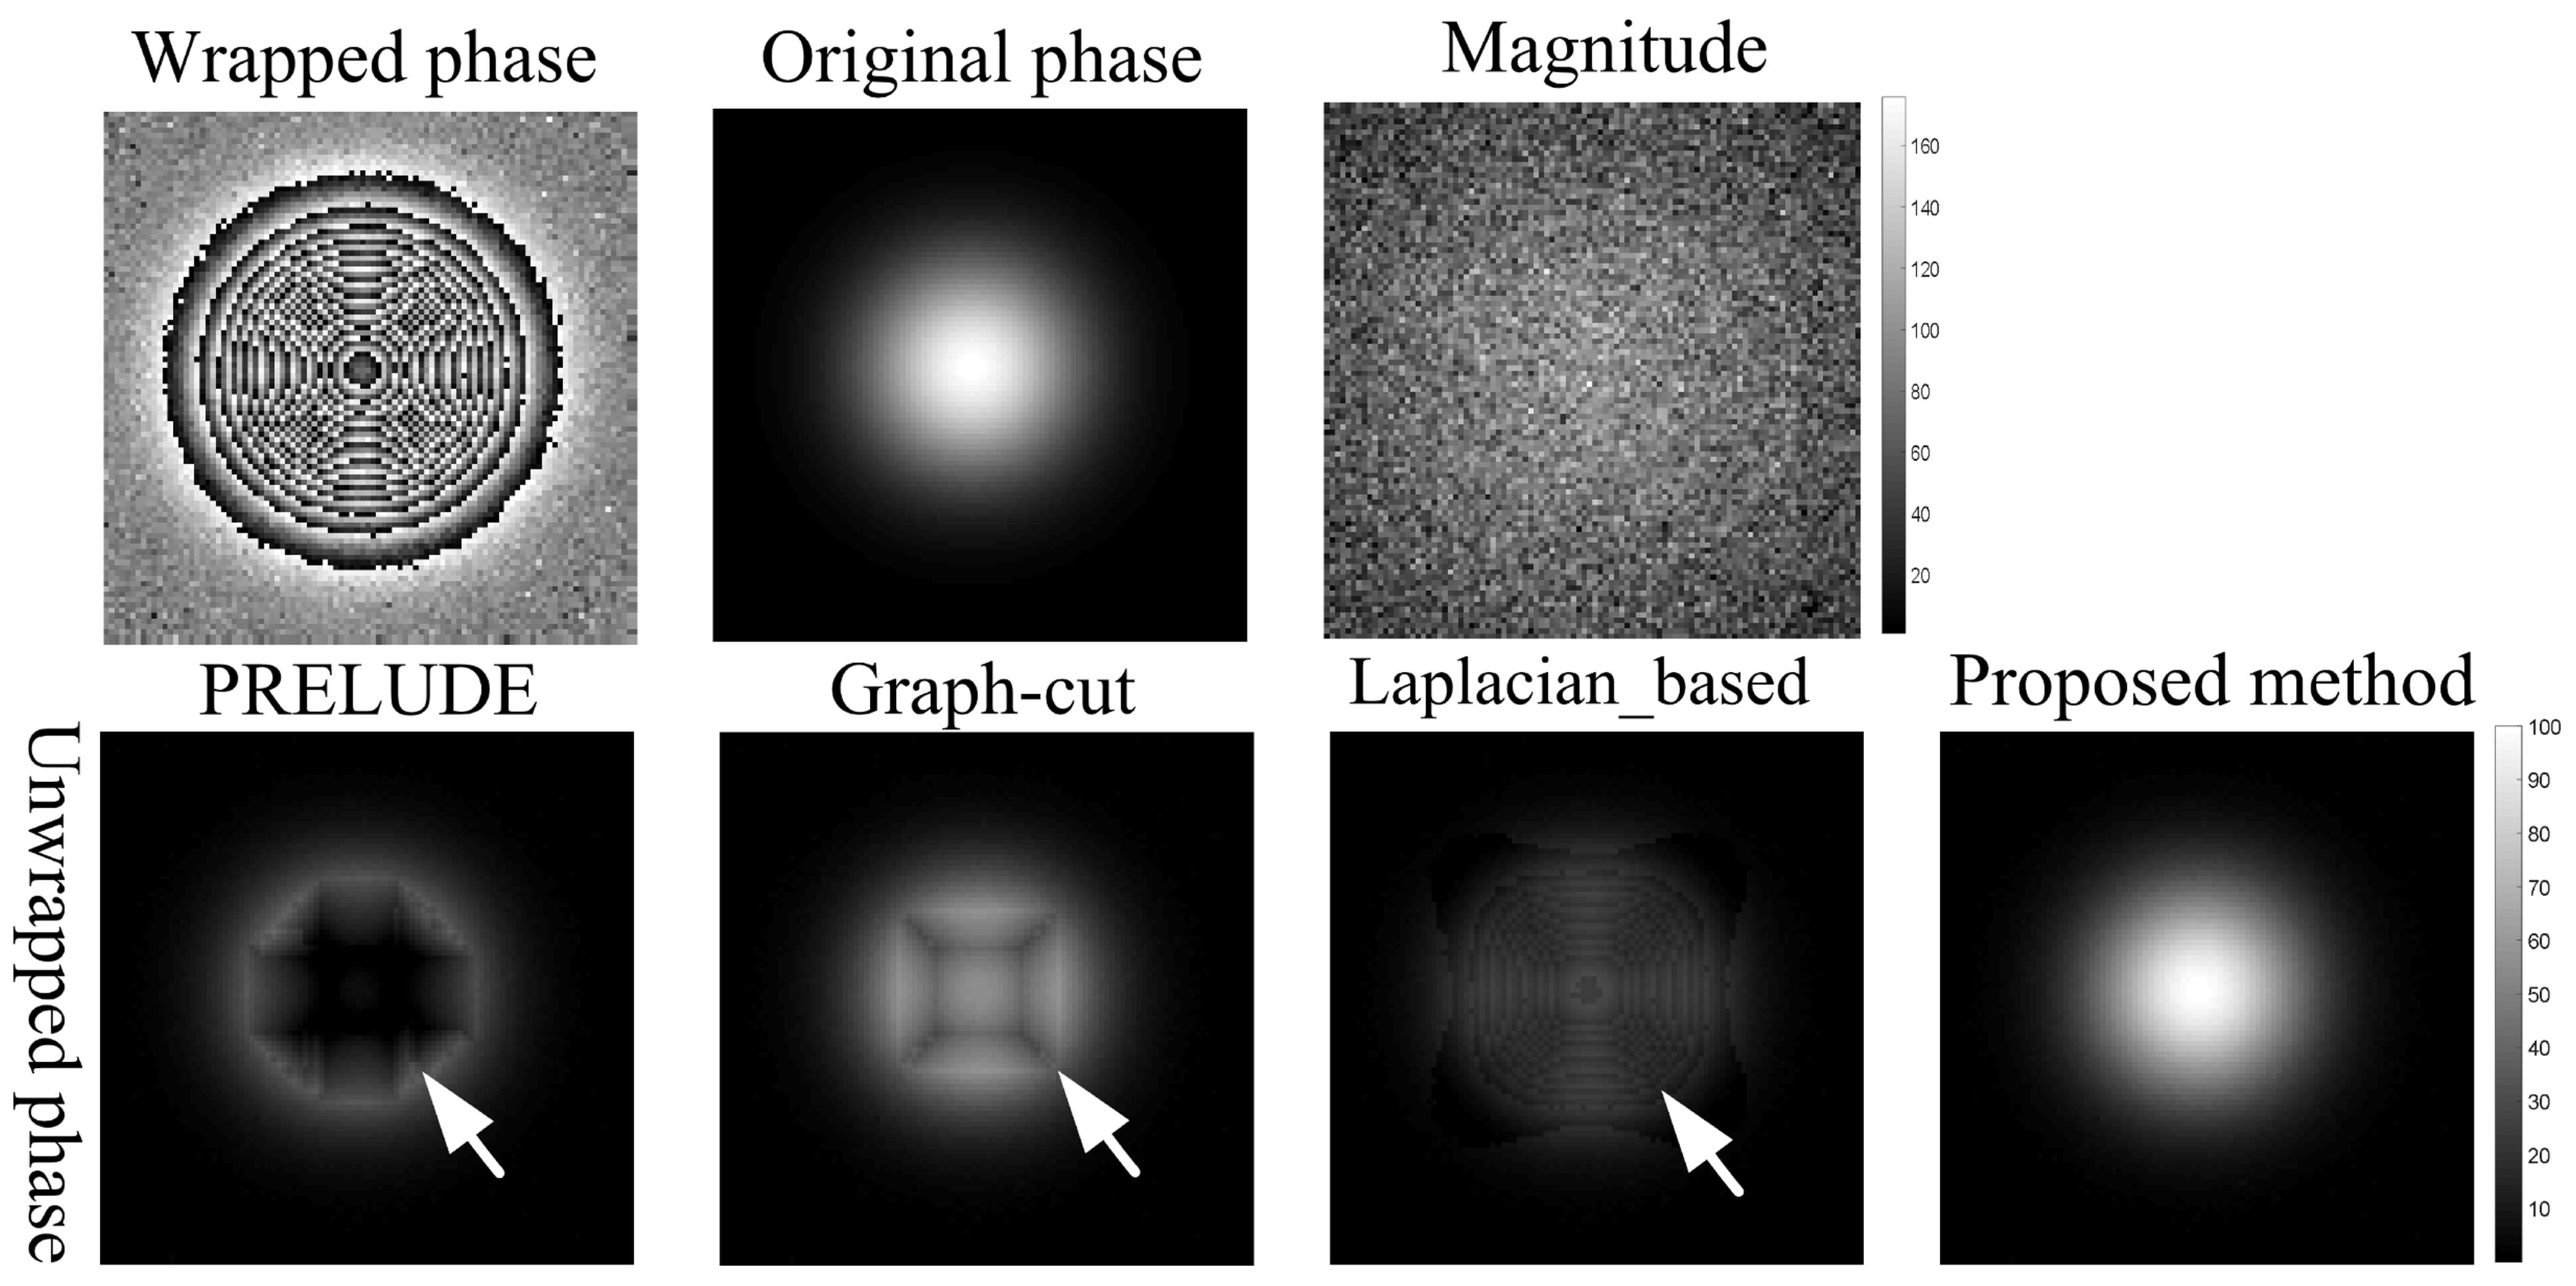
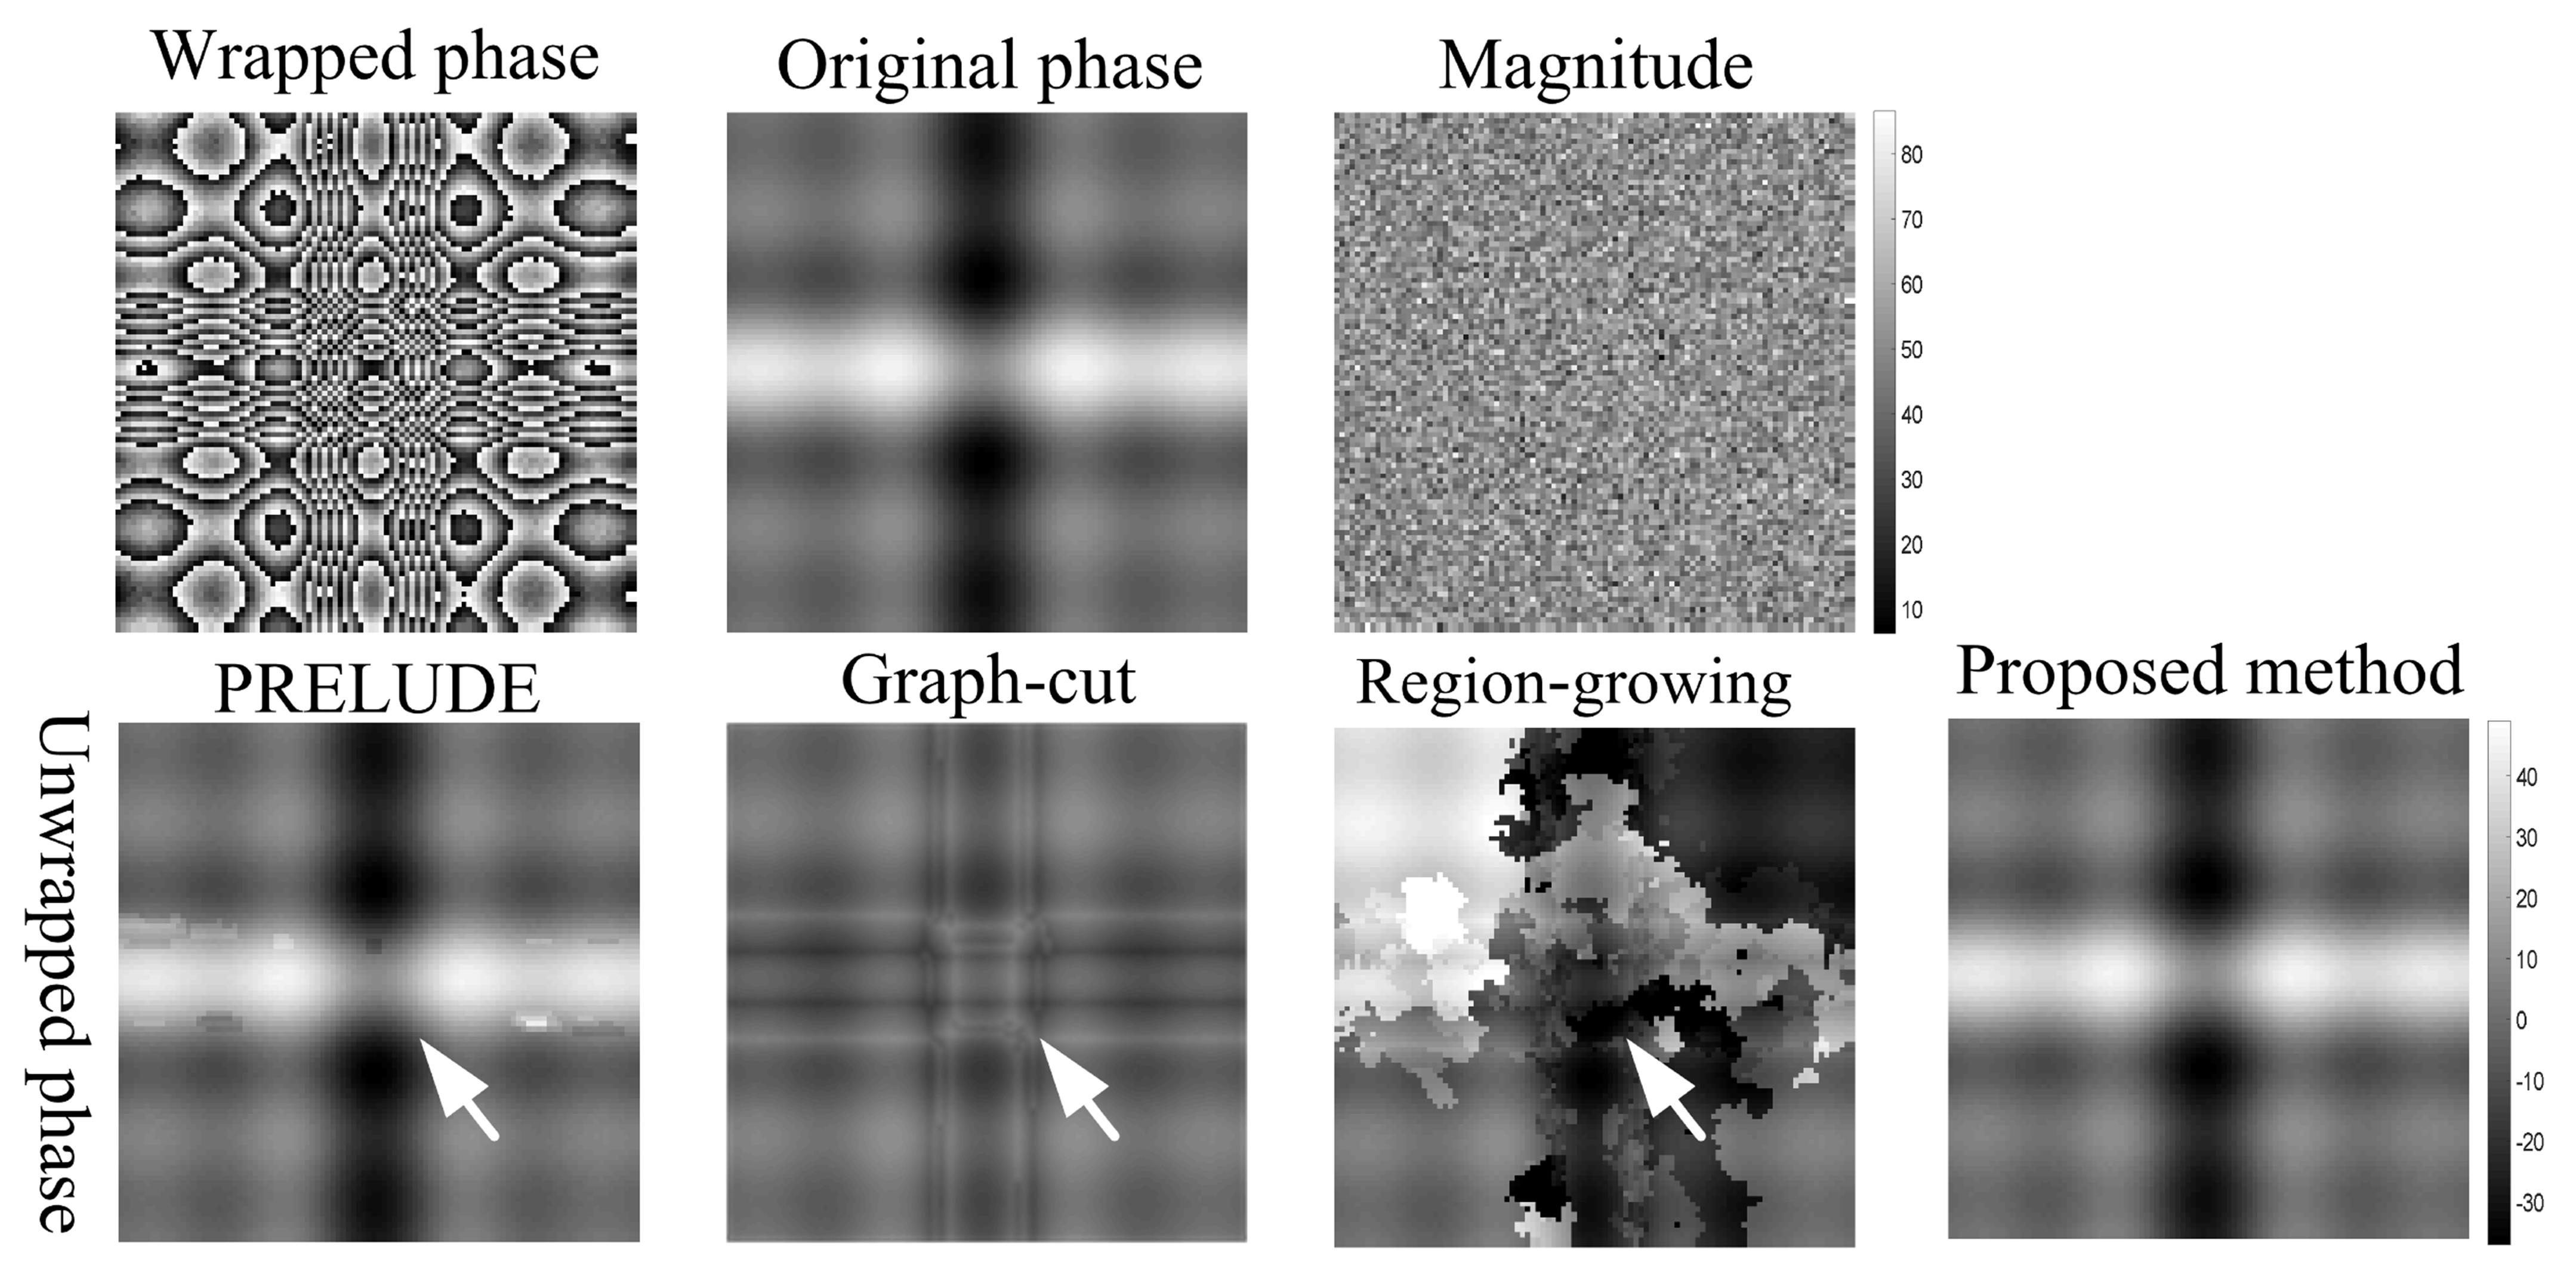
In the VOI, the phase interval (-π, π] is partitioned into equispaced subintervals. For each subinterval, a mask of voxels whose phase values are within this subinterval is generated. Then, blocks are identified by detecting connected components. The blocks with voxels less than a threshold are classified into residual voxels. A unique index is assigned to each block. The phase of every voxel in one block has a common integer offset; thus, each block can be treated as a unit. The largest block is selected as the starting block. The growing-block is selected by considering the Euclidean distance between between each block. The local polynomial fitting approach is implemented on the voxels in the growing-block that are closest to the unwrapped regions and the voxels in the unwrapped regions that are closest to the growing-block to obtain the optimal integer offset for the growing-block. After all the blocks are unwrapped, the residual voxels are unwrapped based on the quality-guided region-growing local polynomial fitting method. The phase derivative is calculated as the quality criterion to improve the residual-voxel unwrapping.To evaluate the performance of proposed method on the simulation, two different 3D phase models were used: One is Gaussian phase ball (100×100×100): $$\mu_{x,y,z}=100\ast \mathrm{e}^{\frac{-x^{2}-y^{2}-z^{2}}{2}}$$standard deviations (SD) is 20 voxels. The magnitude increased from 10 to 100 with an increasement of 10 to consider the affection of signal-to-noise ratio (SNR). Another is (101×101×51): $$\mu_{x,y,z}=5\ast [(\frac{sin(x)}{x})(1.50-z)+\frac{sin(y)}{y}(0.49+z)]$$which is a more generalized and complicated simulation [8]. The magnitude was set to 50. Gaussian noise with SD of 20 and 10 rad were separately added to the two complex data. The misclassification ratio (MCR) [4] was calculated as the incorrect unwrapped voxel ratio to quantitatively evaluate the performance of proposed method. The simulation was repeated 30 times, and the means and SDs of MCRs (%) were calculated.
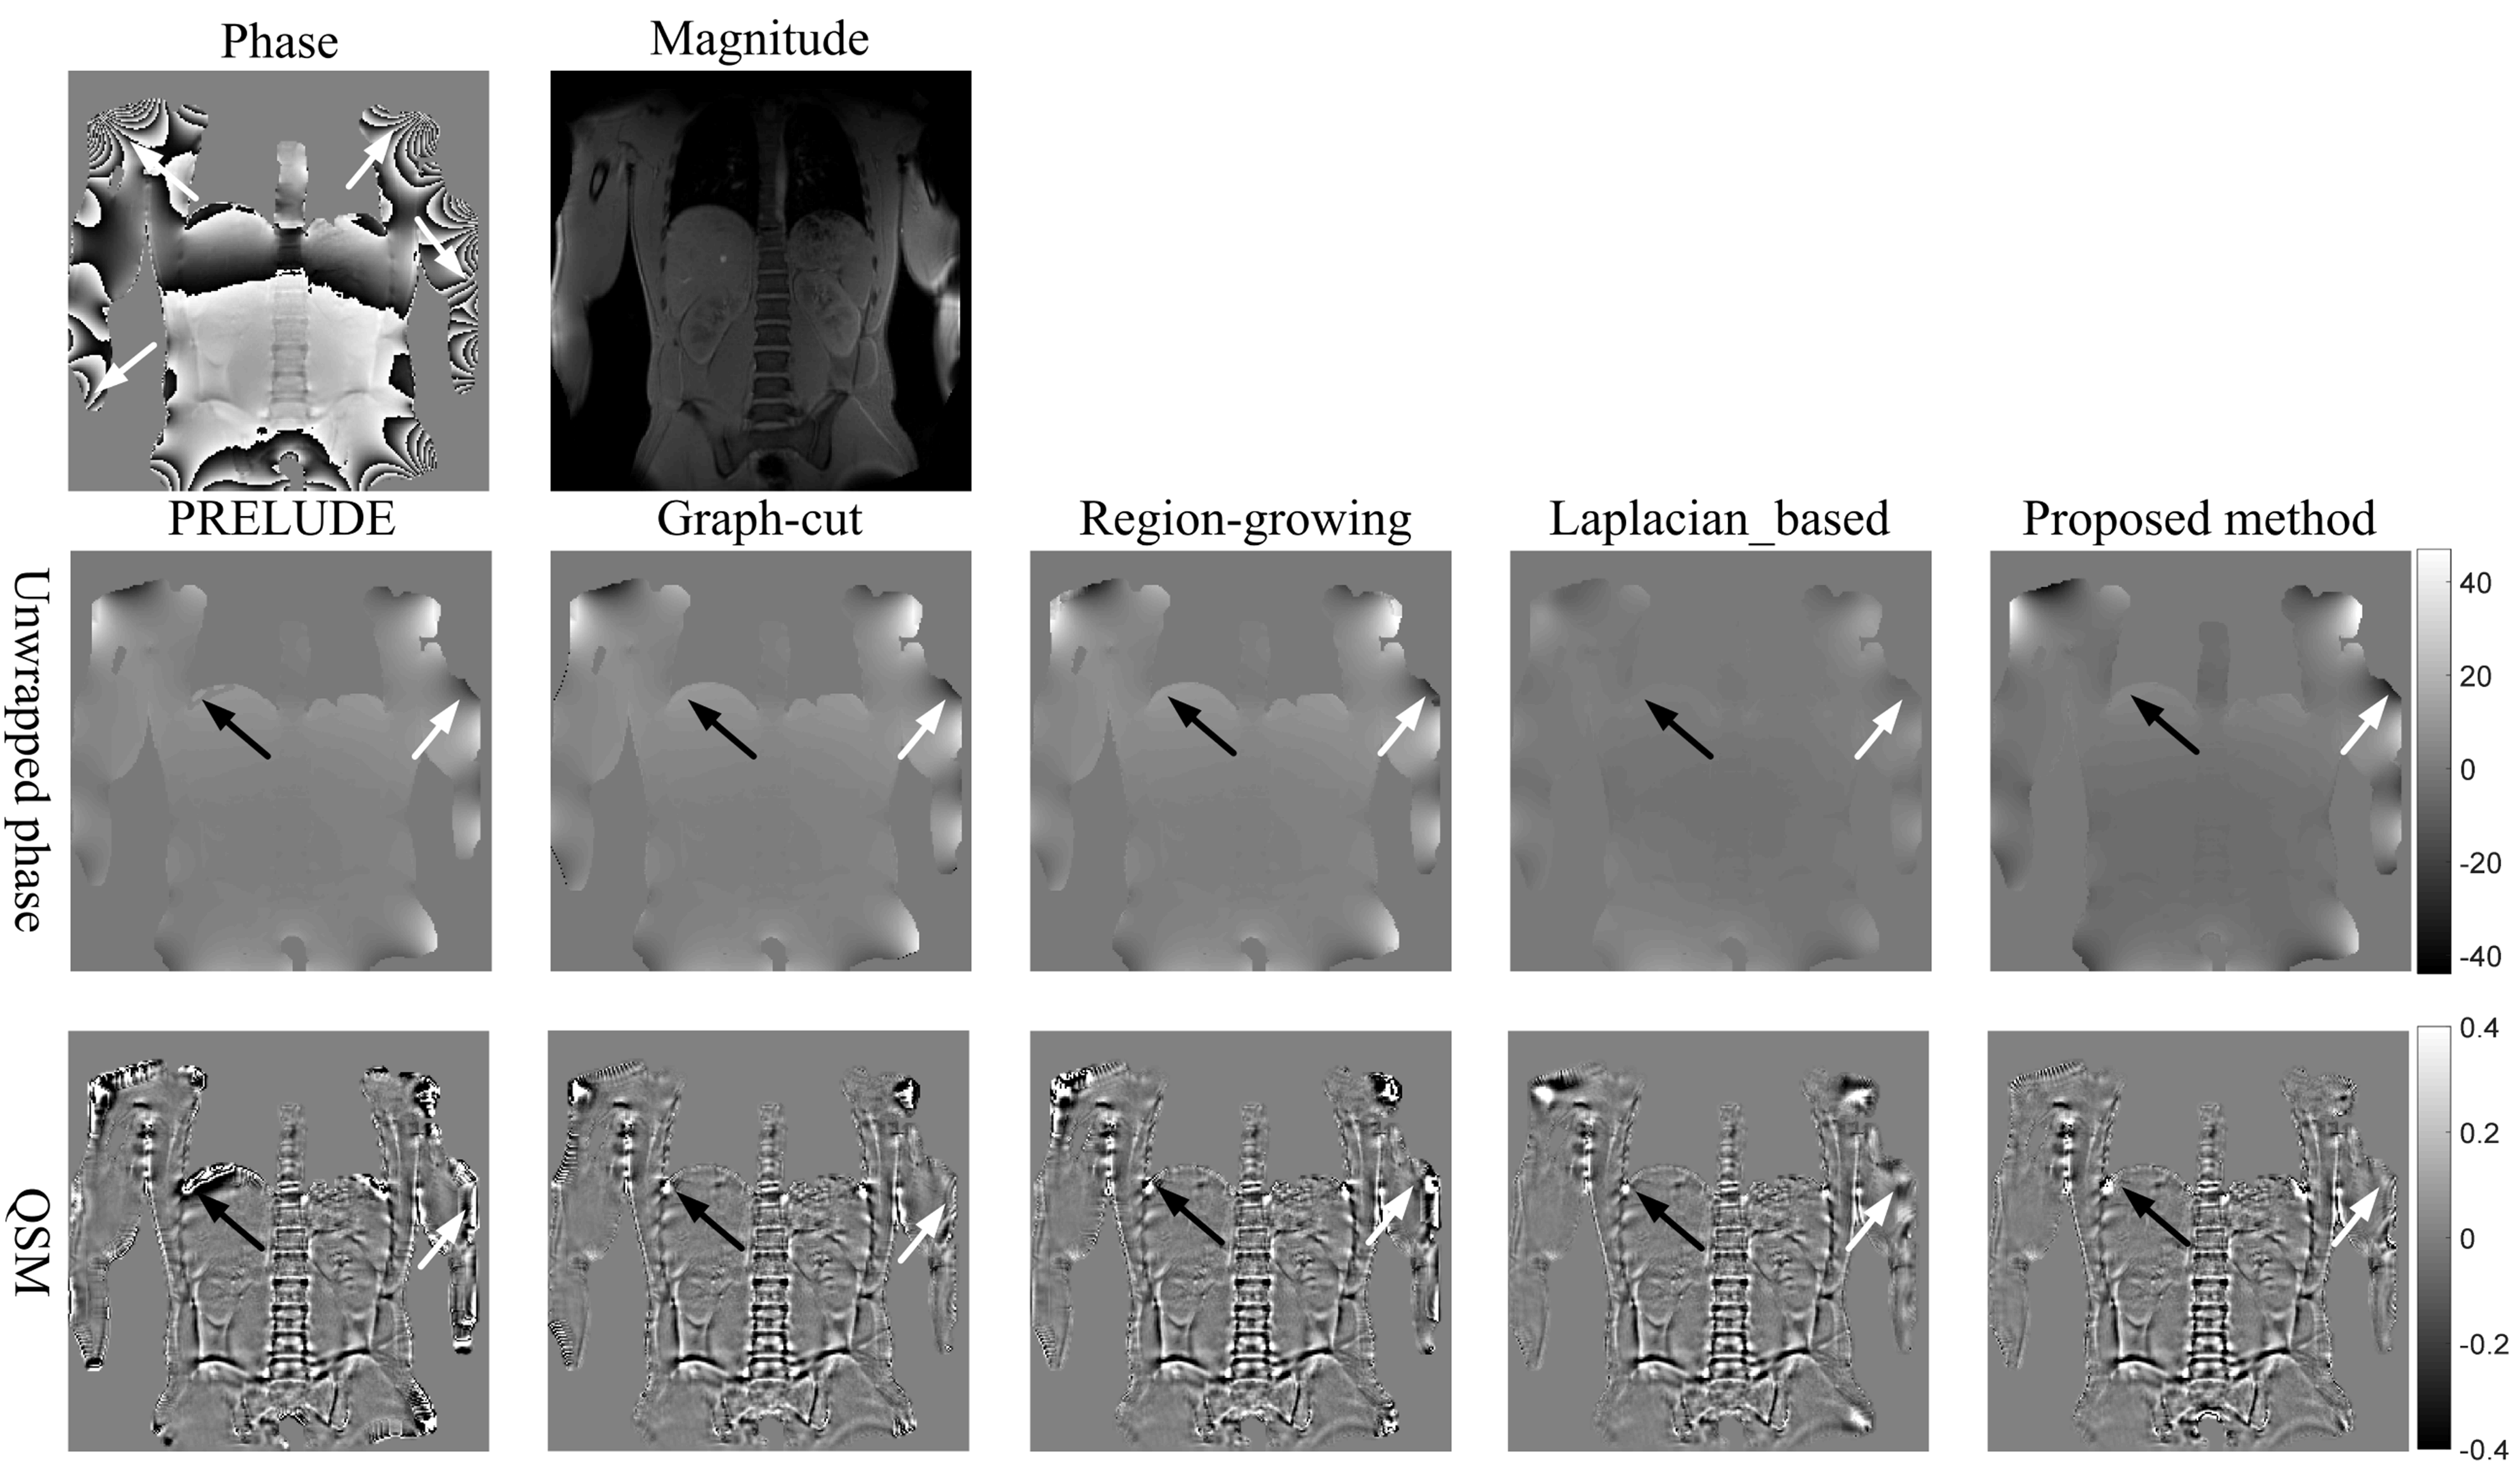
The in vivo abdominal data [9] was obtained on a 3T MRI scanner (Magnetom Prisma; Siemens) in 1 man volunteer using 2D gradient echo breath-hold sequence (voxel size =1.95×1.95×5 mm3, number of slices=10, flip angle=20°, TE=4.92 ms, TR=71 ms, bandwidth=930 Hz/pixel, scan time=7.5 seconds). The variable-radius sophisticated harmonic artifact reduction for phase data [10] and a 2‐level QSM reconstruction algorithm called STAR‐QSM [11] with default parameters were used to remove the background field and calculate the susceptibility map. The program was implemented in MatLab (R2016B; MathWorks, Natick, MA) on a desktop computer.
Results and Conclusion
The results of PRELUDE, graph-cut and Laplacian-based methods contain residues (white arrows), while proposed method obtains smooth phase in Fig.1; The MCRs of PRELUDE, graph-cut and Laplacian-based methods are separately 4.28±0.06, 2.26±0.02 and 20.65±0.02, while the proposed method MCR is 0.01±0.01. In Figure 2, the region-growing method obtained the worst result, PRELUDE and graph-cut methods were suboptimum, while proposed method acquired the perfect unwrapped map. The MCRs of PRELUDE, graph-cut, region-growing and proposed methods are separately 10.33±9.80, 20.71±1.19, 84.47±6.62 and 0.01±0.01.Figure 3 shows the phase-unwrapping and QSM results of PRELUDE, graph-cut, region-growing, Laplacian-based and proposed algorithms, respectively. The open-end cutlines [1] at the edge of the phase map (white arrows) lead the results of the five methods still contains discontinuities, while proposed algorithm shows the unwrapped phase with the least residues. The resulting susceptibility maps exhibit errors attributed to the residues for the five methods (white arrows). The five algorithms show streaking artifacts close to the ribs (black arrows), which may be caused by the significantly lower susceptibility of the ribs [9]. Overall, proposed algorithm displays the susceptibility map with the least artifacts.
In this work, a novel 3D PU method is presented. The simulated experiments demonstrate proposed method can obtain perfect unwrapped results even in the regions with low SNR and rapidly-changed phase. The abdominal QSM is challenging for large changes in susceptibility and regions with low SNR, proposed method have acquired the best results, and might be a good option for abdominal QSM.
Acknowledgements
No acknowledgement found.References
[1] Ma J. Dixon techniques for water and fat imaging. J Magn Reson Imaging, 2008, 28(3): 543-558.
[2] Haacke EM, Liu S, Buch S, et al. Quantitative susceptibility mapping: current status and future directions. Magn Reson Imaging, 2015, 33(1): 1-25.
[3] Rauscher A, Sedlacik J, Barth M, et al. Magnetic susceptibility-weighted MR phase imaging of the human brain. American Journal of Neuroradiology, 2005, 26(4): 736-742.
[4] Jenkinson M. Fast, automated, N-dimensional phase-unwrapping algorithm. Magn Reson Med, 2003, 49(1): 193-197.
[5] Dong J, Chen F, Zhou D, et al. Phase unwrapping with graph cuts optimization and dual decomposition acceleration for 3D high‐resolution MRI data. Magn Reson Med, 2017, 77(3): 1353-1358.
[6] Liu J, Liu T, de Rochefort L, et al. Morphology enabled dipole inversion for quantitative susceptibility mapping using structural consistency between the magnitude image and the susceptibility map. NeuroImage. 2012;59:2560–2568.
[7] Schofield M A, Zhu Y. Fast phase unwrapping algorithm for interferometric applications. Optics letters, 2003, 28(14): 1194-1196.
[8] Liu W, Tang X, Ma Y, et al. 3D phase unwrapping using global expected phase as a reference: application to MRI global shimming. Magn Reson Med, 2013, 70(1): 160-168.
[9] Bechler E, Stabinska J, Wittsack H J. Analysis of different phase unwrapping methods to optimize quantitative susceptibility mapping in the abdomen. Magn Reson Med, 2019, 82(6): 2077-2089.
[10] Wu B, Li W, Guidon A, Liu C. Whole brain susceptibility mapping using compressed sensing. Magn Reson Med. 2012;67:137–147.
[11] Wei H, Dibb R, Zhou Y, et al. Streaking artifact reduction for quantitative susceptibility mapping of sources with large dynamic range. NMR Biomed. 2015;28:1294–1303.
Figures