3677
Automated MR HIC Determination using Deep Learning and Frangi Filters1Research Imaging NSW, University of New South Wales, Sydney, Australia, 2Diagnostic Imaging, St. Jude Children's Research Hospital, Memphis, TN, United States, 3Biomedical Engineering, University of Memphis, Memphis, TN, United States, 4Hematology, St. Jude Children's Research Hospital, Memphis, TN, United States
Synopsis
Hepatic iron content (HIC) quantification requires segmentation. Deep learning and Frangi Filtering allow to fully automate segmentation. 664 manually segmented data sets were available for training and testing a UNET. Data sets segmented by UNET were Frangi filtered for vessel exclusion, HIC was calculated using a published calibration, and correlated with HIC obtained with manual segmentation. Very good correlation (R2 > 0.99) with a correlation line close to unity was found. Fully automated HIC quantification using deep learning and Frangi filtering can lead to significant time savings in clinical practice.
Introduction
Hepatic iron content (HIC) quantification1-4 requires liver segmentation or ROI selection, which can be cumbersome and potentially introduce user bias. Typically a radiologist circumscribes the whole liver on an imaging slice at the height of the portal vein, uses subsequent histogram filtering to exclude blood vessels, and finally calculates HIC values from the remaining liver parenchyma by applying a calibration equation4,5. This process can be partially automated by using, e.g. Frangi Filtering to exclude vessels6. The purpose of this study is to fully automate MR HIC determination and to report HIC values without any user input. This is accomplished by use of deep learning using UNET7 for liver segmentation and Frangi filtering8 for vessel exclusion.Methods
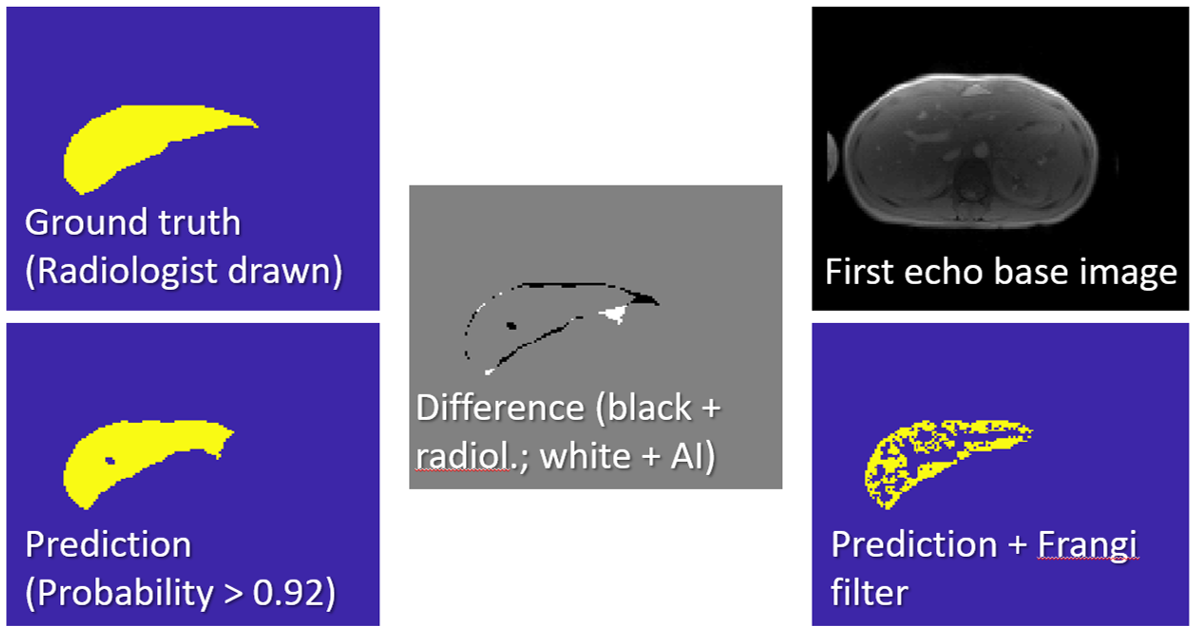
Data from a total of 664 examinations were collected from 300 patients (141m/159f). Patient’s age at exam ranged from 1.1 years to 53.6 years with a median of 14 years. The liver data were initially manually processed as previously described5. For automatic processing, 80% of the data sets (551) were randomly assigned as training data sets, the rest (133) were held back for testing. The manually segmented liver ROI (before histogram analysis) was used as ground truth for deep learning. Automatic segmentation was performed in U-NET7, a Convolutional Neural Network (CNN)9,10. All data sets were prepared by performing a bias field correction (N4ITK11), and then normalized and zero-padded to the same size. The corrected and standardized training images and the manual segmentation results were presented to a U-NET that was implemented in TENSORFLOW12. The optimal configuration consisted of 3 down-sampling layers that were followed by 3 up-sampling layers. In each layer two consecutive 3x3 convolutions were performed before 2x2 maxpooling/upsampling to get to the next layer. After training, the model was used to segment the test data set, which was prepared in the same fashion as the training data. To test the AI performance, the predictions of the model were compared against the ground truth using DICE. After segmentation, the largest contiguous area was chosen and Frangi Filtering was performed based on the R2* map6. The mean T2* value was calculated from the residual pixels and converted to HIC values using an iron calibration equation5. Finally, the AI obtained HIC values were correlated with the clinically reported HIC values.Results
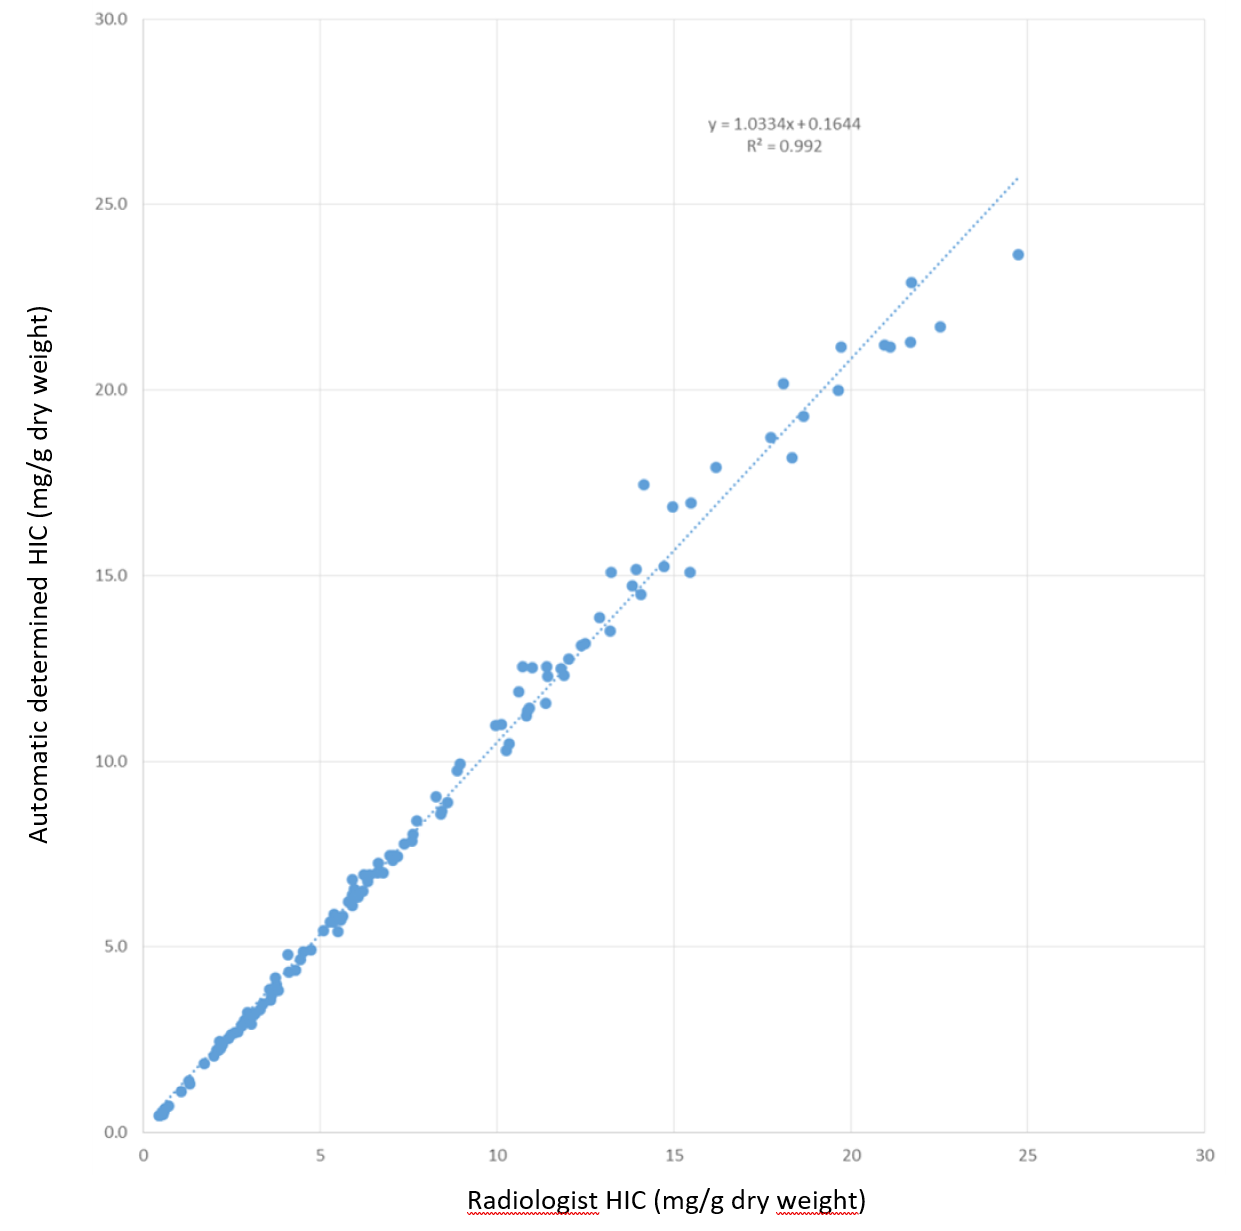
All 551 randomly chosen data sets were used for learning irrespective of outcome of the manual segmentation. Of the 133 test data sets, 13 were flagged by the radiologist as technical failures (iron content too high), therefore these cases could not be used for correlation. The liver was accurately segmented by the algorithm (DICE > 0.88). Figure 1 shows an example of the segmentation. Figure 2 shows the correlation of the HIC reported by the radiologist with the HIC calculated for the automated process for the 120 cases for which a reliable HIC was reported by the radiologist. Linear correlation yields a slope of 1.03 with an intercept of 0.16, which is very close to identity with an R2 of 0.992. In the 13 cases with suspected massive iron, where no HIC values were reported, the residual area obtained with the automatic algorithm was less than 300 pixels (5-256, mean = 107), whereas the pixel number was always higher than 300 in the other 120 cases (304-1873, mean = 932).Discussion
We presented a fully automated processing pipeline that removes subjective steps from the MR-HIC quantification. Pipeline output is a report with a quantitative HIC value. Automatic and manual results are in very good agreement, although the DICE score of the segmentation step is relatively low. The reason for this is that the scope of the original segmentation was not to exactly trace all liver parenchyma, rather the bulk of the liver. In this study a cut-off value for reliability was identified (300 pixel minimum segmentation volume). Deep learning alone was not able to satisfactorily segment the target volume. However, in conjunction with Frangi filtering and some reasonable assumptions, the results were very good. The next steps will be to test the model with different input images and potentially different acquisition modules including UTE, which has proven useful for highly iron overloaded subjects13.Conclusion
Deep learning as part of a postprocessing pipeline allows to fully automate MR HIC determination. The quantitative HIC value can be presented right after the MR measurement without any subjective manual postprocessing steps, which will speed up data interpretation.Acknowledgements
We thank Bogdan Mitrea for help in implementation and Jure Zbontar from Facebook for helpful discussions.References
1. Anderson, L. J. et al. Cardiovascular T2-star (T2*) magnetic resonance for the early diagnosis of myocardial iron overload. Eur Heart J 22, 2171-2179, doi:10.1053/euhj.2001.2822 (2001).
2. Wood, J. C. et al. MRI R2 and R2* mapping accurately estimates hepatic iron concentration in transfusion-dependent thalassemia and sickle cell disease patients. Blood 106, 1460-1465, doi:10.1182/blood-2004-10-3982 (2005).
3. St Pierre, T. G. et al. Noninvasive measurement and imaging of liver iron concentrations using proton magnetic resonance. Blood 105, 855-861, doi:10.1182/blood-2004-01-0177 (2005).
4. Hankins, J. S. et al. R2* magnetic resonance imaging of the liver in patients with iron overload. Blood 113, 4853-4855, doi:10.1182/blood-2008-12-191643 (2009).
5. McCarville, M. B. et al. Comparison of whole liver and small region-of-interest measurements of MRI liver R2* in children with iron overload. Pediatric radiology 40, 1360-1367, doi:10.1007/s00247-010-1596-8 (2010).
6. Tipirneni-Sajja, A. et al. Automated vessel exclusion technique for quantitative assessment of hepatic iron overload by R2*-MRI. J Magn Reson Imaging 47, 1542-1551, doi:10.1002/jmri.25880 (2018).
7. Ronneberger, O., Fischer, P. & Brox, T. in Medical Image Computing and Computer-Assisted Intervention – MICCAI 2015 (eds Nassir Navab, Joachim Hornegger, William M. Wells, & Alejandro F. Frangi) 234-241 (Springer International Publishing, Cham, 2015).
8. Frangi, A. F., Niessen, W. J., Vincken, K. L. & Viergever, M. A. in Medical Image Computing and Computer-Assisted Intervention – MICCAI 1998. (eds W.M. Wells, A. Colchester, & S. Delp) 130-137 (Springer International Publishing).
9. Collobert, R. & Weston, J. in Proceedings of the 25th international conference on Machine learning 160-167 (ACM, Helsinki, Finland, 2008).
10. Krizhevsky, A., Sutskever, I. & Hinton, G. E. in Advances in neural information processing systems 1097-1105 (Lake Tahoe, NV 2012).
11. Tustison, N. J. et al. N4ITK: improved N3 bias correction. IEEE Trans Med Imaging 29, 1310-1320, doi:10.1109/TMI.2010.2046908 (2010).
12. Akeret, J., Chang, C., Lucchi, A. & Refregier, A. Radio frequency interference mitigation using deep convolutional neural networks. Astron Comput 18, 35-39, doi:10.1016/j.ascom.2017.01.002 (2017).
13. Krafft, A. J. et al. Quantitative ultrashort echo time imaging for assessment of massive iron overload at 1.5 and 3 Tesla. Magn Reson Med 78, 1839-1851, doi:10.1002/mrm.26592 (2017).
Figures