3674
Quantitative MRI Metrics in Routine Clinical Practice: A Validation Study from a Large Heterogeneous Cohort of Multiple Sclerosis Patients1Biogen, Cambridge, MA, United States, 2Advanced Clinical Imaging Technology, Siemens Healthcare AG, Lausanne, Switzerland, 3Department of Radiology, Lausanne University Hospital and University of Lausanne, Lausanne, Switzerland, 4LTS5, École Polytechnique Fédérale de Lausanne (EPFL), Lausanne, Switzerland, 5Washington University in St. Louis, St. Louis, MO, United States, 6Department of Neurology, Johns Hopkins University School of Medicine, Baltimore, MD, United States, 7Cleveland Clinic Lou Ruvo Center for Brain Health, Cleveland, OH, United States, 8Cleveland Clinic, Cleveland, OH, United States, 9Center of Clinical Neuroscience, 'Carl Gustav Carus' University Hospital, Technische Universitaet, Dresden, Germany, 10New York University, New York, NY, United States, 11Vall d’Hebron University Hospital, Barcelona, Spain, 12University of Rochester Medical Center, Rochester, NY, United States
Synopsis
Use of MRI metrics for routine monitoring of MS patients has been hindered by lack of standardization, imprecise measurements, and workflow hurdles. To overcome these challenges, we developed a novel prototype, MSPie, as part of the MS PATHS initiative. The goal of this study was to assess the validity and suitability of MRI metrics automatically computed by MSPie in the MS clinical workflow.
INTRODUCTION
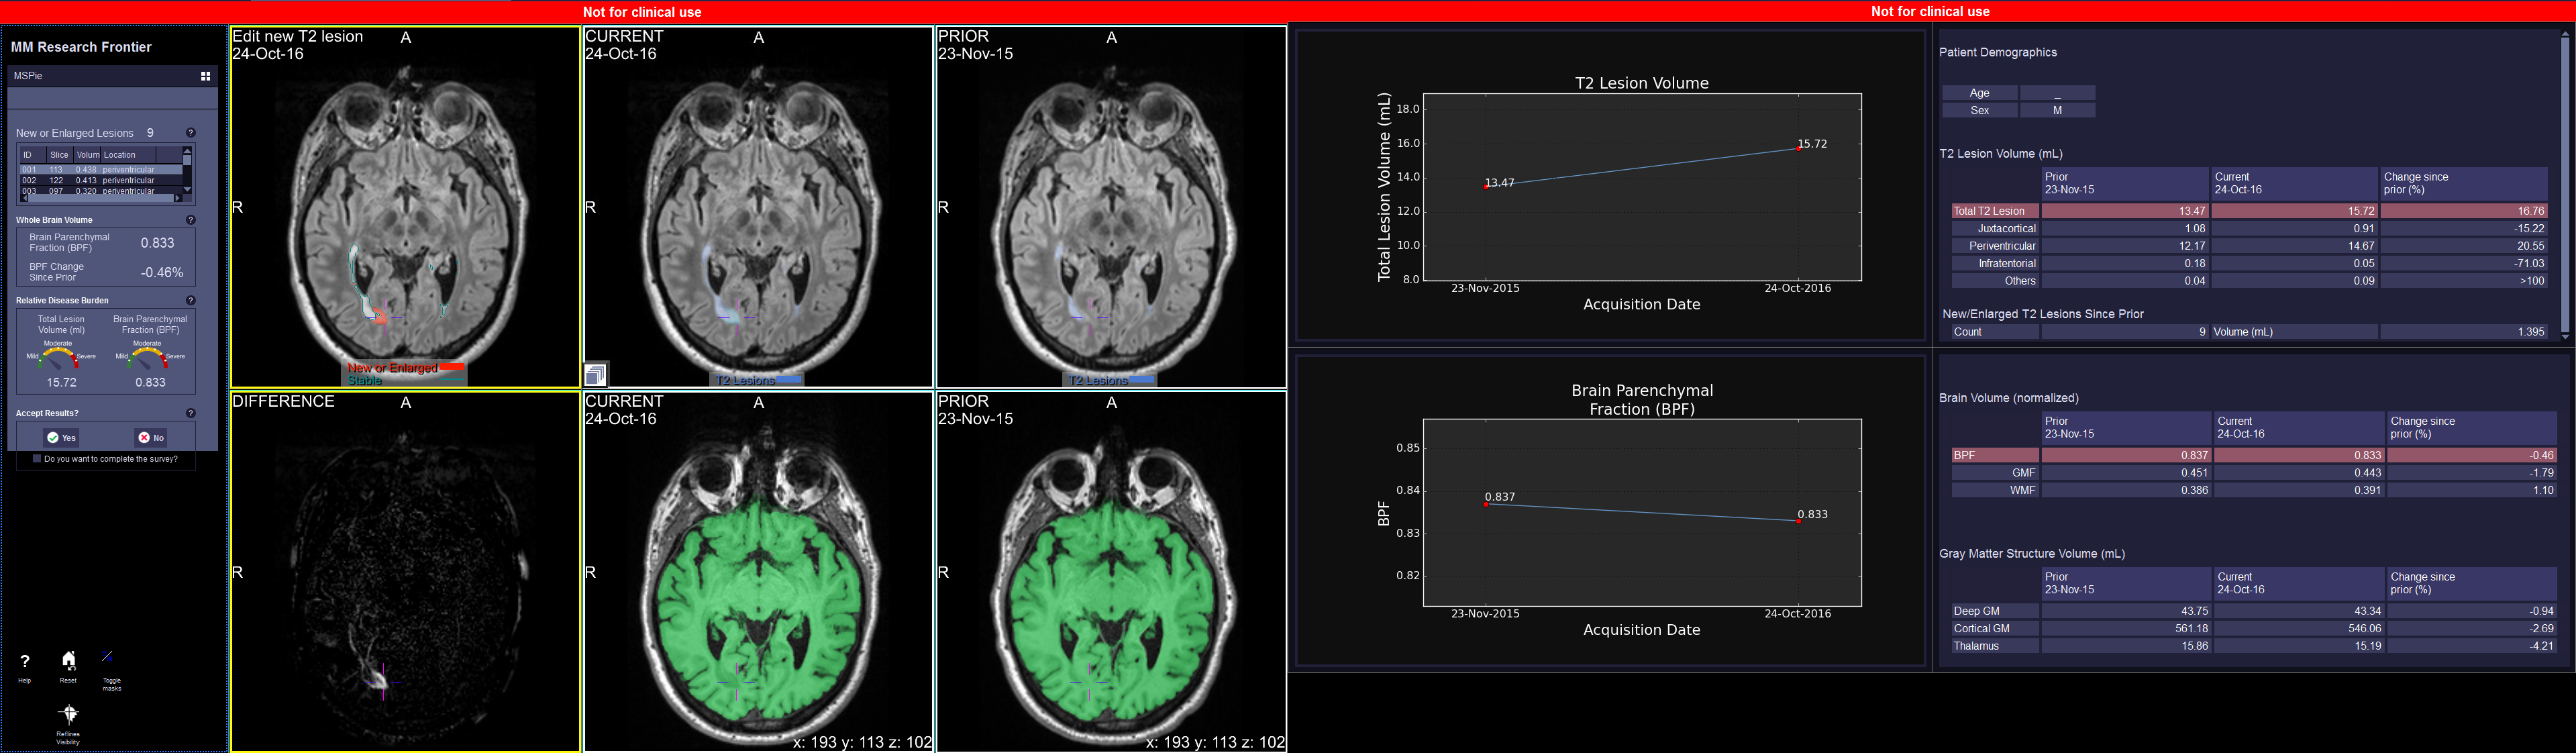
Clinical assessment of multiple sclerosis (MS) patients typically includes subjective, qualitative evaluations of disability and brain MRI. In contrast, at the 10 MS centers participating in Multiple Sclerosis Partners Advancing Technology and Health Solutions (MS PATHS)(1), research-quality, standardized, quantitative data are generated as part of routine clinical practice. Quantitative neuroperformance and patient self-reports are collected using an iPad based device called the MSPT (Multiple Sclerosis Performance Test)(2,3). Standardized brain MRIs are analyzed using MSPie (MS PATHS Image Evaluation; Figure 1), a new prototype software (Siemens Healthcare, Erlangen, Germany) developed to integrate reliable MRI metrics into the clinical workflow. MSPie automatically analyzes standardized T1w and T2w images to estimate brain parenchymal fraction (BPF), T2 lesion volume (T2LV) and new/enlarged T2 lesion count.For any software to be clinically useful for evaluating brain atrophy in individual MS patients, the metric must be highly precise. Accordingly, MSPie design criteria included a target BPF measurement error <0.25% (knowing that mean brain atrophy in MS =0.4-0.5%/year(4)). An initial MSPie scan-rescan study demonstrated a coefficient of variation (CV)=0.16%(5), however measurement errors in real-world data have not previously been evaluated.
MSPie has a graphical interface designed for radiologists to visualize changes in T2 lesions and perform one-click edits to new/enlarged T2 lesions, if needed. To be considered acceptable in the radiology workflow, the lesion detection algorithm is designed to achieve high accuracy, with a target total false positive (FP) and false negative (FN) ≤3 in individual patient.
The goal of this study was to further validate MSPie generated metrics using real-world data from a large heterogenous group of MS patients and assess the feasibility for use in the clinical workflow.
METHODS
Standardized T1w and T2w 1-mm isotropic 3D images (MPRAGE: TR=2300ms, TE=2.96ms, TI=900ms; FLAIR: TR=5000ms, TE=392ms, TI=1800ms) acquired at 3T scanners (all Siemens Healthcare, Erlangen, Germany) were collected as part of routine care in ten MS PATHS sites. Images were analyzed by MSPie to measure BPF, new/enlarged T2 lesion count, and T2LV. BPF was computed using a novel algorithm that combines BPF measurements from two independent and fully automated algorithms: FLAIR images are analyzed using a modified version of autosegMS (Cleveland Clinic)(6,7), and MPRAGE images are analyzed using the MorphoBox-MSPie prototype (Siemens Healthcare, Erlangen, Germany)(8,9). The combined BPF (BPFMSPie) is computed using a weighted average of the two BPF values(5). The prototype LeManPV (Siemens Healthcare, Erlangen, Germany) was used to assess new/enlarged T2 lesions(10) and to measure T2LV(11,12).A subset of patients with MRIs ≥4 time points were used to evaluate real-world reliability of BPFMSPie. Measurement error (Root mean squared error (RMSE) from the best-fit line) was computed for BPFMSPie, BPFFLAIR, and BPFT1 for each patient, and proportions of patients with RMSE<0.25% were compared across the three BPF measures. Factors associated with higher RMSE were also investigated by non-parametric hypothesis tests.
In addition, 40 longitudinal pairs of image sets were selected to validate new/enlarged T2 lesion detection in MSPie. Images were analyzed by a third party (NeuroRX, Montreal, Canada) where three expert readers identified new T2/enlarged lesions by consensus to establish a ground truth data set. The proportion of cases that met the pre-defined criteria (FP+FN≤3) was determined.
Spearman correlations were assessed between MSPie metrics and disability including patient-determined disease steps (PDDS)(13), walking speed (WST, timed 25-foot walk), manual dexterity (MDT, 9-hole peg test), and processing speed (PST, symbol digit modalities test).
RESULTS
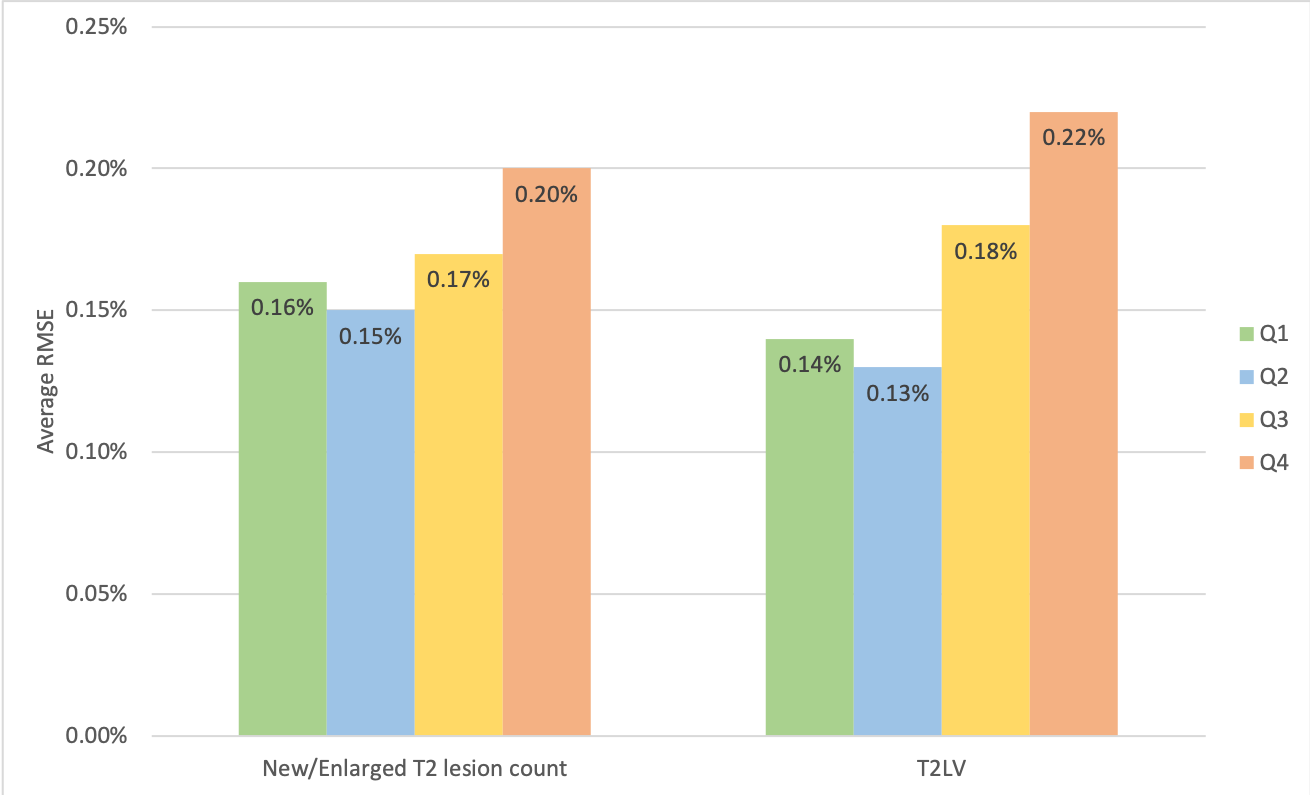
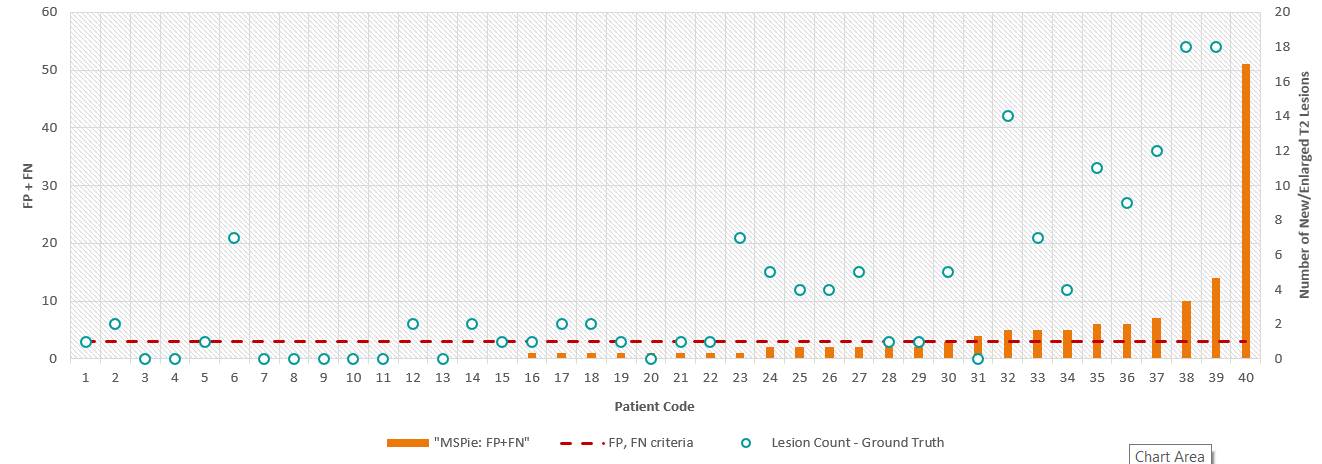
Using MSPie, 11,385 sets of MRI metrics were calculated for 7,140 unique MS patients (mean age 45.8 years, 78% female, 68% relapsing MS). For BPFMSPie, the mean RMSE was 0.17%, and 81% of individual patients had RMSE <0.25%. In comparison, BPFT1 mean RMSE was 0.32% and 43% of patients had RMSE below cutoff; BPFFLAIR mean RMSE was 0.22% with 68% of patients below cutoff. Higher fluctuations in BPFMSPie were associated with higher T2LV (p<0.0001) and new/enlarged T2 lesion count (p=0.05; Figure 2). BPFMSPie fluctuations were not associated with scanner changes or MS treatment switches.In terms of new/enlarged T2 lesions evaluation, 25% (10/40) of the cases exceeded the pre-defined criteria (Figure 3). The median/median absolute deviation was 1/1, and 0/0 for FP and FN, respectively.
Using all available data, BPFMSPie and T2LV correlated with PDDS (r=-0.33; r=0.29, for BPFMSPie and T2LV, respectively) and neuroperformance z-scores (compared against expected performance for age, sex, and education): WST (r=0.24; r=-0.21), MDT (r=0.30; r=-0.29), and PST (r=0.34; r=-0.37). All correlations are significant (p<0.0001).
DISCUSSION
Consistent with the previous scan-rescan study, BPFMSPie demonstrated low measurement error in real-world data, and a high proportion of patients (81%) had RMSE <0.25%, suggesting it can be used clinically for disease monitoring at an individual patient level. High accuracy in the new/enlarged T2 lesion segmentation was achieved in a majority of cases within the defined criteria (FP+FN≤3). Cases above the cut-point were primarily in patients with very high lesion activity (18-57 new/enlarged lesions). Finally, correlations of MSPie metrics with neuroperformance scores are in agreement with literature(14) confirming validity of the MSPie metrics.CONCLUSION
High reproducibility at the individual patient level suggests that MSPie might be suitable for monitoring MS patients in clinical practice. Formal in-clinic testing is ongoing in MS PATHS.Acknowledgements
This study was sponsored by Biogen (Cambridge, MA, USA). Siemens Healthineers provided assistance with MRI sequences and implementation.References
1. Mowry EM, Bermel RA, Balcer LJ, Cassard SD, Fisher E, Izbudak I, Jones SE, Kister I, Kreuger G, Lui YW, Perryman J, Sickert D, Williams JR, Rudick RA. Harnessing Real-time Patient Data to Improve Clinical Outcomes and Research: The Multiple Sclerosis Partners Advancing Technology and Health Solutions (MS PATHS) Initiative. 2015; Barcelona, Spain.
2. Rudick RA, Miller D, Bethoux F, Rao SM, Lee JC, Stough D, Reece C, Schindler D, Mamone B, Alberts J. The Multiple Sclerosis Performance Test (MSPT): an iPad-based disability assessment tool. J Vis Exp 2014(88):e51318.
3. Rhodes JK, Schindler D, Rao SM, Venegas F, Bruzik ET, Gabel W, Williams JR, Phillips GA, Mullen CC, Freiburger JL, Mourany L, Reece C, Miller DM, Bethoux F, Bermel RA, Krupp LB, Mowry EM, Alberts J, Rudick RA. Multiple Sclerosis Performance Test: Technical Development and Usability. Advances in Therapy 2019;36(7):1741-1755.
4. De Stefano N, Giorgio A, Battaglini M, Rovaris M, Sormani MP, Barkhof F, Korteweg T, Enzinger C, Fazekas F, Calabrese M, Dinacci D, Tedeschi G, Gass A, Montalban X, Rovira A, Thompson A, Comi G, Miller DH, Filippi M. Assessing brain atrophy rates in a large population of untreated multiple sclerosis subtypes. Neurology 2010;74(23):1868-1876.
5. Tsang A, Su Y-C, Perea RD, Corredor-Jerez R, Fartario MJ, Huelnhagen T, Ravano V, Marechal B, Kober T, Bermel RA, Jones SE, Izbudak I, Lui YW, Krupp L, Mowry EM, Williams JR, Rudick RA, Fisher E. Brain volume measurements in multiple sclerosis patients: a novel combination approach for routine clinical assessment in MS PATHS. 2019; Montreal, QC, Canada.
6. Fisher E, Jr. RMC, Tkach JA, Masaryk TJ, Cornhill JF. Knowledge-based 3D segmentation of the brain in MR images for quantitative multiple sclerosis lesion tracking: SPIE; 1997.
7. Rudick RA, Fisher E, Lee JC, Simon J, Jacobs L. Use of the brain parenchymal fraction to measure whole brain atrophy in relapsing-remitting MS. Multiple Sclerosis Collaborative Research Group. Neurology 1999;53(8):1698-1704.
8. Roche A, Forbes F, Alzheimer's Disease Neuroimaging I. Partial volume estimation in brain MRI revisited. Med Image Comput Comput Assist Interv 2014;17(Pt 1):771-778.
9. Schmitter D, Roche A, Marechal B, Ribes D, Abdulkadir A, Bach-Cuadra M, Daducci A, Granziera C, Kloppel S, Maeder P, Meuli R, Krueger G, Alzheimer's Disease Neuroimaging I. An evaluation of volume-based morphometry for prediction of mild cognitive impairment and Alzheimer's disease. Neuroimage Clin 2015;7:7-17.
10. Fartaria MJ, Kober T, Granziera C, Bach Cuadra M. Longitudinal analysis of white matter and cortical lesions in multiple sclerosis. Neuroimage Clin 2019;23:101938.
11. Fartaria MJ, Bonnier G, Roche A, Kober T, Meuli R, Rotzinger D, Frackowiak R, Schluep M, Du Pasquier R, Thiran JP, Krueger G, Bach Cuadra M, Granziera C. Automated detection of white matter and cortical lesions in early stages of multiple sclerosis. J Magn Reson Imaging 2016;43(6):1445-1454.
12. Fartaria MJ, Roche A, Meuli R, Granziera C, Kober T, Bach Cuadra M. Segmentation of Cortical and Subcortical Multiple Sclerosis Lesions Based on Constrained Partial Volume Modeling. Medical Image Computing and Computer Assisted Intervention − MICCAI 2017; 2017; Cham. Springer International Publishing. p 142-149. (Medical Image Computing and Computer Assisted Intervention − MICCAI 2017).
13. Learmonth YC, Motl RW, Sandroff BM, Pula JH, Cadavid D. Validation of patient determined disease steps (PDDS) scale scores in persons with multiple sclerosis. BMC Neurology 2013;13(1):37.
14. Mammi S, Filippi M, Martinelli V, Campi A, Colombo B, Scotti G, Canal N, Comi G. Correlation between brain MRI lesion volume and disability in patients with multiple sclerosis. Acta Neurol Scand 1996;94(2):93-96.
Figures