3673
Evaluation of quantitative MRI parameters reproducibility across a major scanner upgrade: the example of T1
Ratthaporn Boonsuth1, Marco Battiston1, Francesco Grussu1,2, Marios C. Yiannakas1, Torben Schneider3, Rebecca S. Samson1, Ferran Prados1, and Claudia A. M. Gandini Wheeler-Kingshott1,4,5
1NMR research Unit, Queen Square MS Centre, Department of Neuroinflammation, UCL Queen Square Institute of Neurology, Faculty of Brain Sciences, University College London, London, United Kingdom, 2Centre for Medical Image Computing, Department of Computer Science, University College London, London, United Kingdom, 3Philips Healthcare, Guildford, Surrey, United Kingdom, 4Brain MRI 3T Research Centre, IRCCS Mondino Foundation, Pavia, Italy, 5Department of Brain and Behavioural Sciences, University of Pavia, Pavia, Italy
1NMR research Unit, Queen Square MS Centre, Department of Neuroinflammation, UCL Queen Square Institute of Neurology, Faculty of Brain Sciences, University College London, London, United Kingdom, 2Centre for Medical Image Computing, Department of Computer Science, University College London, London, United Kingdom, 3Philips Healthcare, Guildford, Surrey, United Kingdom, 4Brain MRI 3T Research Centre, IRCCS Mondino Foundation, Pavia, Italy, 5Department of Brain and Behavioural Sciences, University of Pavia, Pavia, Italy
Synopsis
Major MRI scanner upgrades are generally required to improve performance and image quality; however, they can also potentially introduce systematic changes in quantitative MRI (qMRI) metrics and affect their accuracy and precision. To date the evaluation of the effect of scanner upgrades has focussed mainly on volumetric measurements, whereas the effect on quantitative parametric maps remains unexplored, especially when comparing analog and digital signal pathways plus multiband. Here we report findings on quantitative T1 to assess the potential effect of scanner upgrades on qMRI. We found negligible differences, suggesting that T1 measurements remain stable following a major scanner upgrade.
INTRODUCTION
Quantitative MRI (qMRI) methods can be used to characterise tissue organization and/or composition in vivo non-invasively1. Furthermore, given their quantitative nature, they are expected to be more reproducible across hardware/software configurations and time points. An MRI scanner upgrade typically consists of updating the control software as well as substituting hardware components with updated technology. This process generally aims to improve performance and image quality, while potentially introducing systematic changes in qMRI metrics2,3,4. There are many concerns, including reproducibility of quantitative parameters, the introduction of possible bias, reliability and standardization1,5 that need to be considered in the context of multi-centre and/or longitudinal studies.In this work, we aimed to characterise the effect of a major scanner upgrades on quantitative matrices, while also taking advantage of novelties for acceleration or increased resolution. The change consisted of software and hardware improvements from a 3T Philips Achieva system upgraded to a 3T Philips Ingenia CX, with digital broadband architecture. We take the quantitative longitudinal relaxation time T1 as a case study, since it represents a primary parameter in MRI widely used as a surrogate marker of tissue integrity6, but aim to present a more comprehensive set of qMRI metrics in the near future.
METHODS
Participants: The same three healthy controls (2 males, 1 female, age range 29-35) were scanned four times pre- and four times post-upgrade.MR imaging: Imaging was performed with a 32-channel head receive-only coil on a 3T Philips MRI system (Achieva on software release 3 upgraded to Ingenia CX on release 5 with multiband technology7, after 9 years of operation). The 32-channel coil for post-upgrade scanning was changed with the new configuration embedding analog-to-digital conversion8. Pre- and post-upgrade protocols consisted of multiple inversion time (TI) inversion recovery (IR) scans using a multi-slice single-shot spin echo-EPI sequence with non-spatially selective inversion pulse9. Table 1 shows MRI parameters for pre- and post-upgrade, optimised independently to take advantage of the upgrade.
Image analysis
Image registration and quantification: IR images were corrected for EPI distortions with FSL topup10,11 and then warped to MNI space using NiftyReg reg_f3d12.
T1fitting: Non-linear least-squares fitting with custom-written Python code provided T1voxel-wise maps.
Subject analysis: We evaluated distributions of T1 values within white matter (WM) and grey matter (GM) of each subject, using regions-of-interest defined in MNI space.
Voxel-wise comparison: The system intra- and inter- time-point reproducibility and potential bias between time-points were evaluated, using voxel-wise comparison within the same subject. We also calculated the linear correlation index (R) of T1 values between pre- and post-upgrade and scattered on a voxel-by-voxel basis for all subjects.
Repeatability assessment: We quantified repeatability of T1 both pre- and post-upgrade to test whether the upgrade positively improved the precision of T1 measurements. We conducted the analysis in MNI space, calculating a voxel-wise intraclass correlation coefficient (ICC)13 and percentage coefficient of variation (%COV)14 using custom-written Python code based on NiPype15. ICC measures the fraction of total variability due to biological differences among subjects, while %COV provides an estimate of the amount of variability with respect to the mean population value of the metric.
RESULTS
T1 maps show known contrasts (i.e. CSF T1 > GM T1 > WM T1) and are homogenous with little variation between pre- and post-upgrade (Figure 1). The example of T1 distributions in WM and GM are illustrated in Figure 2, where values from different scanning sessions are reported along columns. Mean T1 values for all subjects pre-upgrade were 879.42ms and 1436.50ms in WM and GM respectively, while post-upgrade they were 862.83ms and 1407.42ms. The voxel-wise comparison resulted in a mean and median difference in T1 estimates from pre- and post-upgrade of 16.63ms and 11.16ms in WM, and of 29.06ms and 30.55ms in GM respectively. Figure 3 shows a positive strong correlation of T1 values between pre- and post-upgrade, with linear correlation index of 0.61 in WM and 0.88 in GM. Table 2 shows stable reproducibility figures for pre-and post-upgrade, expressed as the ICC index and %COV.DISCUSSION AND CONCLUSION
In this study, we found that T1 values post-upgrade are comparable to T1 values pre-upgrade when evaluated at the inter- and intra-subject level. T1 measurements are reproducible across the scanner upgrade. We found negligible differences in quantitative T1 values obtained pre- and post-upgrade, implying that T1 is a robust marker of WM integrity along the life-time of an MRI scanner when major upgrades are likely to happen at least once. The results presented in this study show a strong positive correlation between pre- and post-upgrade when compared on a voxel-by-voxel level. In order to assess repeatability, ICC and %COV were analysed showing a comparable variability between pre and post-upgrade. This confirms that T1 can be measured with similar or improved precision post-upgrade while enabling at the same time the use of faster sequences and increased resolution. In the near future, we also plan to expand the current evaluation and include additional qMRI metrics derived from magnetisation transfer and diffusion imaging.Acknowledgements
Acknowledgement to the UCL-UCLH Biomedical Research Centre for ongoing funding; the European Union’s Horizon 2020 research and innovation programme under grant agreement No. 634541; the Engineering and Physical Sciences Research Council (EPSRC EP/R006032/1, M020533/1); Spinal Research (UK), Wings for Life (Austria), Craig H. Neilsen Foundation (USA) (jointly funding the INSPIRED study); Wings for Life (#169111); the UK Multiple Sclerosis Society (grants 892/08 and 77/2017); Guarantors of Brain. We thank Philips Healthcare for assistance in protocol development and for access to research protocols.References
- Tofts P. Quantitative MRI of the brain: measuring changes caused by disease, John Wiley & Sons. 2005.
- Han X, Jovicich J. Salat D, et al. Reliability of MRI-derived measurements of human cerebral cortical thickness: the effects of field strength, scanner upgrade and manufacturer. Neuroimage. 2006;32:180-94.
- Jovicich J, Czanner S, Han X, et al. MRI-derived measurements of human subcortical, ventricular and intracranial brain volumes: Reliability effects of scan sessions, acquisition sequences, data analyses, scanner upgrade, scanner vendors and field strengths. Neuroimage. 2009;46:177-92.
- Potvin O, Khademi A, Chouinard I, et al. Measurement variability following MRI system upgrade. Frontiers in Neurology. 2019;10:726.
- Deoni S C, Williams S C, Jezzard P, et al. Standardized structural magnetic resonance imaging in multicentre studies using quantitative T1 and T2 imaging at 1.5 T. Neuroimage. 2008;40:662-671.
- Cheng H L, Stikov N, Ghugre N R, et al. Practical medical applications of quantitative MR relaxometry. J Magn Reson Imaging. 2012;36:805-24.
- Barth M, Breuer F, Koopmans P J, et al. Simultaneous multislice (SMS) imaging techniques. Magnetic resonance in medicine. 2016;75(1):63-81.
- Possanzini C, Harvey P R, Ham K, et al. dStream architecture. The digital revolution in MRI http://healthcare. philips. com. 2011.
- Clare S, Jezzard P. Rapid T1 mapping using multislice echo planar imaging. Magnetic Resonance in Medicine: An Official Journal of the International Society for Magnetic Resonance in Medicine, 2010;45(4):630-634.
- Andersson J L, Skare S, Ashburner J. How to correct susceptibility distortions in spin-echo echo-planar images: application to diffusion tensor imaging. Neuroimage. 2003;20: 870-88.
- Smith S M, Jenkinson M, Woolrich M W, et al. Advances in functional and structural MR image analysis and implementation as FSL. Neuroimage. 2004,23 Suppl 1;S208-19.
- Modat M, Mcclelland J, Ourselin S. Lung registration using the NiftyReg package. Medical image analysis for the clinic-a grand Challenge. 2010;33-42.
- Shrout P E, Feiss J L. Intraclass correlations: uses in assessing rater reliability. Psychol Bull. 1979;86:420-8.
- Bland J M, Altman D G. Measurement error. BMJ: British medical journal. 1996a;312: 1654.
- Gorgolewski K, Burns CD, Madison C, et al. Nipype: a flexible, lightweight and extensible neuroimaging data processing framework in Python. Front. Neuroimform. 2011;5:13.
Figures
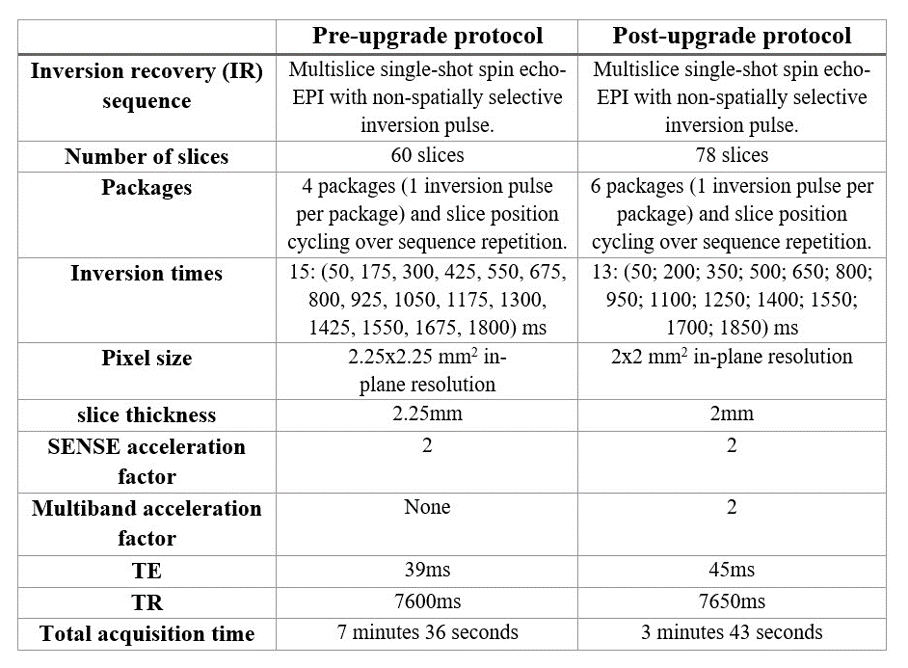
Table 1. Comparison of acquisition parameters for pre and post upgrade.
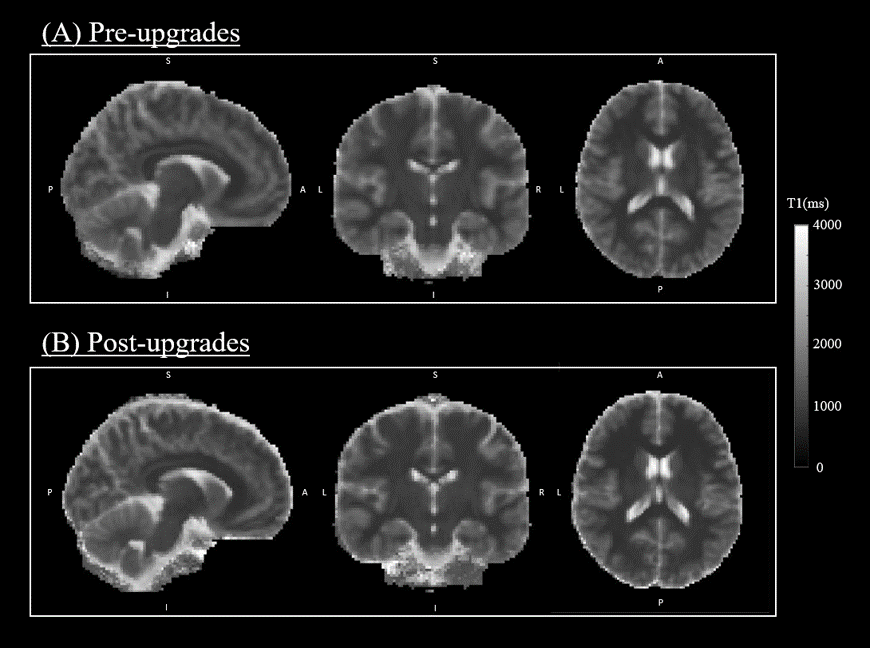
Figure 1. Example of T1 map in MNI space: pre-upgrades (A) and post-upgrades (B)
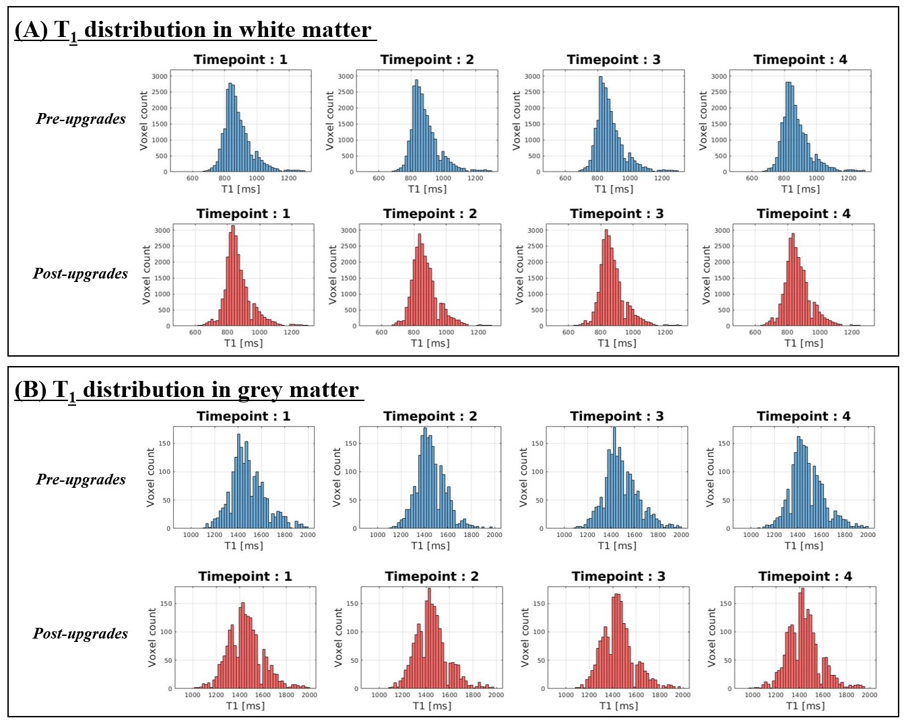
Figure 2. Example of the T1 distribution histograms
of the pre- (A) and post-upgrade (B) in white and grey matter, scanned in four different MRI sessions.
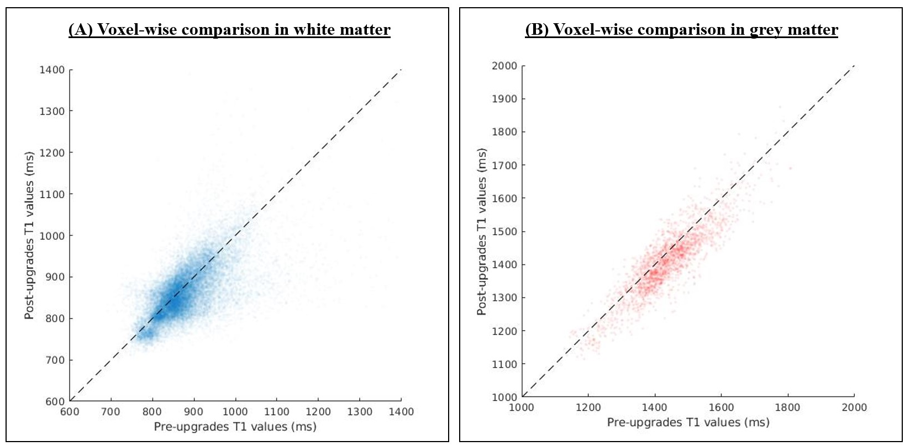
Figure 3. The scatter plot of
voxel-wise comparison of T1 values for pre- and post-upgrades
in white (A) and grey matter (B).
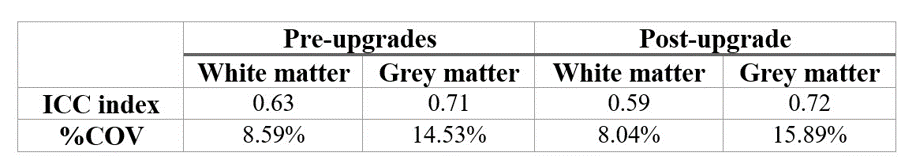
Table 2. The repeatability assessment (intraclass correlation
coefficient (ICC) and coefficient of variation (COV)) of pre- and
post-upgrade in white and grey matter.