3672
Post-acquisition image processing can reduce artifacts in UTE images
Yang Xia1, Farid Badar1, and Simon Miller1
1Physics, Oakland University, Rochester, MI, United States
1Physics, Oakland University, Rochester, MI, United States
Synopsis
Imperfect compensation for the eddy currents can cause artifacts in UTE images. Several post-acquisition processing methods can reduce artifacts in the images that are acquired in the radial k-space trajectories.
Introduction
Very short T2 relaxation times are common in biological tissues and porous media, which make them invisible by conventional spin-echo or gradient-echo based MRI. Reduction of the echo time (TE) in MRI can be achieved in Ultra-short echo (UTE) sequences. However, shortening the TE generally makes the signals susceptible to the residual eddy currents and other imperfections in the imaging system, which manifests itself as artifacts in the UTE images. In this study, we aimed to reduce the artifacts seen in the UTE images using various post-acquisition image processing techniques (regridding algorithm, oversampling, deapodization)1-3.Methods
A Bruker AVANCE II micro-imager (Billerica, MA) with a 7T/9cm vertical-bore magnet was used to image several glass phantoms that contained doped water (0.1 and 1% CuSO4). Two imaging sequences were used, a 2D UTE sequence and a multi-slice-multi-echo (MSME) sequence (in the single-slice single-echo mode). The MSME sequence had a TR of 2000 ms, TE of ~ 8 ms, and a matrix size of 256x256 with 25 mm field of view. The UTE sequence had the same imaging setting except for a TR of 100 ms and a minimum TE of 0.27 ms. The gradient trajectory was pre-measured on a glass sphere of water. A number of Matlab (Natick, MA) routines were developed to reconstruct the images from the same UTE raw data. The images were examined using ImageJ (NIH, MD) where similar ROIs were selected for comparative profiles.Results
Fig 1 shows the MSME and UTE images from (a) a single tube and (b) a multi-tube phantom. The single tube (a) was small in size when comparing with the size of the rf coil (a 25 mm resonator); however, the edge of the tube had an enhanced intensity than the center of the tube. Since the outside diameter of the multi-tube phantom (b) was similar to the size of the rf resonator, some inhomogeneity in the peripheral of the image was expected. However, the UTE image of the multi-tubes had much severe non-uniformity in the center part of the tubes. Fig 2 shows the effects of the various post-acquisition reconstruction methods: (a) MSME image (acquired using Cartesian sampling in k space) and (b-e) UTE images from the same data set (acquired using radial sampling in k space). It is clear that the image produced by re-gridding algorithm (c), which re-grids the radial data to a Cartesian grid before a 2D FFT, had better uniformity than the image by the commercial reconstruction (b). Several additional approaches were incorporated into the re-gridding algorithm, including (d) oversampling, which interpolates on to a 512 x 512, twice-fine Cartesian grid from the radial samples, and (e) de-apodization, which applies a filter in the image domain to the oversampling reconstruction. Oversampling is used to eliminate wraparound artifacts that are present in larger images. The use of de-apodization is motivated by typical re-gridding methods. The applications of oversampling and de-apodization (d, e) returned the images that appeared similar to the commercial algorithm (b). Since the amount of the improvement depends upon the individual data sets (i.e., the actual trajectory and data acquired), a min artifact in the UTE images could be achieved by iterations in image analyses.Discussion
Reduction of TE in MRI increases artifacts in the UTE images. In this configuration of the Bruker MRI hardware, the electric current for B0 compensation was added to the shim coils analogically, which is described by 3 exponential functions (each with an amplitude term and a time-constant). This analog B0 compensation is never perfect and can deviate from the actual situation in individual signal acquisition, due to different patterns of eddy currents in different k-space trajectories. These imperfections in the central k-space data can lead to artifacts in the UTE images. The same phantoms have also been imaged using another Bruker micro-imager with a different configuration of the B0 compensation method (Bruker AVANCE IIIHD). The same post-acquisition processing methods yielded improved but different appearances of the images.Conclusion
Different post-acquisition processing methods can point out the sources of the artifacts in UTE images, which are imaging hardware dependent. Iteration in post-processing can reduce the UTE artifacts.Acknowledgements
The authors are grateful to the National Institutes of Health (NIH) for a R01 grant (AR 69047). The authors thank Dr. Dieter Gross and Dr. Thomas Oerther from Bruker (Germany) for their assistance with the UTE sequence and understanding of hardware setup.References
1. J. O'Sullivan, IEEE Trans. Med. Imaging 1985, 4(4):200–207. 2. J. Jackson, C. Meyer, D. Nishimura, A. Macovski, IEEE Trans. Med. Imaging 1991 10(3): 473–478. 3. J.A. Fessler, J Magn Reson. 2007 Oct;188(2): 191-5.
Figures
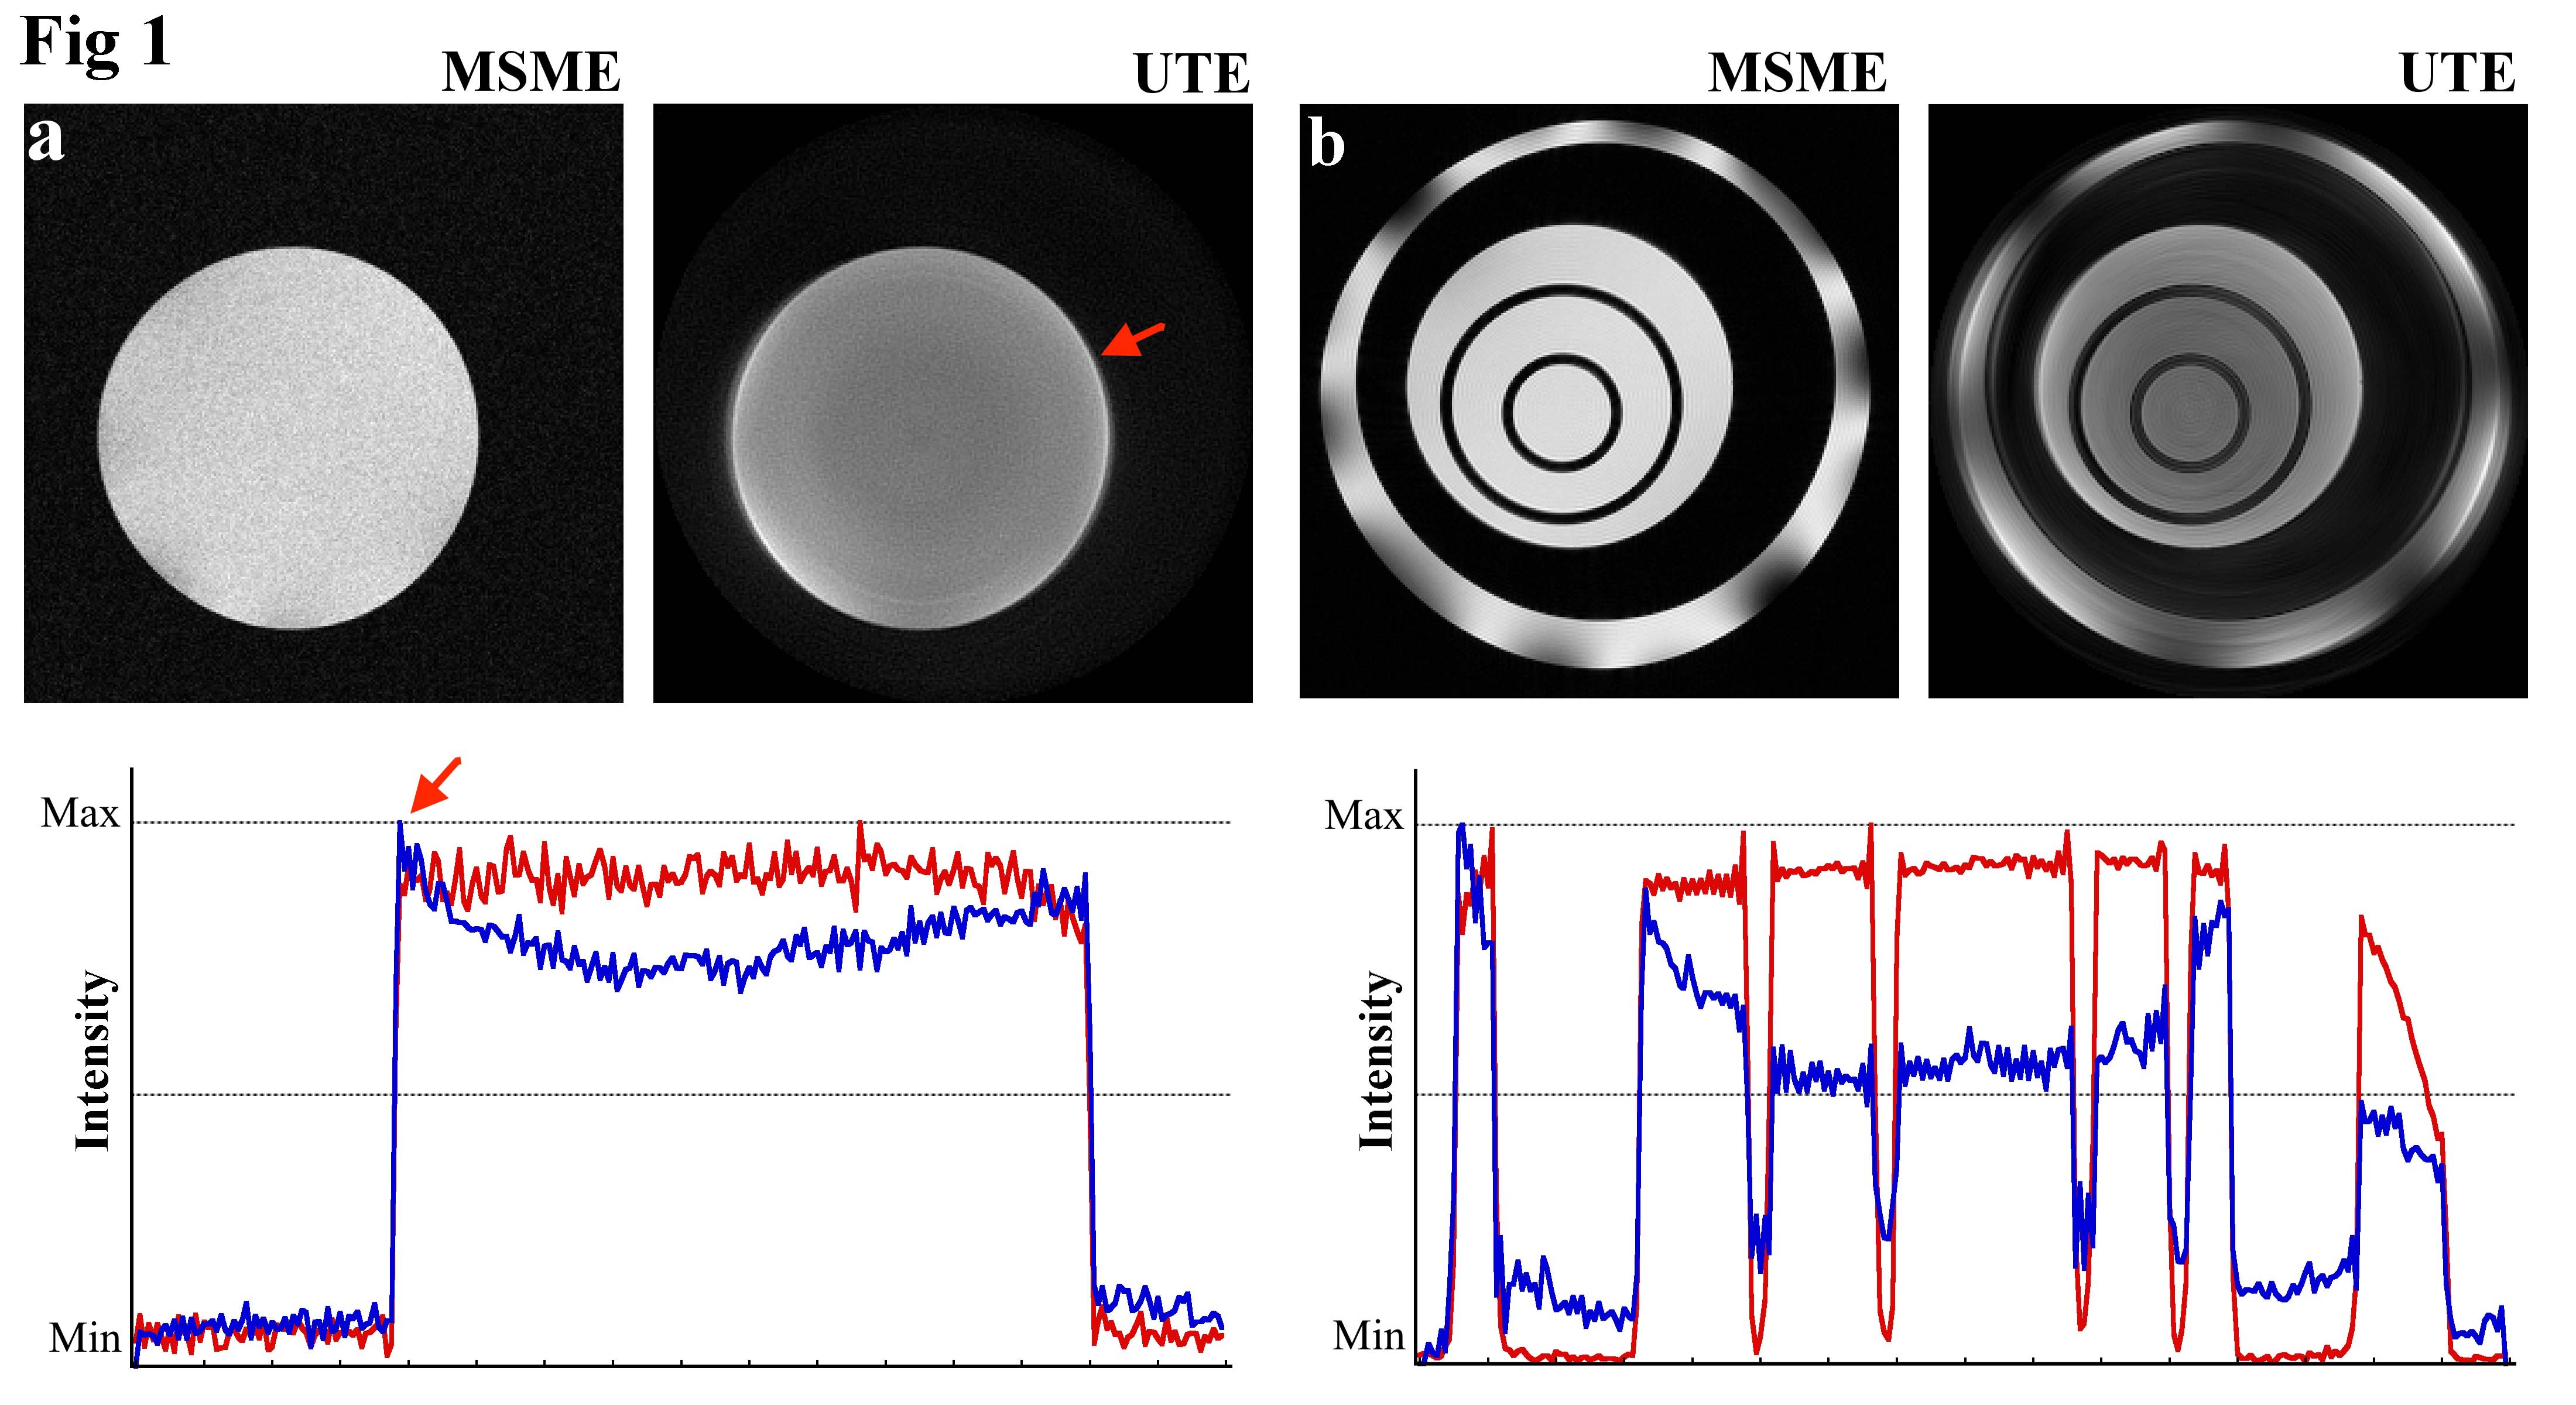
Fig.
1: 2D MSME and UTE intensity maps of (a)
a single tube and (b) a multi-tube phantom with their respective profile plots.
The MSME (red) and UTE (blue) profiles were scaled in amplitudes to show the
differences between the two imaging sequences. The visual variation around the
outermost tube in (b) was caused by the inhomogeneity of the rf coil.
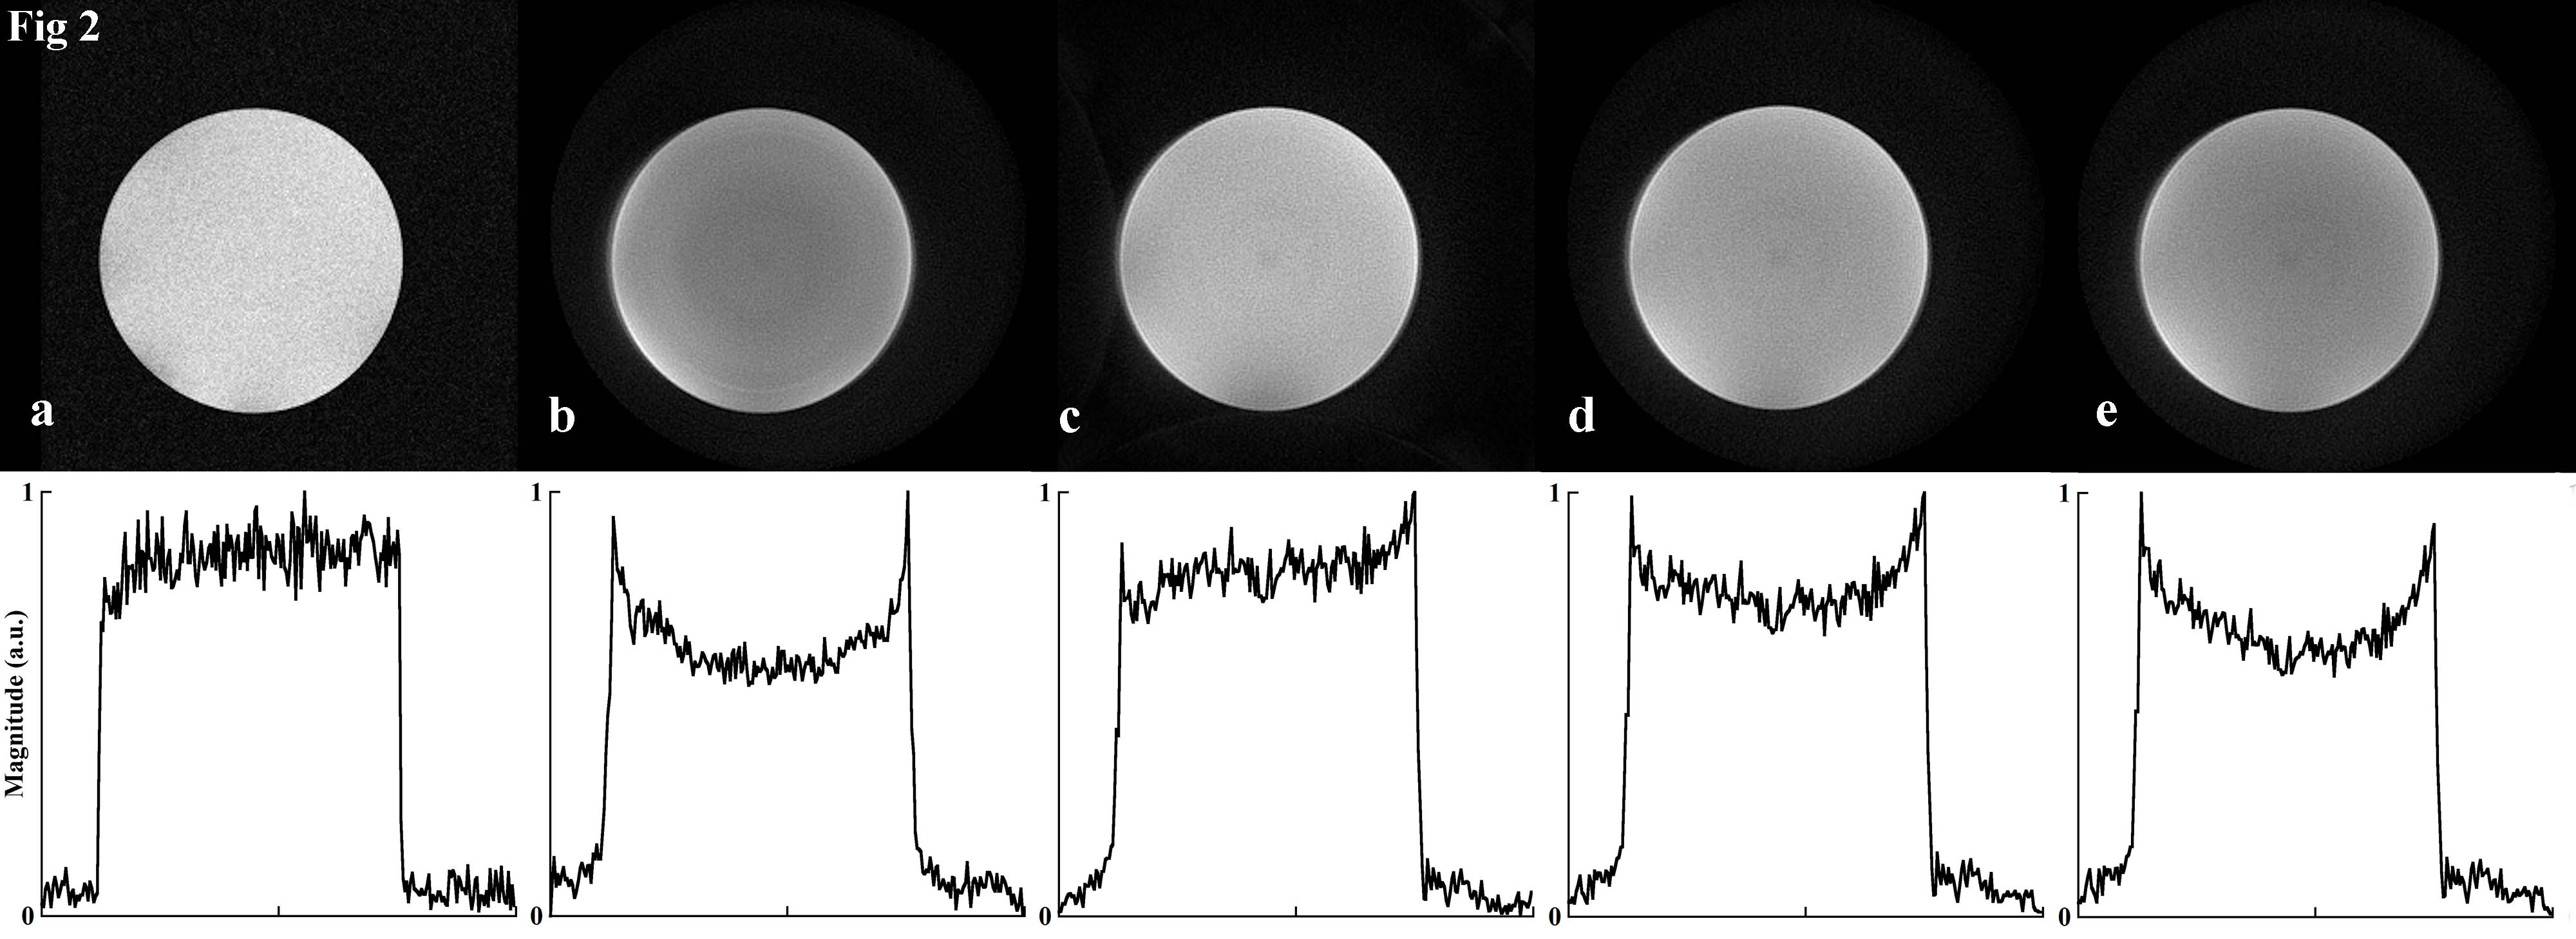
Fig. 2: The intensity images
and profiles of a single tube acquired with (a) MSME sequence and (b) UTE
sequence. (c-e) The images reconstructed from the raw data in (b) but with
different post-acquisition methods.