3670
Color deconvolution and optical density of Multiple Sclerosis lesions1Weill Cornell Medicine, New York, NY, United States, 2Bronx High School of Science, Bronx, NY, United States
Synopsis
Multiple sclerosis (MS) is a chronic inflammatory disease of the central nervous system characterized by focal inflammatory demyelination. In chronic active lesions, microglia and macrophages may contain high amounts of iron and express markers of pro-inflammatory polarization, driving tissue damage and disease progression. Therefore, studying the mechanisms behind iron accumulation and microglial inflammation are of great clinical importance, but require rigorous histological characterization of autopsied brain tissue from MS patients. We developed a rapid, automated method to quantify histopathological markers in human tissue and then validated our findings with manual counting and quantitative susceptibility mapping (QSM).
Introduction
Inflammatory demyelinating lesions are a pathological hallmark of relapsing remitting MS. These chronic active lesions contain a demyelinated, gliotic lesion center, and activated microglia and macrophages at the lesion edge. A subset of chronic active lesions contain iron-positive myeloid cells at the lesion rim, visible by the MRI technique quantitative susceptibility mapping (QSM)1,2. Such iron-positive pro-inflammatory lesions have been shown to slowly expand, contributing to tissue damage and facilitating disease progression3. Therefore, mechanistic studies on iron accumulation within microglia/macrophages require histopathological examination, but histology is typically thought to be semi-quantitative. We developed a method to quantify histopathological stains and markers, to permit rapid automated quantitation of human MS lesions.Methods
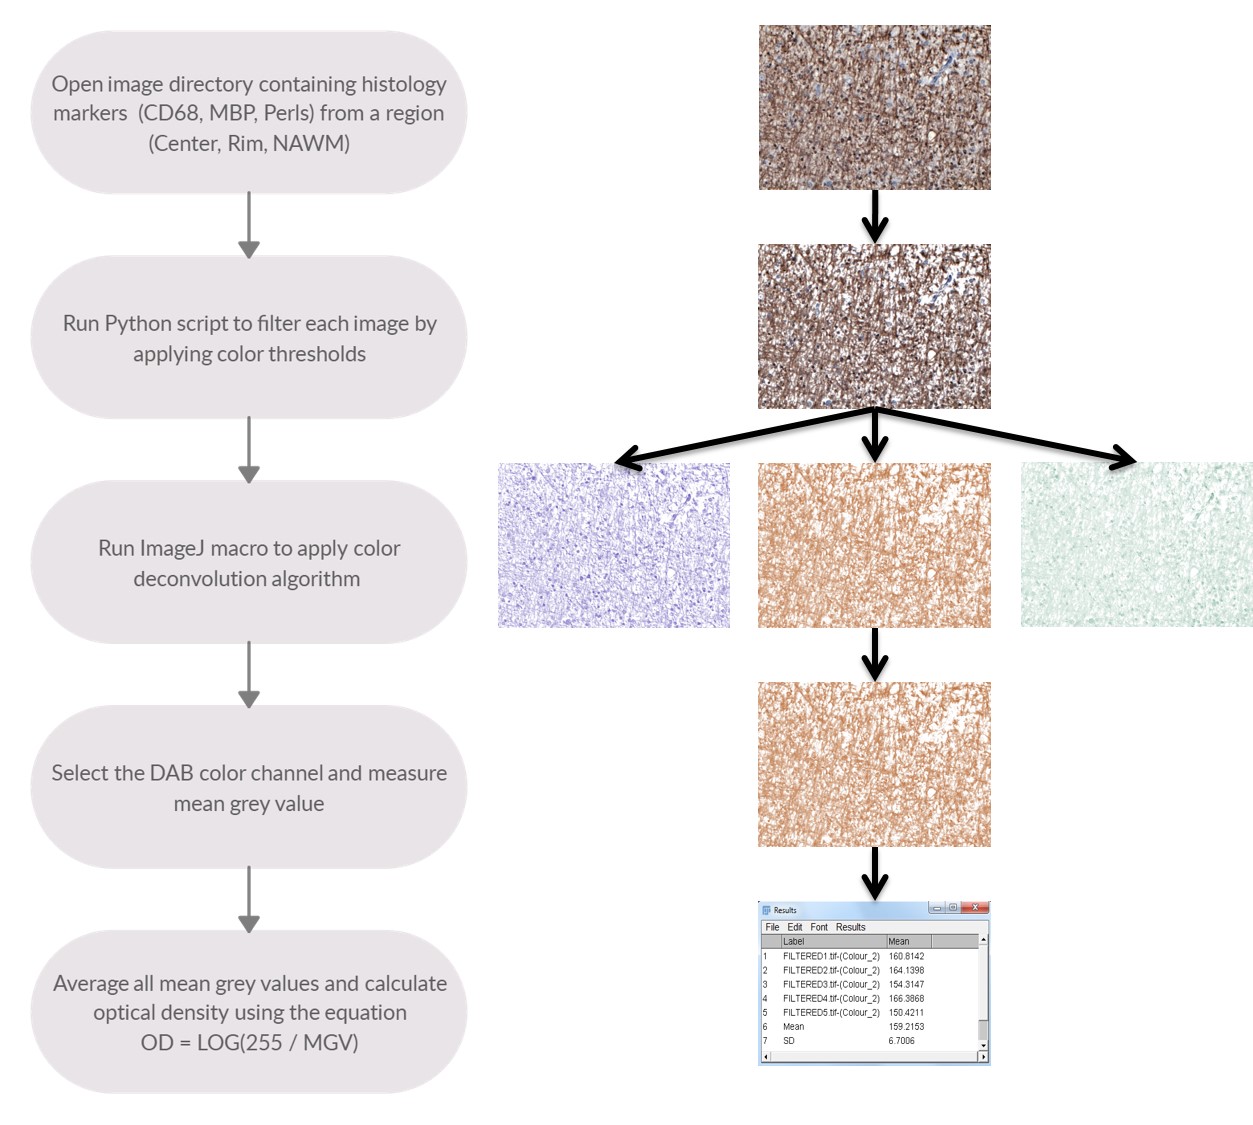
Brains slabs from patients with MS were obtained from the Rocky Mountain MS Center (RMMSC, Colorado, USA) and scanned on a GE MR750 3T MRI scanner. After scanning, lesions were processed for histology and stained with DAB-enhanced Perls’ Prussian Blue (iron) and antibody labeling against: myelin basic protein (MBP; myelin) and CD68 (macrophages and microglia). Slides were scanned with a Mirax brightfield digital scanner. Case Viewer histology viewer was used to take images from each white matter lesion. As seen in Figure 1, 5 images of 40x magnification were taken from each region of interest (Center, Rim, Normal appearing white matter (NAWM)) for every marker (CD68, MBP, Perls’). Sample analysis was done in the FIJI distribution of the ImageJ software. Numpy and OpenCV2 modules in the Python language were used to apply color filtering to image samples obtained from Case Viewer application. Python generated output images were then inputted into FIJI (ImageJ) to apply the color deconvolution algorithm. Three separate color channels (Hematoxylin, DAB, Complementary) were generated from a single histology image. Using an ImageJ macro, the mean grey value of all images from the same lesion, stain, and region was calculated using a built-in ImageJ function. These values were averaged and used to calculate the optical density (OD).Results
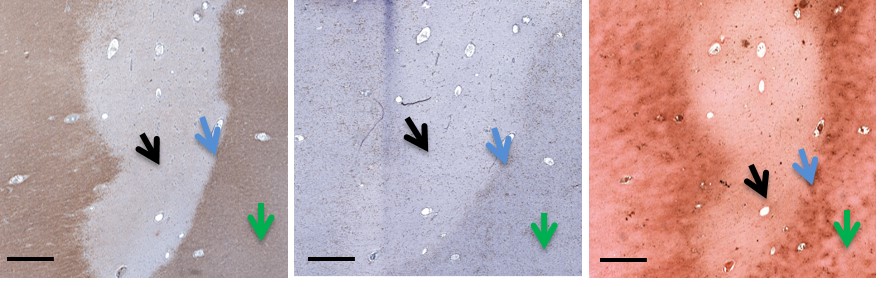
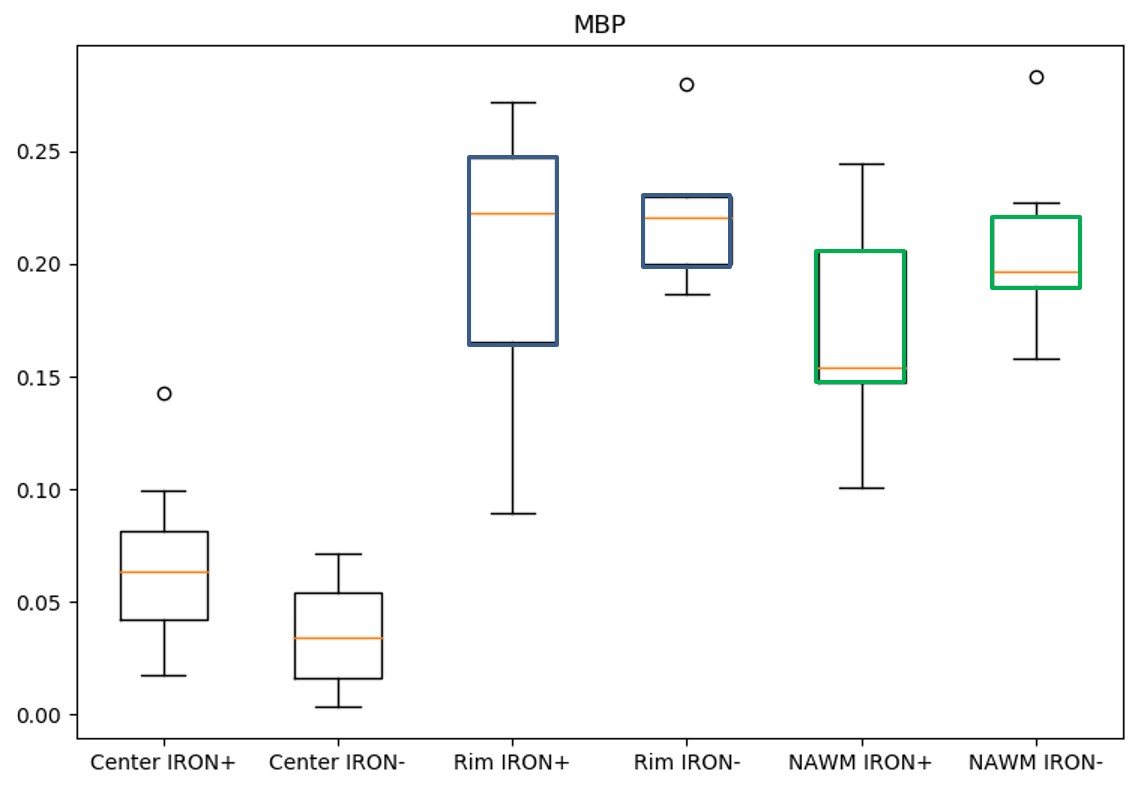
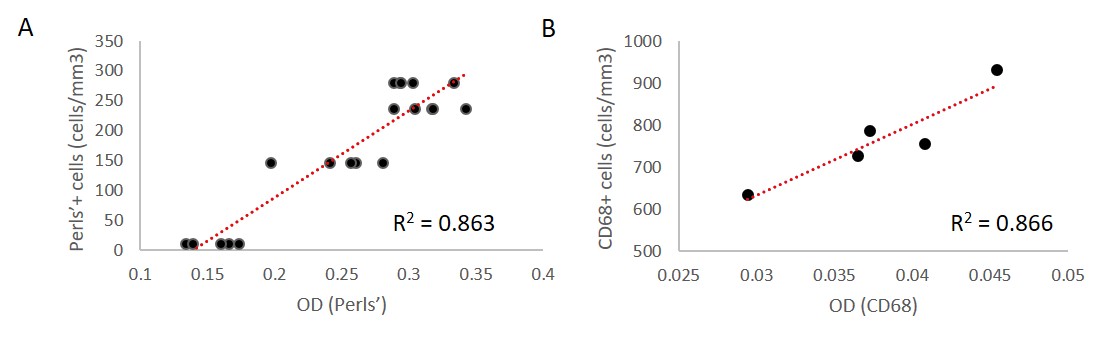
The proposed method (Figure 1) successfully deconvolved histology images (Figure 2) from white matter MS lesions. In iron positive lesion rims for CD68 and Perls stains, there was a strong linear correlation between the optical density values and their corresponding cell densities that were previously counted. In figure 3, the generated boxplot of quantification of myelin binding protein (MBP) by the optical density method verifies that the values between iron positive and negative lesions are similar. This validates the method for the quantification of MBP, which also uses diaminobenzidine (DAB) as a histological marker. Since the method can accurately quantify protein with the DAB stain, then it is logical to assume that it can quantify other antibody stains that also use DAB. In Figure 4A, the points represent individual optical density values for histology samples taken from the lesion rim. In figure 3B, the points represent an average of optical density values from a specific lesion rim. From figure 4, the amount of iron reflected by the optical density values is split up into six box plots depending on the region and the presence of iron in the lesion.Discussion
There is a strong linear relationship between the optical densities and cell densities of Perls’ positive and CD68 positive cells. MBP OD served as an internal control, as there were no differences between iron positive and negative lesions. This novel optical density measurement method is a valuable tool for rapid automated quantification of antibody staining, a technical challenge especially when DAB is used as the chromogen. DAB does not follow the Beer-Lambert law, a theory that suggests a linear relationship between concentration and intensity. In fact, DAB scatters light waves rather than reflecting, making it difficult to accurately quantify DAB using a measurement of intensity (namely, an image). To improve on our findings, additional research has to be done to find the correct color channel vectors for the color deconvolution algorithm as well as the correct standard deviation weights during image filtering in Python. These optimizations will permit our new method to be used for a wide range of antibodies in other organ systems and disease states. Further studies on algorithm refinement and optimization could include attributing a maximum standard deviation away from the true mean of RGB values for that specific stain marker, instead of iterating through every single pixel in the image. If the standard deviation of the pixel (z-score) is not within range of 2 – 4 standard deviations away from the mean, then it should be filtered out. This would dramatically increase the efficiency of the algorithm and would no longer require manual filtering through the process of running Python code.Conclusion
The method provides a tool to rapidly quantify histology stains not only for MS, but for any medical condition characterized by a loss or gain in specific compounds.Acknowledgements
No acknowledgement found.References
1. Eskreis-Winkler S, Zhang Y, Zhang J, et al. The clinical utility of QSM: disease diagnosis, medical management, and surgical planning. NMR Biomed 2017;30(4).
2. Mehta V, Pei W, Yang G, et al. Iron is a sensitive biomarker for inflammation in multiple sclerosis lesions. PLoS One 2013;8(3):e57573.
3. Dal-Bianco A, Grabner G, Kronnerwetter C, et al. Slow expansion of multiple sclerosis iron rim lesions: pathology and 7 T magnetic resonance imaging. Acta Neuropathol 2017;133(1):25-42.
Figures