3668
MRI-based Body Composition Analysis – Reproducibility and Repeatability1Department of Biomedical Engineering and Center for Medical Image Science and Visualization (CMIV), Linköping University, Linkoping, Sweden, 2AMRA Medical, Linköping, Sweden, 3Department of Medicine and Health and Center for Medical Image Science and Visualization (CMIV), Linköping University, Linköping, Sweden
Synopsis
This study investigated between-scanner reproducibility and repeatability of a method for MRI-based body composition analysis. Eighteen healthy volunteers were scanned twice on five different MR scanners from three vendors including both 1.5 and 3T, using a 2-point Dixon neck-to-knee imaging protocol. Visceral adipose tissue, abdominal subcutaneous adipose tissue, thigh muscle volume, muscle fat infiltration and liver fat were quantified using AMRA® Researcher. The reproducibility coefficients for the volume measurements ranged from 7 cl (anterior thigh muscles) to 4.2 dl (abdominal subcutaneous adipose tissue). The reproducibility coefficient for muscle fat infiltration was 1.5 percentage points and for liver fat 2.4 pp.
Introduction
Since the early 1990s, a number of methods for more or less automated methods for MRI-based body composition analysis have been published, see e.g. the review articles by Hu et al. and Borga 1,2 Several of these publications have addressed accuracy of the segmentations and test-retest repeatability. However, there is an almost complete absence of studies investigating the reproducibility of MRI-based body composition analysis 2. Therefore, the aim of this study was to investigate the between-scanner reproducibility and the repeatability of such a method.Methods
MR images were acquired at a scanning facility with five different MRI scanners available at walking distance, using a multi-scanner test-retest setup. Eighteen healthy volunteers were included (13 male, 5 female, aged 24 to 51 years). The study was approved by the regional ethical review board. Written informed consent was obtained from all participants prior to study.Five MRI scanners; GE Optima MR450W GEM 1.5 T, GE Discovery MR750 3 T, Philips Achieva 1.5 T, Philips Ingenia 3 T, and Siemens Prisma 3 T, were included and similar MRI protocols were used for all systems. Each participant was scanned twice on all MRI scanner systems during the same day and exited and reentered the scanner room in between subsequent test-retest scans.
On all systems, the MRI protocol was based on 2-point water-fat separated Dixon imaging with scan coverage of neck to knee and adjacent slab overlap of 2-4 cm with two additional Multi-Echo GRE sequence slabs covering the liver. Images were T1-weighted with flip angle of 10 degrees and repetition time set to shortest allowed for each scanner. Fat, water, in-phase, and opposite-phase images were acquired using the on-scanner software for all acquisitions. Manufacturers' standard auxiliary torso coils were used for liver slab acquisitions. In all analyses, the researchers were blinded for MRI scanner system and the systems were therefor labeled as "Scanner 1-5" in random order.
Body composition analysis was performed for all in-vivo acquisitions to measure visceral adipose tissue (VAT), abdominal subcutaneous adipose tissue (ASAT), thigh muscle volume (left/right, anterior/posterior, and total), muscle fat infiltration in the thigh muscle (left/right, anterior/posterior, and average anterior), and liver fat. The analysis method comprised fully automated image calibration and fat quantification in combination with semi-automated 3-dimensional segmentation of body compartments 3-5.
Measurements were calculated using the cloud-based service AMRA® Researcher (AMRA Medical AB, Linköping, Sweden) with an additional eddy-current correction to compensate for left/right asymmetries in the acquisitions. The fat-referenced liver fat measurements were corrected for T2*, estimated from the Multi-Echo GRE sequence, and subsequently rescaled to proton density fat fraction (PDFF) 6. In addition, the vendors' 6-point Dixon PDFF acquisitions were applied.
Repeatability was calculated using analysis of variance controlling for MRI scanner system, so that all test-retest acquisitions were included from all MRI scanner systems. Reproducibility was calculated using analysis of variance. To assess the differences (bias) between the MRI systems, the difference in measurement values between all pairs of scanners were calculated, for all subjects. By averaging across all subjects and combinations of scanners, and shifting to a common zero, the average differences between MRI systems were obtained on an interval scale.
Results
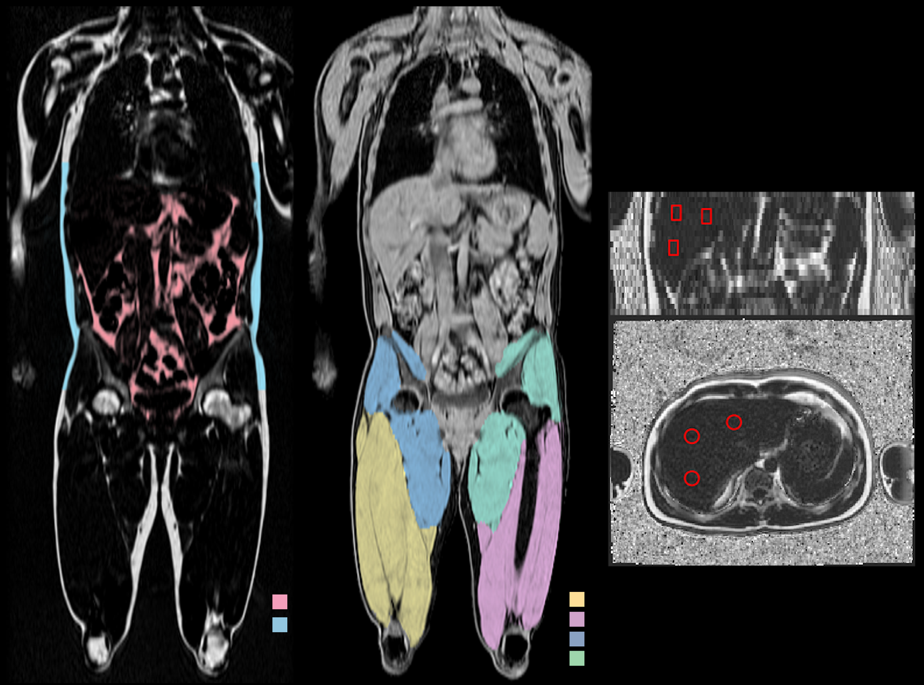
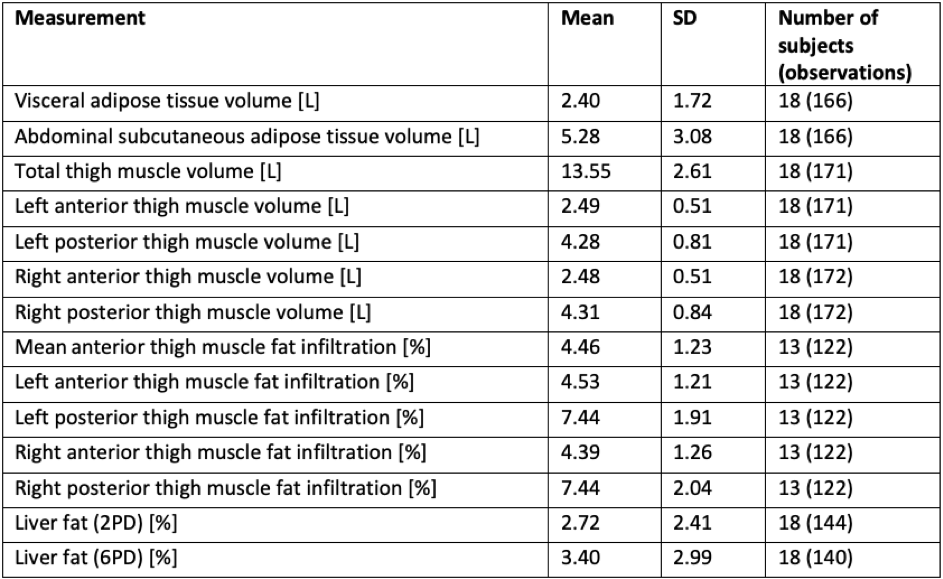
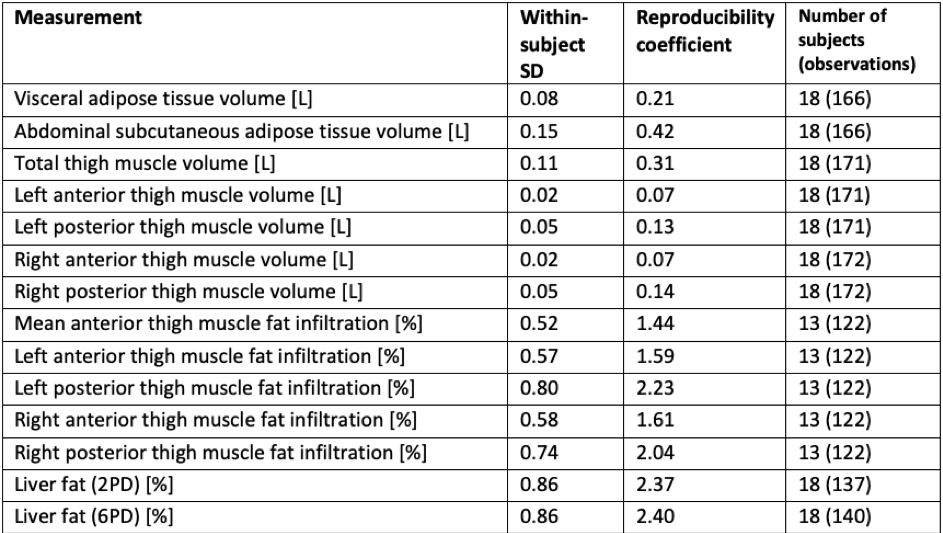
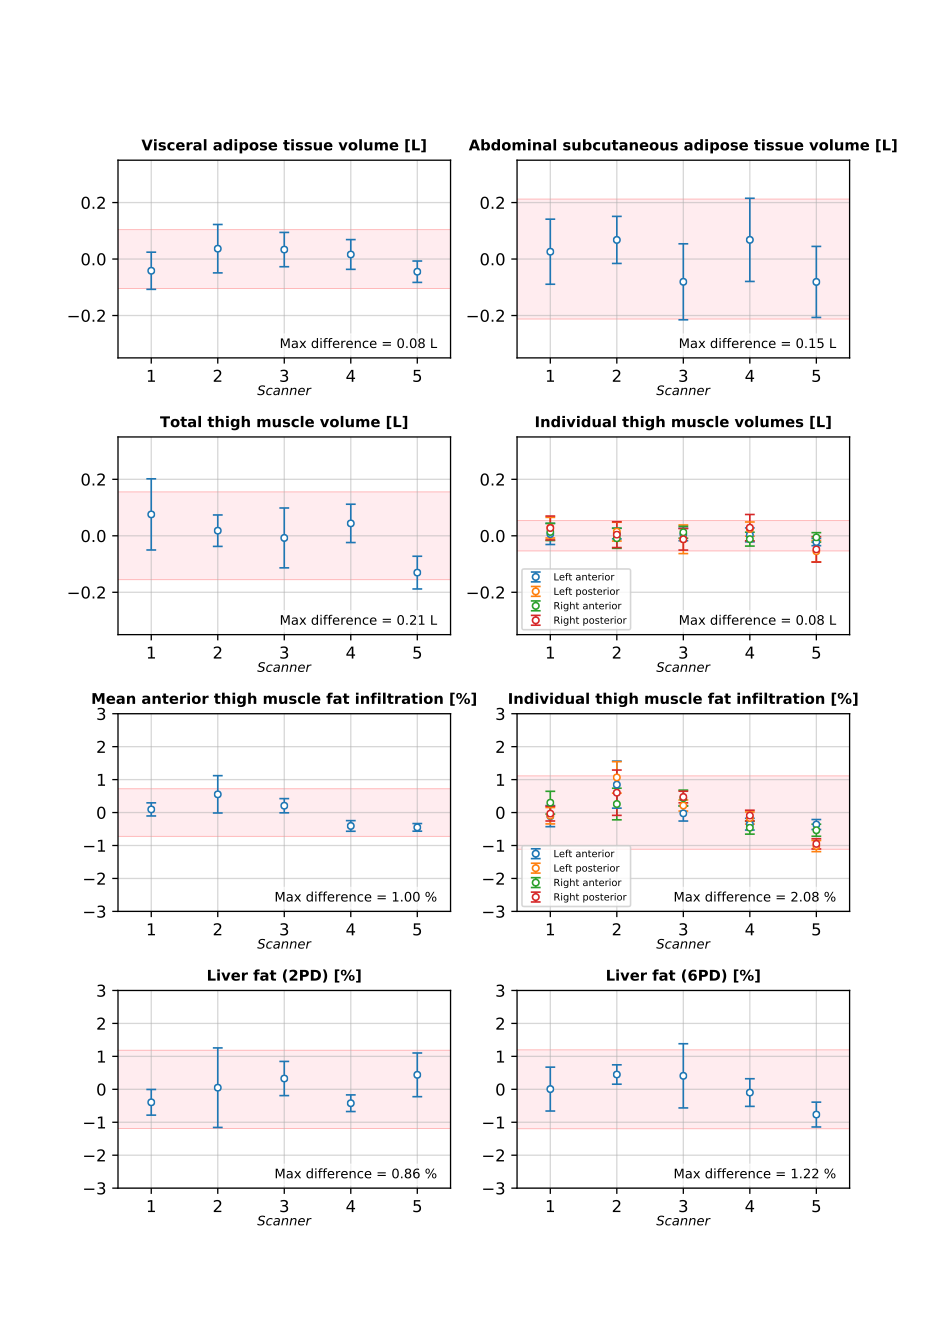
An example of the segmentation of adipose tissue and thigh muscles, and positioning of liver ROIs is shown in figure 1. Descriptive statistics for the study cohort are presented in figure 2. The within-scanner repeatability and the reproducibility using different scanners for each measurement variable are reported in figures 3 and 4 respectively. The reproducibility coefficients for the volume measurements ranged from 7 cl (left and right anterior thigh muscles) to 4.2 dl (abdominal subcutaneous adipose tissue). The reproducibility coefficient for muscle fat infiltration was 1.5 percentage points (pp) and for liver fat 2.4 pp. The repeatability and reproducibility are also illustrated graphically in figure 5, together with the relative differences (biases) between the scanners.Discussion
Repeatability and reproducibility are both important, but for different reasons and in different contexts. In a longitudinal study, where the patient is scanned multiple times in the same scanner, and where the primary variable is the difference between time points, the repeatability is more important than the reproducibility. In clinical diagnosis and as inclusion critera in multi-center clinical studies, however, the reproducibility is often a primary quality parameter. Whether the precision found here is sufficient depends on the specific clinical application. Unfortunately, we have not found any other studies reporting reproducibility of similar methods for volumetric measures of muscle and adipose tissue and to which these results could be compared to.Conclusion
We have presented what, to the best of our knowledge, is the first reproducibility study of an MRI-based body composition analysis method. The results from this study can be used for power calculations when using this analysis service in clinical studies or to better understand the scanner-induced variability in clinical applications. They can also be used as a bench mark for future reproducibility studies of other methods for body composition analysis.Acknowledgements
No acknowledgement found.References
1. Hu, H., J. Chen, and W. Shen, Segmentation and quantification of adipose tissue by magnetic resonance imaging. MAGMA: Magnetic Resonance Materials in Physics, Biology & Medicine, 2016. 29(2): p. 259.
2. Borga, M., MRI adipose tissue and muscle composition analysis—a review of automation techniques.The British Journal of Radiology, 2018. 91(1089): p. 20180252.
3. Leinhard, O.D., et al., Quantitative abdominal fat estimation using MRI, in 19th International Conference on Pattern Recognition, Vols 1-6. 2008. p. 2137-2140.
4. Karlsson, A., et al., Automatic and quantitative assessment of regional muscle volume by multi-atlas segmentation using whole-body water-fat MRI. Journal of Magnetic Resonance Imaging, 2015. 41(6): p. 1558-1569.
5. Borga, M., et al., Advanced body composition assessment: from body mass index to body composition profiling. Journal of Investigative Medicine, 2018. 66: p. 887-895.
6. West, J., et al., Precision of MRI-based body composition measurements of postmenopausal women.PLOS ONE, 2018. 13(2): p. e0192495.
Figures