3666
Evaluation of a standardized quantitative method of brain Iron based on quantitative susceptibility mapping and Brainnetome Atlas1Department of Radiology, Guizhou Provincial People's Hospital, Guiyang, China, 2GE Healthcare, MR Research, Beijing, China
Synopsis
Delineating the region of interest manually to obtain the magnetic susceptibility values from quantitative susceptibility mapping (QSM) for diagnosis of neurological diseases is a common method. However, this approach is time-consuming and may be inaccurate due to human error. Here we introduced a standardized brain region susceptibility quantification procedure based on QSM and Brainnetome Atlas. Our results show that this method has high accuracy in measuring brain iron content. Based on this method, we found that the content of brain iron tends to increase with age. Additionally, magnetic susceptibility values of partial brain regions have sex differences should be noted.
Introduction
Iron is an indispensable trace element in the human body, and too high or too low of iron concentration in the brain can cause neurodegenerative diseases such as Alzheimer's disease (AD), Parkinson's disease (PD), and Amyotrophic lateral sclerosis (ALS)1-3. Thus early detection of the changes of brain iron concentration may have important clinical significance for early diagnosis of these neurological diseases with abnormal iron metabolism. A number of studies have reported a strong correlation between brain iron concentration and the magnetic susceptibility in vivo4. Based on gradient echo (GRE) magnetic resonance phase data, quantitative susceptibility mapping (QSM) is a novel technique which allows non-invasive assessment of magnetic tissue susceptibility distribution in neurodegenerative disorder. In current clinical routine, delineating the region of interest (ROI) manually to obtain the magnetic susceptibility value is a common method5. However, this approach is time-consuming and may be inaccurate due to human error. Here we introduced a standardized brain region susceptibility quantification procedure based on the quantitative magnetic susceptibility imaging (QSM) and the Brainnetome Atlas brain network group map, and tested its feasibility.Methods
This study was approved by the institutional review board, and written informed consent was obtained from all patients. Forty-three healthy subjects (age range: 20-60 years; mean age: 61 years; 20 male and 23 female) participated in this study. All data were obtained on a 3.0T MR scanner (Discovery MR 750, GE Healthcare, Milwaukee, WI) equipped with a 32-channel phased-array coil. All participants underwent a 3D T1-weighted imaging acquisition (TR/TE = 8.5/3.2 ms, TI = 450 ms, FA = 15°, FoV = 256×256 mm, matrix = 256×256, slice thickness = 1 mm, 192 sagittal slice, BW = 31.25 kHz), and a 3D multi-gradient-echo QSM acquisition (TR/TE1 = 41.8/3.3 ms, number of echoes = 16, TE spacing = 2.3 ms, flip angle = 20°, FoV = 256×256 mm, matrix = 256×256, slice thickness = 1 mm, 124 axial slices, BW = 62.50 kHz). The magnetic susceptibility maps were further calculated from the QSM data using AW4.6 GE Workstation (Figure 1A and 1B). Using the SPM12 software package (http://www.fil.ion.ucl.ac.uk/spm/) implemented in MATLAB (MathWorks, Natick, MA, USA), we first registered QSM and susceptibility images of each participant to its own structural image, then normalized to the standard brain (Figure 1C and 1D), and finally smoothed with a 6 mm isotropic gaussian kernel. The ROIs including globus pallidus(GP), putamen(PU), caudate nucleus(CA), hippocampus(HP), thalamus(TH), frontal cortex(FC), parietal cortex(PC) and occipital cortex(OC) extracted were selected based on Brainnetome Atlas brain network atlas6 (Figure 1E). The magnetic susceptibility values were extracted from these standardized ROIs using a custom MATLAB code and from manually drawn ROIs. Pearson correlation analysis was performed between the pathological iron concentration reported by a previous study7, and magnetic susceptibility values measured by two ROI selection methods. The correlation analysis between the magnetic susceptibility value and age was performed by Spearman test. Histograms of magnetic susceptibility distribution measured by two ROI selection methods were drawn (Figure 2), and the differences of magnetic susceptibility values between different genders and hemispheres were analyzed by non-parametric Mann-Whitney U test.Results
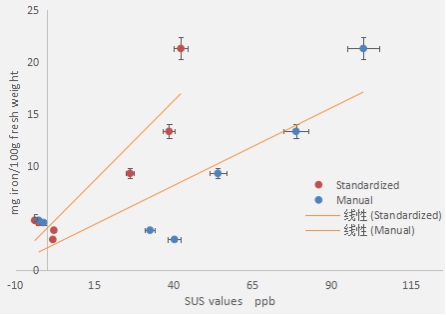
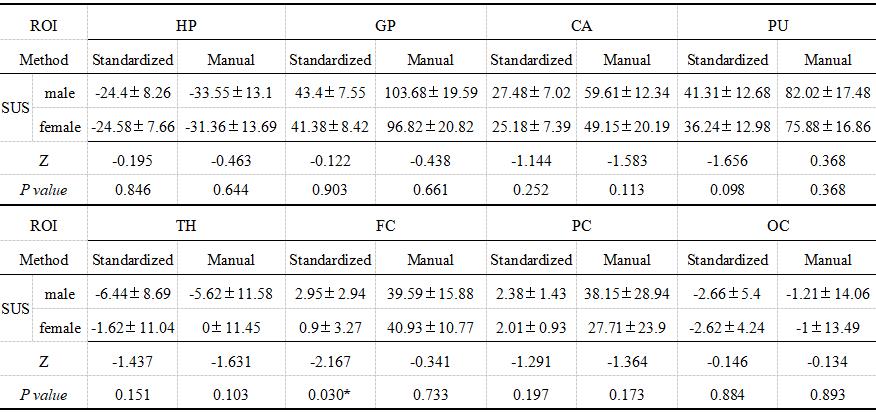
We found that the highest measurement of brain magnetic susceptibility values from standardized ROIs and manually drawn ROIs magnetic were globus pallidus, and then the putamen, while the lowest was hippocampus (Figure 2). The brain magnetic susceptibility values measured by two ROI selection methods were highly consistent with autopsy results, and the former (r = 0.920, P < 0.05) is greater than the latter (r = 0.856, P < 0.05)(Table 1 and Figure 3). Magnetic susceptibility values measured from both methods were positively correlated with age (Figure 4). Significant differences between genders were observed in the magnetic susceptibility values measured from standardized ROIs at frontal cortex (P < 0.05)(Table 2). No differences between left and right hemispheres were observed in the magnetic susceptibility values measured from standardized and manual ROIs (P > 0.05).Conclusion
Our results show that the standardized quantitative method based on QSM imaging and Brainnetome Atlas brain network atlas has high accuracy in measuring brain iron content. Based on this method, we found that the content of brain iron tends to increase with age. In addition, the magnetic susceptibility values of partial brain regions have sex differences should be noted.Acknowledgements
The study is supported by the National Natural Science Foundation of China (No. 81960314), the Science and Technology Foundation of Guizhou Province (QKHZC[2019]2810), (QKHJC[2016]1096), (QKHPTRC[2019]5803), and (QKHPTRC[2017]5724), the Guizhou Provincial People’s Hospital Doctoral Foundation (GZSYBS[2015]02), and the Guizhou Science and Technology Department Key lab. Project (QKF[2017]25).References
1. Kim HG, Park S, Rhee HY, et al. Quantitative susceptibility mapping to evaluate the early stage of Alzheimer's disease. Neuroimage Clin. 2017;16:429-438.
2. An H, Zeng X, Niu T, et al. Quantifying iron deposition within the substantia nigra of Parkinson's disease by quantitative susceptibility mapping. J Neurol Sci. 2018;386:46-52.
3. Acosta-Cabronero J, Machts J, Schreiber SA, et al. Quantitative susceptibility MRI to detect brain Iron in amyotrophic lateral sclerosis. Radiology. 2018;289(1):195-203.
4. Langkammer C, Schweser F, Krebs N, et al. Quantitative susceptibility mapping (QSM) as a means to measure brain iron? A post mortem validation study. Neuroimage. 2012; 62(3):1593-1599.
5. Wang Y, Liu T. Quantitative susceptibility mapping (QSM): Decoding MRI data for a tissue magnetic biomarker. Magn Reson Med. 2015;73(1):82-101.
6. Fan L, Li H, Zhuo J, et al. The Human Brainnetome Atlas: A New Brain Atlas Based on Connectional Architecture. Cereb Cortex. 2016;26(8):3508-3526.
7. Hallgren B, Sourander P. The effect of age on the non-haemin iron in the human brain. J Neurochem. 1958;3(1):41-51.
Figures

Figure 1. MR-QSM images were registered, smoothed and corresponded to the standard brain by MATLAB software.
B refers to the QSM image obtained by processing the original data(A), and it can be seen that the globus pallidus(red), putamen(yellow) and caudate nucleus(blue) are obtained by manual drawing. Using the MATLAB software, we first registered QSM and susceptibility images of each participant to its own structural image, then normalized to the standard brain, and finally smoothed (C and D). E represents the position of each ROI on the Brainnetome Atlas brain network map.