3664
Synthetic T2-weighted contrasts of the lumbar spine derived from fast quantitative mapping – the icing on the cake1High Field MR Centre, Department of Biomedical Imaging and Image-guided Therapy, Medical University of Vienna, Vienna, Austria, 2Department of Orthopedics and Trauma Srugery, Medical University of Vienna, Vienna, Austria, 3Advanced Clinical Imaging Technology, Siemens Healthcare, Lausanne, Switzerland, 4Department of Radiology, Lausanne University Hospital and University of Lausanne, Lausanne, Switzerland, 5LTS5, Ecole Polytechnique Fédérale de Lausanne (EPFL), Lausanne, Switzerland, 6Department of Radiology, University Hospital and University of Lausanne, Lausanne, Switzerland, 7Department of Biomedical Imaging and Image-guided Therapy, Medical University of Vienna, Vienna, Austria
Synopsis
GRAPPATINI has already been shown to allow short acquisition times with diagnostic synthetic T2-weighted (T2w) images in the knee. This study investigates how different effective echo times influence the resulting contrast-to-noise ratio of GRAPPATINI compared to a conventional T2w turbo spin-echo (TSE) sequence in the spine. Overall, the synthetic T2w images maintained diagnostic quality while being reconstructed from highly-undersampled k-space data in 2:27 min acquisition time vs. 2:01 min for the T2w TSE with the advantage of GRAPPATINI to also offer multiple synthetic contrasts alongside robust T2 mapping.
Introduction
In young healthy subjects, the intervertebral discs passively store a large amount of water in the nucleus pulposus (NP) due to glycosaminoglycans, long macromolecules with negatively charged sidechains. On the other hand, the annulus fibrosus of the outer margins of the discs consists of dense fibers with no water stored in a healthy volunteer. Degenerative disc disease is categorized based on the decreasing T2 signal intensities (SI) of the NP1. The posterior annulus fibrosus (PAF) often shows higher signal intensities with ongoing fiber degradation sometimes with clearly demarcated high-intensity zones (HIZ). These hyperintensities are associated with annular tears and more severe low-back pain2. Proton-density-weighted (PDw) and T2-weighted (T2w) sequences are of specific interest in musculoskeletal MRI as they are sensitive to water content in cartilaginous tissue. T2 mapping is a promising additional imaging technique since it offers quantitative information that is correlated to the water and collagen fiber content as well as the organisation of cartilage3,4.GRAPPATINI, a combination of “Model-based Accelerated Relaxometry by Iterative Non-linear Inversion” (MARTINI)5 and “Generalized autocalibrating partially parallel acquisitions” (GRAPPA)6, is a fast T2 mapping prototype sequence which already yielded good results in musculoskeletal applications in clinically feasible acquisition times7–10. As an additional major advantage, GRAPPATINI allows to generate synthetic T2w contrast images at any given effective echo time (effTE) directly inline on the scanner, which enables one sequence to offer multiple morphological contrasts alongside a quantitative T2 map. In this preliminary analysis, we investigated synthetic morphological images derived from GRAPPATINI in the spine of 58 individuals and compared them to a conventional turbo spin echo sequence (TSE).
Methods and Materials
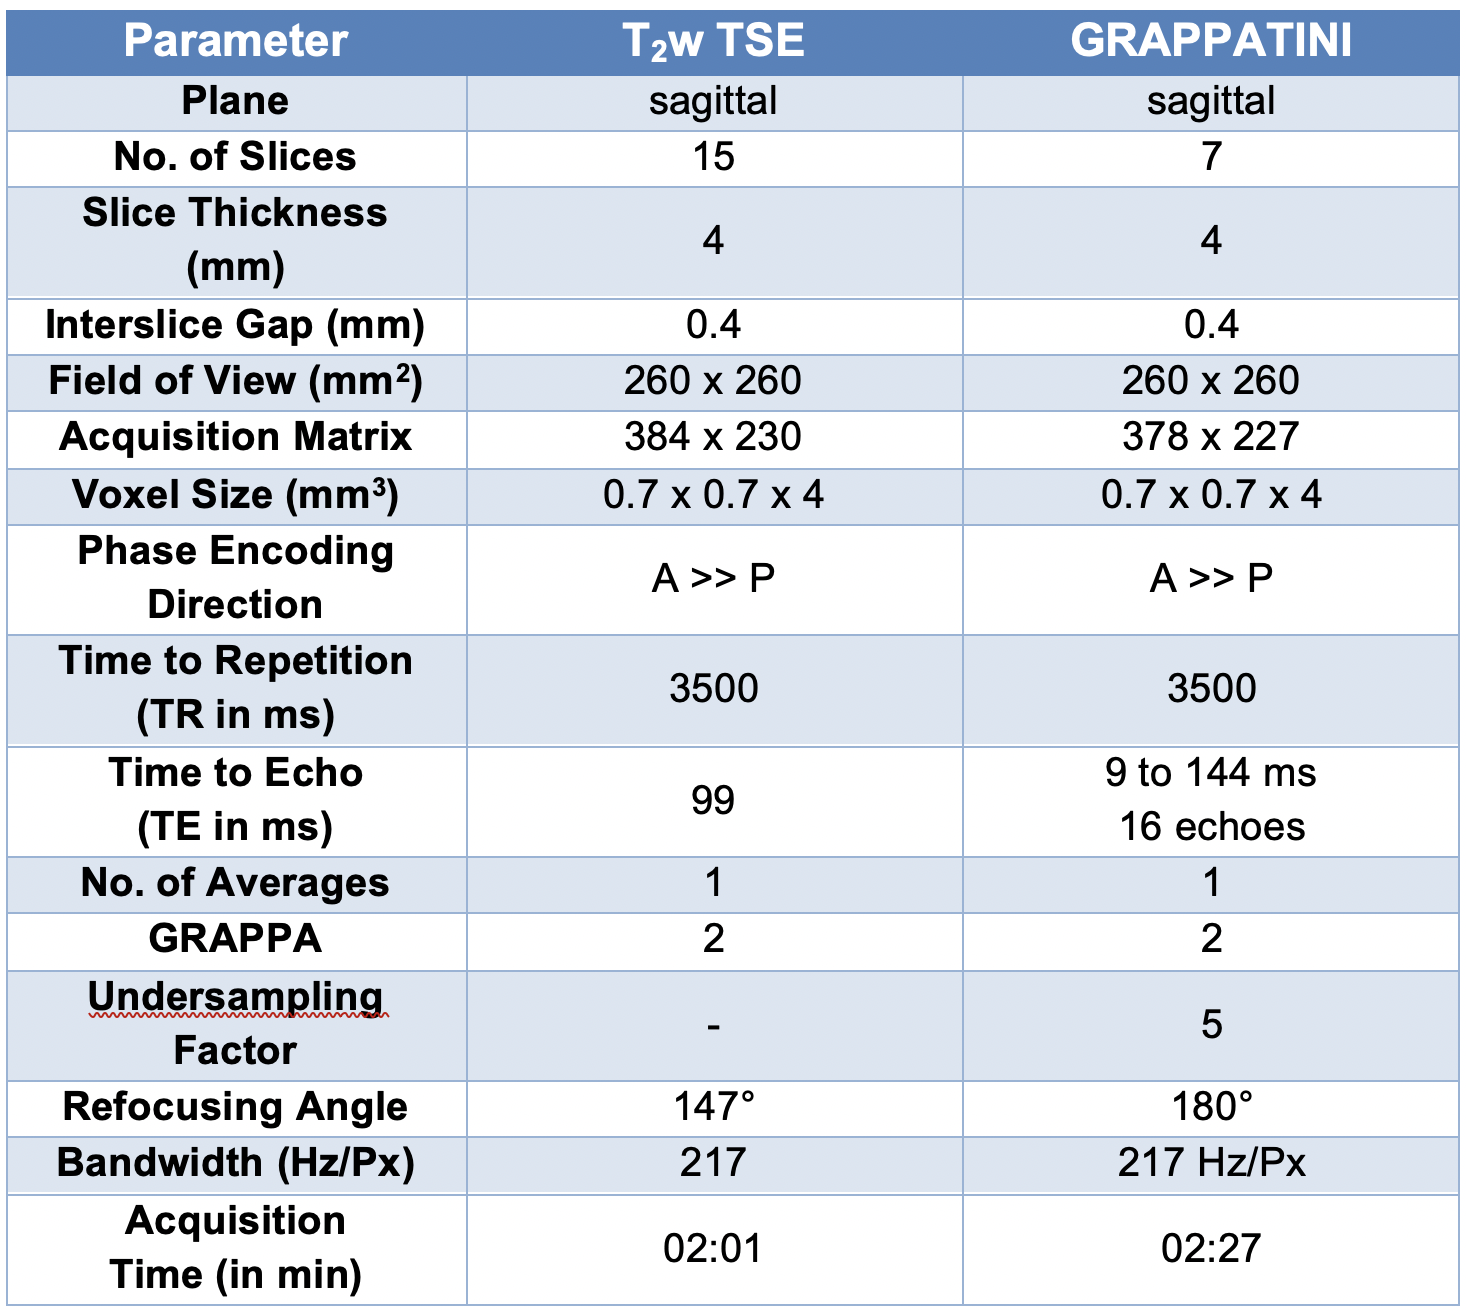
After written and informed consent was obtained, 58 individuals (25 female, mean age 23.3±8.0 years) were examined at 3T (MAGNETOM Prismafit, Siemens Healthcare, Erlangen, Germany) using a 32-channel spine coil.The first sequence of the morphological protocol was a T2w TSE (2:01 min) followed by the GRAPPATINI prototype sequence (2:27 min) using parameters comparable to the TSE. All relevant sequence parameters are listed in Table 1. GRAPPATINI was used with an acceleration factor of five and an additional two-fold GRAPPA sampling, effectively resulting in ten-fold undersampled k-space data. As a final step in the inline model-based image reconstruction of GRAPPATINI, a synthetic T2w contrast was generated at effTE 99 ms to match the morphological T2w TSE7. ITK-SNAP was used to manually segment all 58 cases on the four most central sagittal slices of the T2w TSE11. Each disc was segmented with an individual label for NP and the posterior annulus fibrosus (PAF). After rigid co-registering of the respective series, segmentations were copied from the TSE to the synthetic T2w contrast generated by GRAPPATINI. Contrast ratios (CR) were calculated as a noise-independent metric for both the T2w TSE and the synthetic T2w contrast using the respective median signal intensities (SI) as follows: SINP / SIPAF. Additionally, contrast-to-noise ratios (CNR) were calculated using the signal intensities as follows: (SINP –SIPAF) / StandardDeviationNP. Paired t-tests and a Pearson’s correlation coefficient analysis were conducted using SPSS version 25 for macOS (IBM, NY, USA).
Results
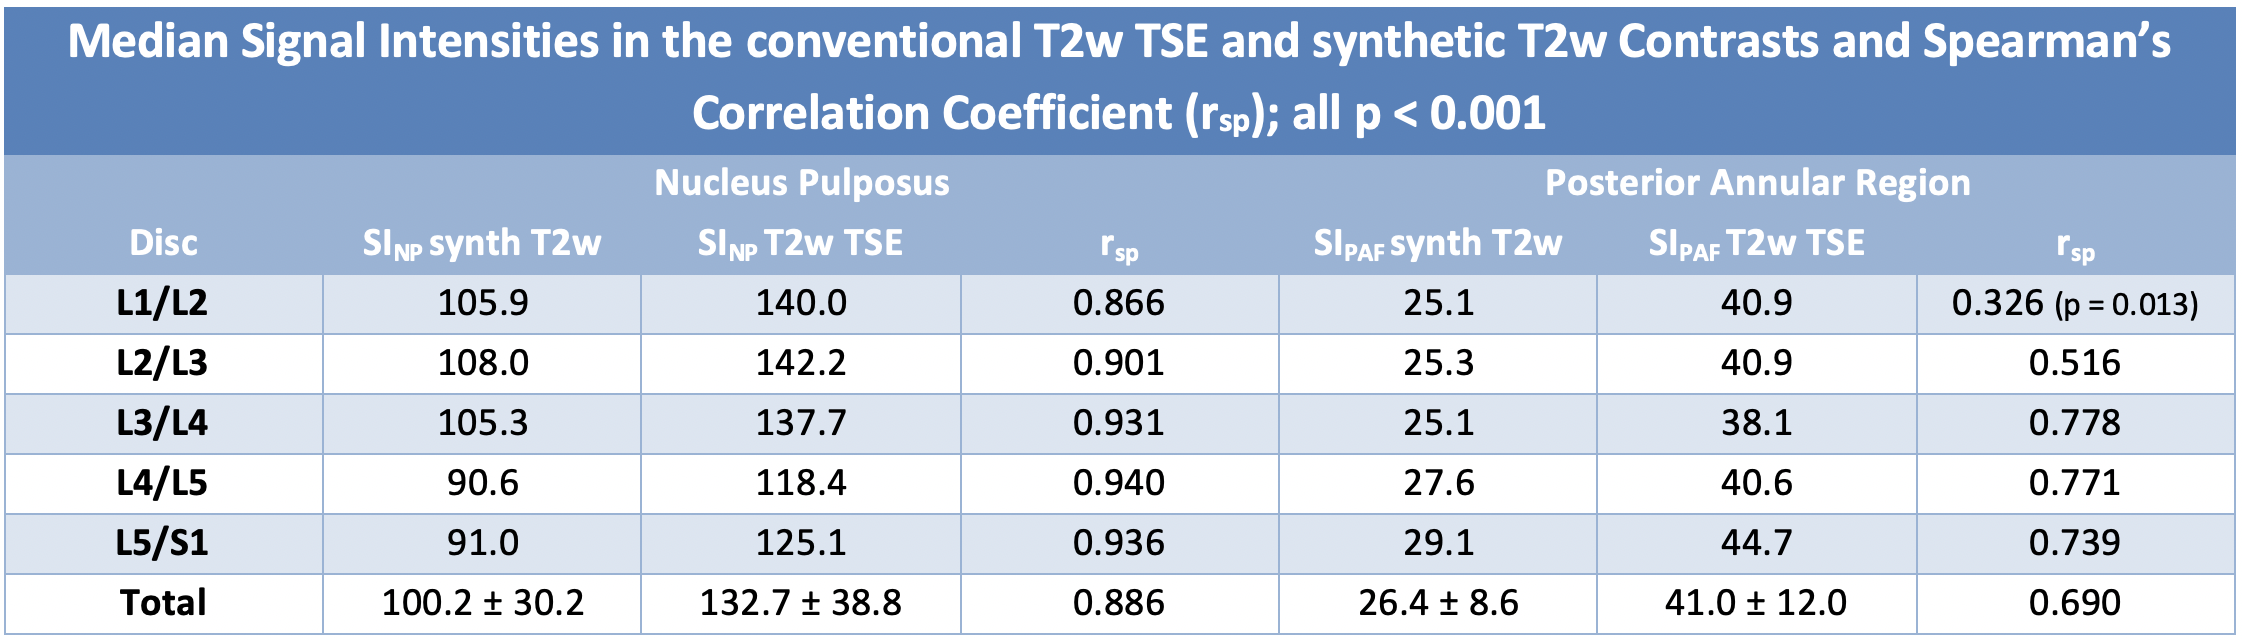
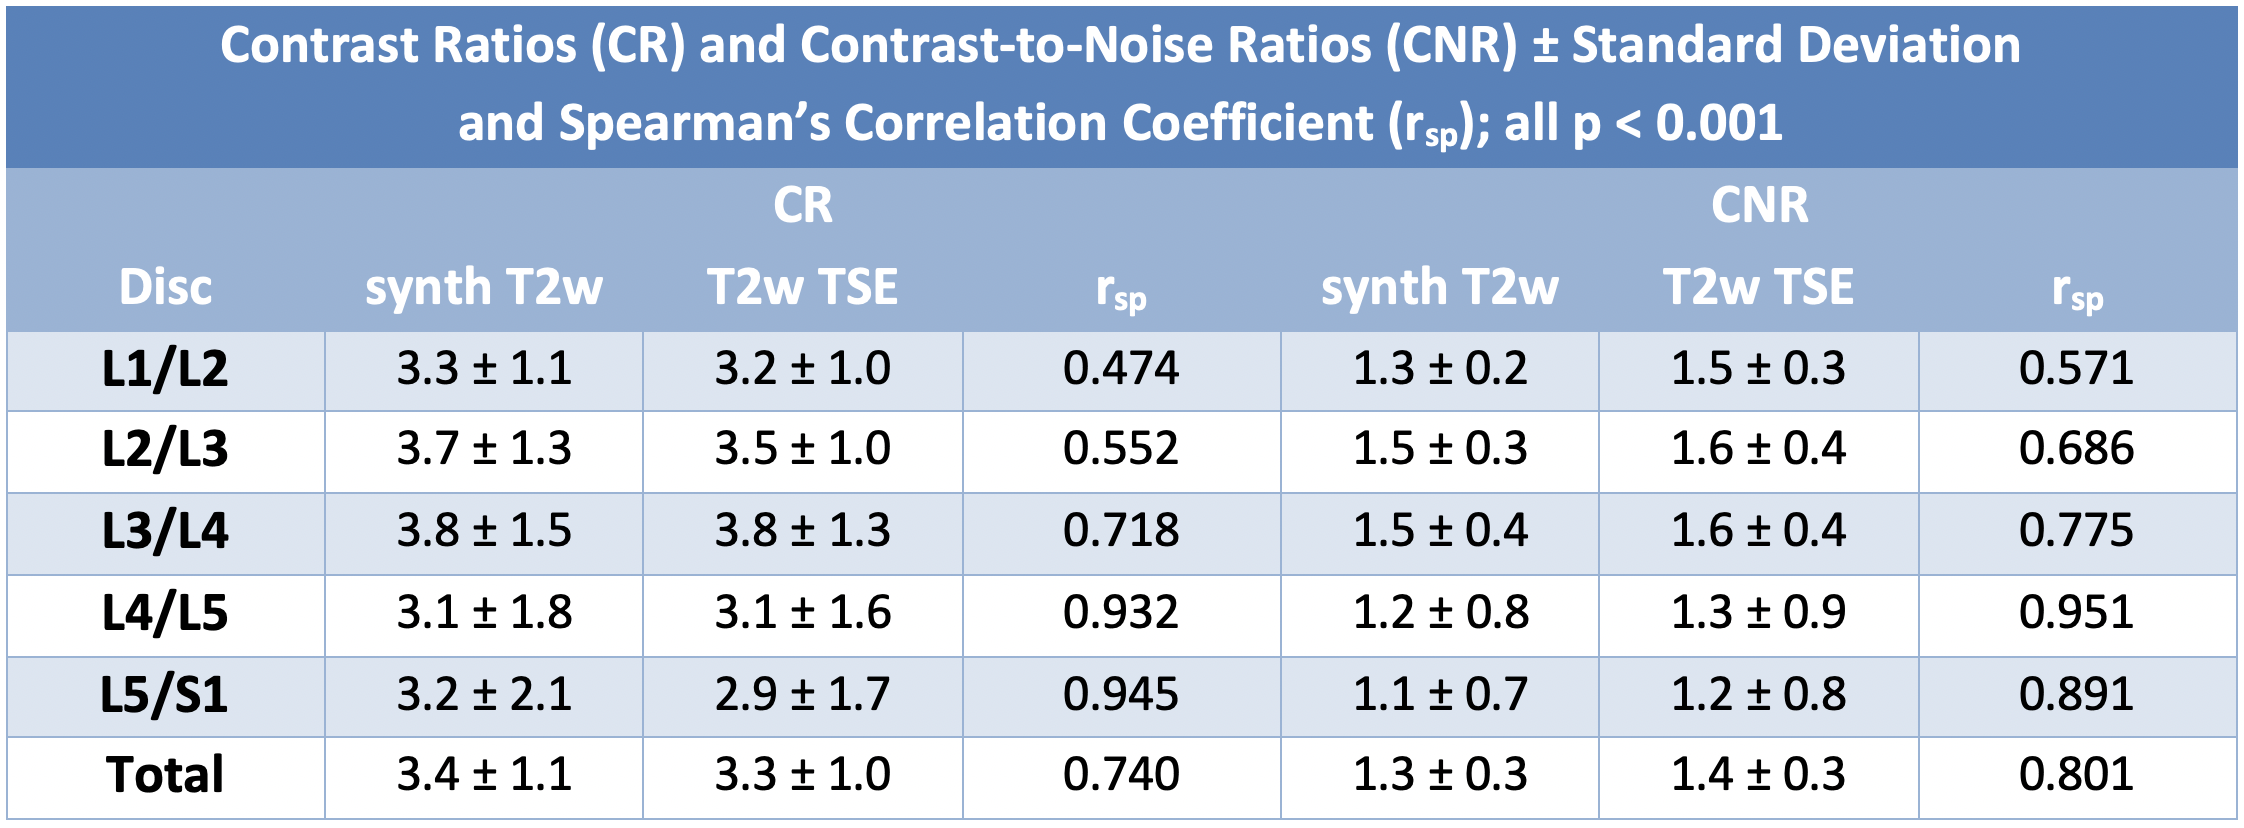
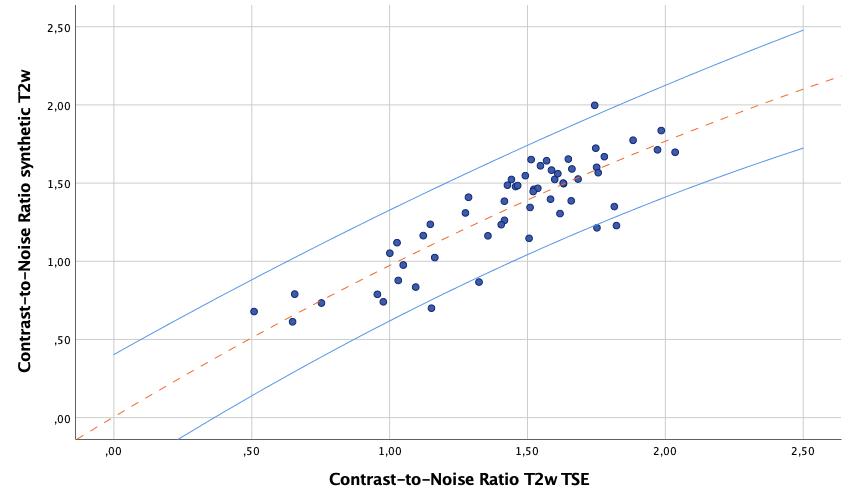
The median overall SINPsynthT2w was 100.2 and the SINPT2wTSE was 132.7 ± 38. (rsp = 0.886, p < 0.001). The median overall SIPAFsynthT2w was 26.4 ± 8.6 and the SIPAFT2wTSE was 41.0 ± 12.0 (rsp = 0.690, p < 0.001).All measurements are summarized in Table 2 with significant Pearson’s correlation coefficient of p < 0.001 for every comparison but the posterior annular region in the first lumbar intervertebral disc (p = 0.013). The mean overall CRsynthT2w was 3.4 ± 1.1 while mean CRT2wTSE was 3.3 ± 1.0 (rsp = 0.740, p < 0.001) and the mean overall CNRsynthT2w was 1.3 ± 0.3 with the mean CNRT2wTSE at 1.4±0.3 (rsp = 0.801, p < 0.001). The agreement of the CNRs between the two measurements is illustrated with a scatterplot in Figure 1.
Discussion
This preliminary analysis illustrates GRAPPATINI’s potential to provide synthetic morphological imaging in addition to robust T2 mapping in 58 individuals in one single fast sequences1. The maximum mean difference was 0.3 for the CR and 0.1 for the CNR across all measurements (Table 3) with widely overlapping variance showing the potential to offer comparable contrast. Furthermore, additional synthetic images can be derived retrospectively without repeating the acquisition. In this study, GRAPPATINI was conducted with comparable parameters (Table 1) yielding an acquisition time of 2:27 min with the possibility to further shorten the protocol to match the acquisition time of the conventional T2w TSE (2:01 min).Of note, there is a systematic offset of SINP and SIPAF between measurements (Table 1). This offset is to be expected since image intensities are not quantitative, i.e. the different reconstructions may apply different image scaling to fit the intensities into the dynamic range of the DICOM standard. However, there may be differences originating from the fitting procedure within GRAPPATINI and due to B1i- field inhomogeneities. Nevertheless, if these differences were large, they would also appear in the CR and CNR measures.
Conclusion
In addition to quantitative T2 mapping, GRAPPATINI provides synthetic, diagnostic-grade morphological images at freely chosen echo times with comparable contrast ratios and contrast-to-noise ratios compared to conventional T2w TSE.Acknowledgements
No acknowledgement found.References
1. Pfirrmann CW, Metzdorf A, Zanetti M, Hodler J, Boos N. Magnetic resonance classification of lumbar intervertebral disc degeneration. Spine (Phila Pa 1976) 2001;26:1873–1878.
2. Jha SC, Higashino K, Sakai T, et al. Clinical significance of high-intensity zone for discogenic low back pain: A review. J. Med. Investig. 2016 doi: 10.2152/jmi.63.1.
3. Blumenkrantz G, Zuo J, Li X, Kornak J, Link TM, Majumdar S. In vivo 3.0-tesla magnetic resonance T1rho and T2 relaxation mapping in subjects with intervertebral disc degeneration and clinical symptoms. Magn Reson Med 2010;63:1193–1200 doi: 10.1002/mrm.22362.
4. Marinelli NL, Haughton VM, Munoz A, Anderson PA. T2 relaxation times of intervertebral disc tissue correlated with water content and proteoglycan content. Spine (Phila Pa 1976) 2009;34:520–524 doi: 10.1097/BRS.0b013e318195dd44.
5. Sumpf TJ, Uecker M, Boretius S, Frahm J. Model‐based nonlinear inverse reconstruction for T2 mapping using highly undersampled spin‐echo MRI. J. Magn. Reson. Imaging 2011;34:420–428.
6. Griswold MA, Jakob PM, Heidemann RM, et al. Generalized Autocalibrating Partially Parallel Acquisitions (GRAPPA). Magn. Reson. Med. 2002 doi: 10.1002/mrm.10171.
7. Hilbert T, Sumpf TJ, Weiland E, et al. Accelerated T2 mapping combining parallel MRI and model‐based reconstruction: GRAPPATINI. J. Magn. Reson. Imaging 2018.
8. Roux M, Hilbert T, Hussami M, Becce F, Kober T, Omoumi P. MRI T2 Mapping of the Knee Providing Synthetic Morphologic Images: Comparison to Conventional Turbo Spin-Echo MRI. Radiology 2019 doi: 10.1148/radiol.2019182843.
9. Fritz J. T2 Mapping without Additional Scan Time Using Synthetic Knee MRI. Radiology 2019:192046 doi: 10.1148/radiol.2019192046.
10. Wang F, Zhang H, Wu C, et al. Quantitative T2 mapping accelerated by GRAPPATINI for evaluation of muscles in patients with myositis. Br. J. Radiol. 2019 doi: 10.1259/bjr.20190109.
11. Yushkevich PA, Piven J, Hazlett HC, et al. User-guided 3D active contour segmentation of anatomical structures: Significantly improved efficiency and reliability. Neuroimage 2006 doi: 10.1016/j.neuroimage.2006.01.015.
Figures