3663
Fully Automated Quantitative Assessment of the Lumbar Intervertebral Disk
Tom Hilbert1,2,3, Marcus Raudner4, Markus Schreiner4,5, Anna Szelenyi4, Vladimir Juras4, Siegfried Trattnig4, and Tobias Kober1,2,3
1Advanced Clinical Imaging Technology, Siemens Healthcare, Lausanne, Switzerland, 2Department of Radiology, Lausanne University Hospital and University of Lausanne, Lausanne, Switzerland, 3LTS5, École Polytechnique Fédérale de Lausanne (EPFL), Lausanne, Switzerland, 4High Field MR Centre, Department of Biomedical Imaging and Image-guided Therapy, Medical University of Vienna, Vienna, Austria, 5Department of Orthopaedics and Trauma Surgery, Medical University of Vienna, Vienna, Austria
1Advanced Clinical Imaging Technology, Siemens Healthcare, Lausanne, Switzerland, 2Department of Radiology, Lausanne University Hospital and University of Lausanne, Lausanne, Switzerland, 3LTS5, École Polytechnique Fédérale de Lausanne (EPFL), Lausanne, Switzerland, 4High Field MR Centre, Department of Biomedical Imaging and Image-guided Therapy, Medical University of Vienna, Vienna, Austria, 5Department of Orthopaedics and Trauma Surgery, Medical University of Vienna, Vienna, Austria
Synopsis
Quantitative imaging can detect subtle changes invisible to the naked eye and enables establishing healthy normative ranges. We report a comprehensive pipeline for fully automated assessment of the lumbar intervertebral disk based on a single fast T2-mapping acquisition of 2:27 min. In this proof-of-concept study, norm values are derived from 19 healthy subjects. Feasibility is shown in 19 patients: three regions are automatically segmented in each intervertebral disk and compared to corresponding norm values. Results are then compiled in a report where abnormal regions are flagged.
Introduction
In recent years, the advances in fast quantitative imaging enabled acquisition times that allow their use in clinical routine. To fully exploit the potential of quantitative imaging, the quantitative maps of individual patients need to be compared to a healthy database1 or longitudinally across timepoints2. In this context, it has been shown for the lumbar spine that disc herniation can be predicted by analysing the T2 values within regions of interests (ROI)3. However, manual segmentation and comparison of T2 values is too time consuming for the clinical workflow and impedes the use of these findings in daily practice. To address these shortcomings, this work aims at developing a fully automated quantitative MRI analysis pipeline for lumbar spine T2 maps acquired in 2:27min by automatically segmenting and analysing ROIs and comparing the obtained values to a healthy cohort in a proof-of-concept setup.Materials and Methods
DatasetAfter obtaining written and informed consent, 19 healthy volunteers and 19 patients with dorsal pain were scanned with a fast T2-mapping prototype sequence (GRAPPATINI)4 providing both T2 maps and synthetic T2-weighted (T2w) images. Additionally, a conventional T2w image was acquired using a turbo spin-echo (TSE) sequence5. All exams were performed at 3T (MAGNETOM Prismafit, Siemens Healthcare, Erlangen, Germany) using a 32-channel spine coil. Relevant acquisition parameters are summarized in Table 1.Twenty-one regions of interest (ROI) - the ventral and dorsal section of the Anulus Fibrosus (vAF, dAF), the Nucleus Polposus (NP), and the vertebral bone marrow of the lumbar spine - were manually segmented by a radiologist. This manual segmentation was performed on the TSE image using ITK-Snap6.
Automated Lumbar Spine Segmentation
To enable automated segmentation of T2 ROIs in the native space of the quantitative maps, the conventional T2w images and their manually segmented label maps were used as atlases in a multi-atlas segmentation7. More specifically, the T2w images of all healthy subjects were non-linearly registered to the synthetic T2w image of GRAPPATINI. The resulting transformation was applied to the corresponding label maps yielding a set of label masks in the native space of the GRAPPATINI acquisition. A majority vote was performed across label masks to obtain the final segmentation. The segmentation quality of each individual ROI was accessed by averaging the amount of majority (in percent) across voxels within the ROI.
Deriving Normative T2
To obtain ranges of normal T2 values, the multi-atlas segmentation was performed on each healthy subject. For this task, all healthy subjects were used as atlases except for the subject that was currently processed. Subsequently, for each ROI, the mean and standard deviation across all healthy subjects was calculated from the median T2 value within each ROI.
Detecting Abnormal T2
In order to detect abnormal T2 values, the same multi-atlas segmentation was applied to all patients, using all healthy subjects as atlases. Subsequently, median T2 values within the ROIs were compared to normal ranges by calculating the z-score, i.e. the deviation from the mean in the unit of standard deviations. The results for each individual patient were summarized in a report by listing the median T2 values, z-scores, the normal range, and the above segmentation quality metric for each ROI.
Results
Figure 1 shows an example dataset from one healthy subject. The derived normative values of T2 are listed in Table 2. An example report for one patient is shown in Figure 2. The T2 values of the disc between L4 and L5 were abnormal (i.e. |z-score| > 1.96) with the vAF being 0.7 ms above the normal range and the NP being 14.5 ms below the normal range. For comparison, Figure 3 shows the report for a healthy subject (the subject itself was excluded from deriving the normative ranges). All ROIs showed T2 values within the normal range. Of note, the proposed segmentation exhibited poor results for one healthy subject and three patients.Discussion
The results show how quantitative imaging can be included in a clinical workflow without increasing the workload for radiologists in a proof-of-concept setup. The proposed pipeline performs the entire analysis, from T2 map to a quantitative report, fully automatically using a fast T2 mapping acquisition also producing synthetic T2w contrasts. The report offers an analysis specific to anatomical structures which may facilitate a personalized therapy planning for the patient. Notably, the segmentation should be validated by assessing its reproducibility in comparison to manual segmentation and could be further improved to provide a more accurate delineation of the desired anatomical structures. For example, as deep learning approaches showed improved performance for this type of problem, this could offer a way for future amelioration. Another limitation is the small database of 19 healthy subjects due to the proof-of-concept setup. Since the feasibility has been demonstrated with this work, in a next step, a large cohort (>200 subjects) across the entire age range (20-80 yo.) should be acquired. Such a large cohort will also allow to model confounding effects such as age, body-mass-index, autochthonous musculature and sex in the normative ranges.Conclusion
With the proposed method, it is possible to provide a full quantitative analysis of the T2 values in the lumbar spine based on a single acquisition with a measurement time of 2:27 min.Acknowledgements
No acknowledgement found.References
- Piredda GF, Hilbert T, Granziera C, et al. Quantitative brain relaxation atlases for personalized detection and characterization of brain pathology. Magn Reson Med. 2020;83(1). doi:10.1002/mrm.27927
- Bonnier G, Fischi-Gomez E, Roche A, et al. Personalized pathology maps to quantify diffuse and focal brain damage. NeuroImage Clin. 2019;21:101607. doi:10.1016/j.nicl.2018.11.017
- Raudner M, Schreiner MM, Juras V, et al. Prediction of Lumbar Disk Herniation and Clinical Outcome Using Quantitative Magnetic Resonance Imaging: A 5-Year Follow-Up Study. Invest Radiol. 2019;54(3):183-189. doi:10.1097/RLI.0000000000000527
- Hilbert T, Sumpf TJ, Weiland E, et al. Accelerated T 2 mapping combining parallel MRI and model-based reconstruction: GRAPPATINI. J Magn Reson Imaging. 2018. doi:10.1002/jmri.25972
- Hennig J, Nauerth A, Friedburg H. RARE imaging: A fast imaging method for clinical MR. Magn Reson Med. 1986;3(6):823-833. doi:10.1002/mrm.1910030602
- Yushkevich PA, Piven J, Hazlett HC, et al. User-guided 3D active contour segmentation of anatomical structures: Significantly improved efficiency and reliability. Neuroimage. 2006;31(3):1116-1128. doi:10.1016/j.neuroimage.2006.01.015
- Iglesias JE, Sabuncu MR. Multi-atlas segmentation of biomedical images: A survey. Med Image Anal. 2015;24(1):205-219. doi:10.1016/j.media.2015.06.012
Figures
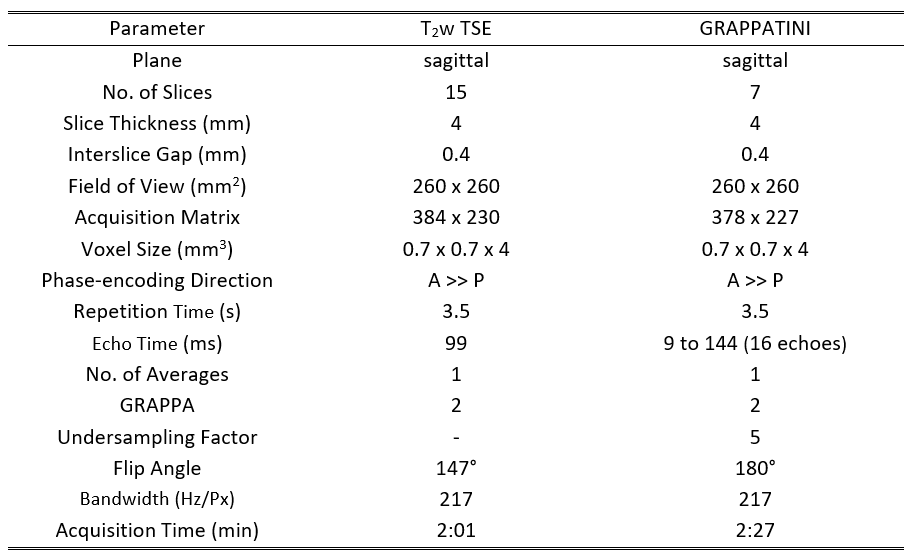
Table 1: A summary of all parameters for the conventional T2-weighted (T2w) turbo spin echo (TSE) sequence and the prototype T2 mapping (GRAPPATINI) sequence used in this study.
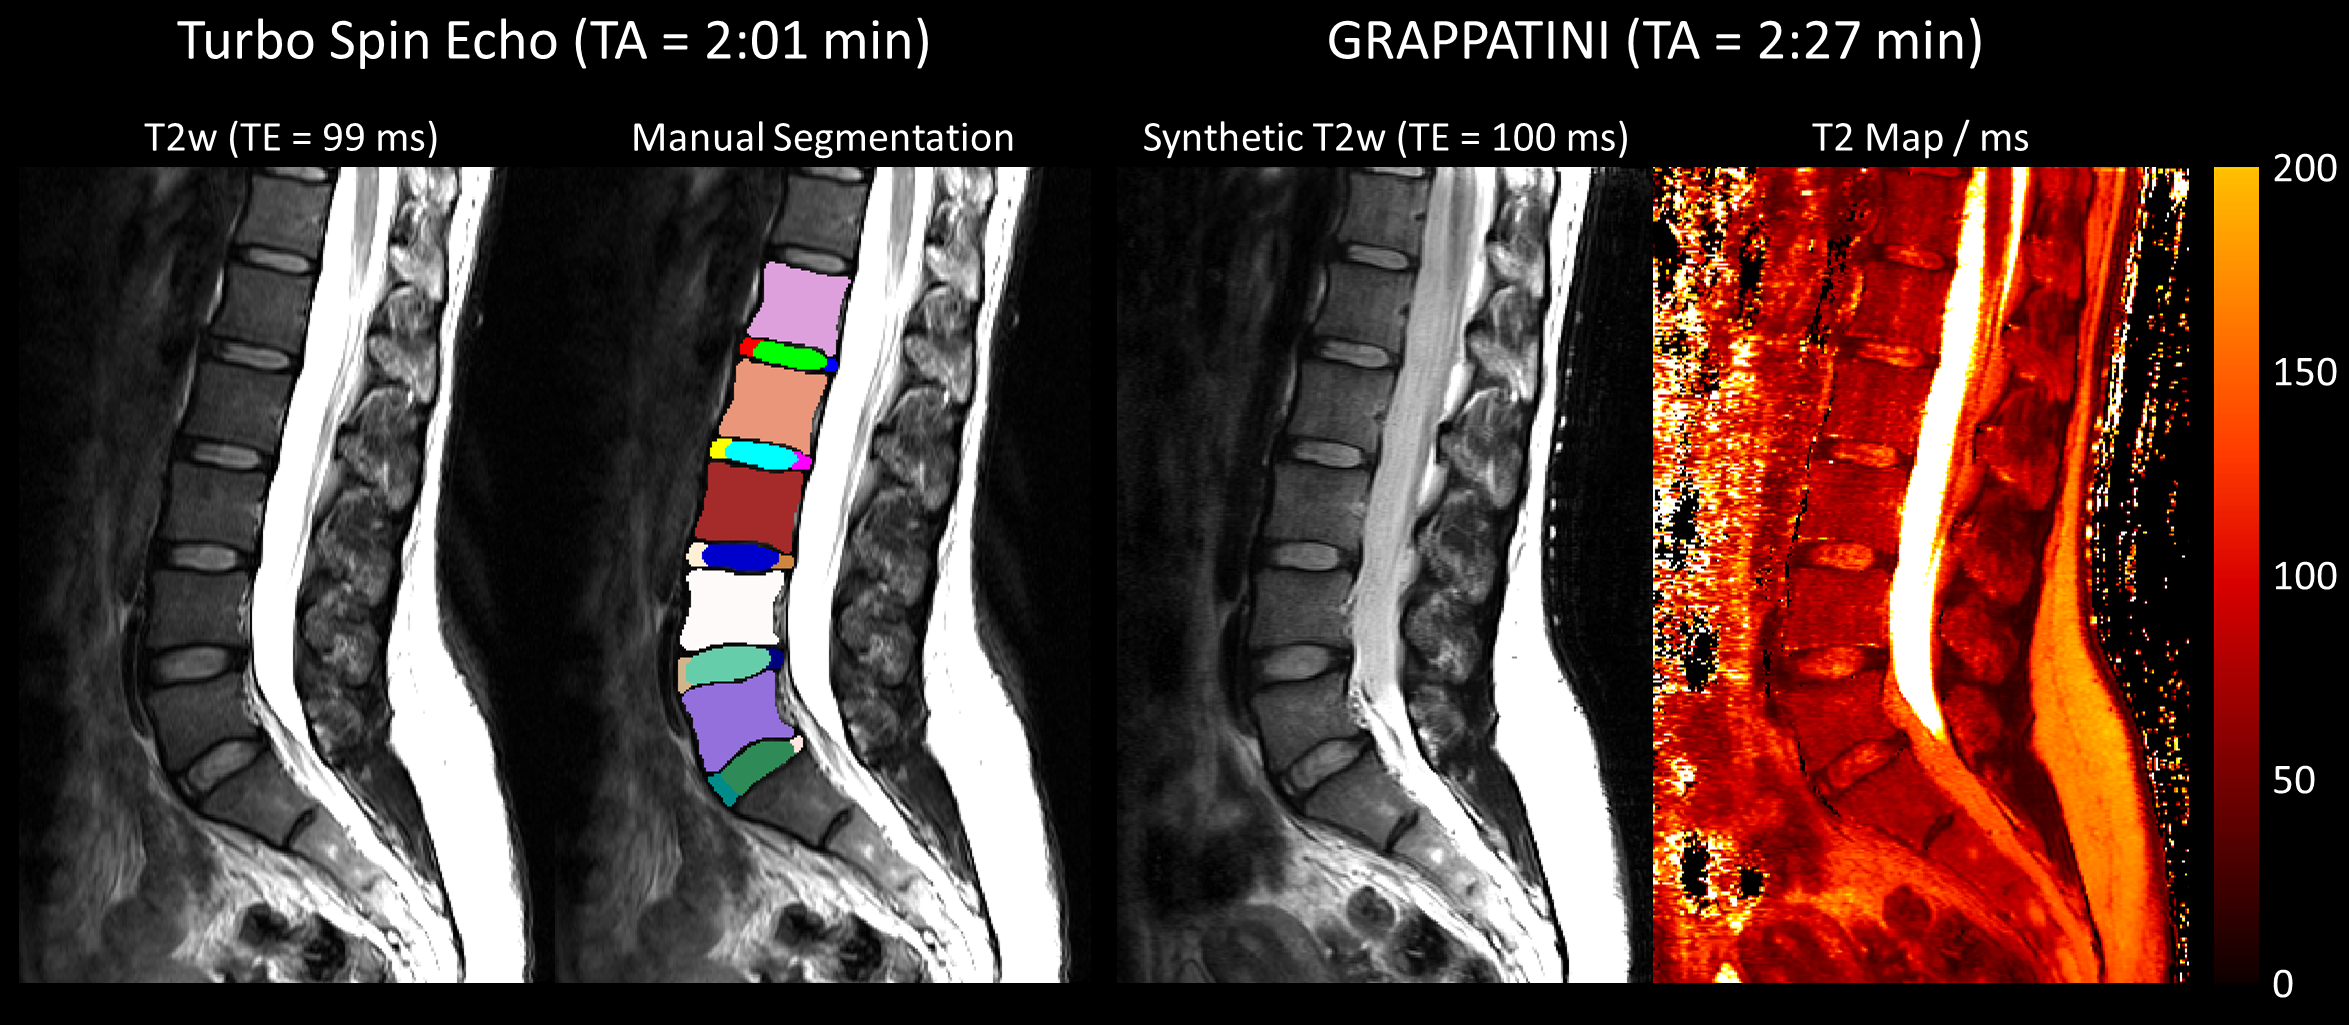
Figure 1: An example dataset from one healthy subject. From left to right: T2-weighted (T2w) image of the turbo spin echo, the same T2w image with the manual segmentation as an overlay, the synthetic T2w image, and T2 map obtained by a fast, quantitative sequence (GRAPPATINI).
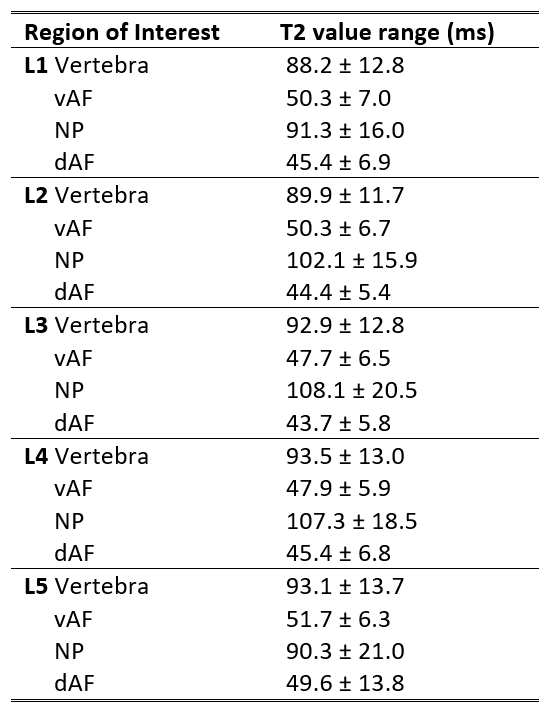
Table 2: Normative T2 values (mean ± standard deviation) that were found within the regions of interest of the healthy subjects. The regions were the vertebra, ventral/dorsal Anulus Fibrosus (vAF/dAF), and Nucleus Polposus (NP) in the lumbar spine.
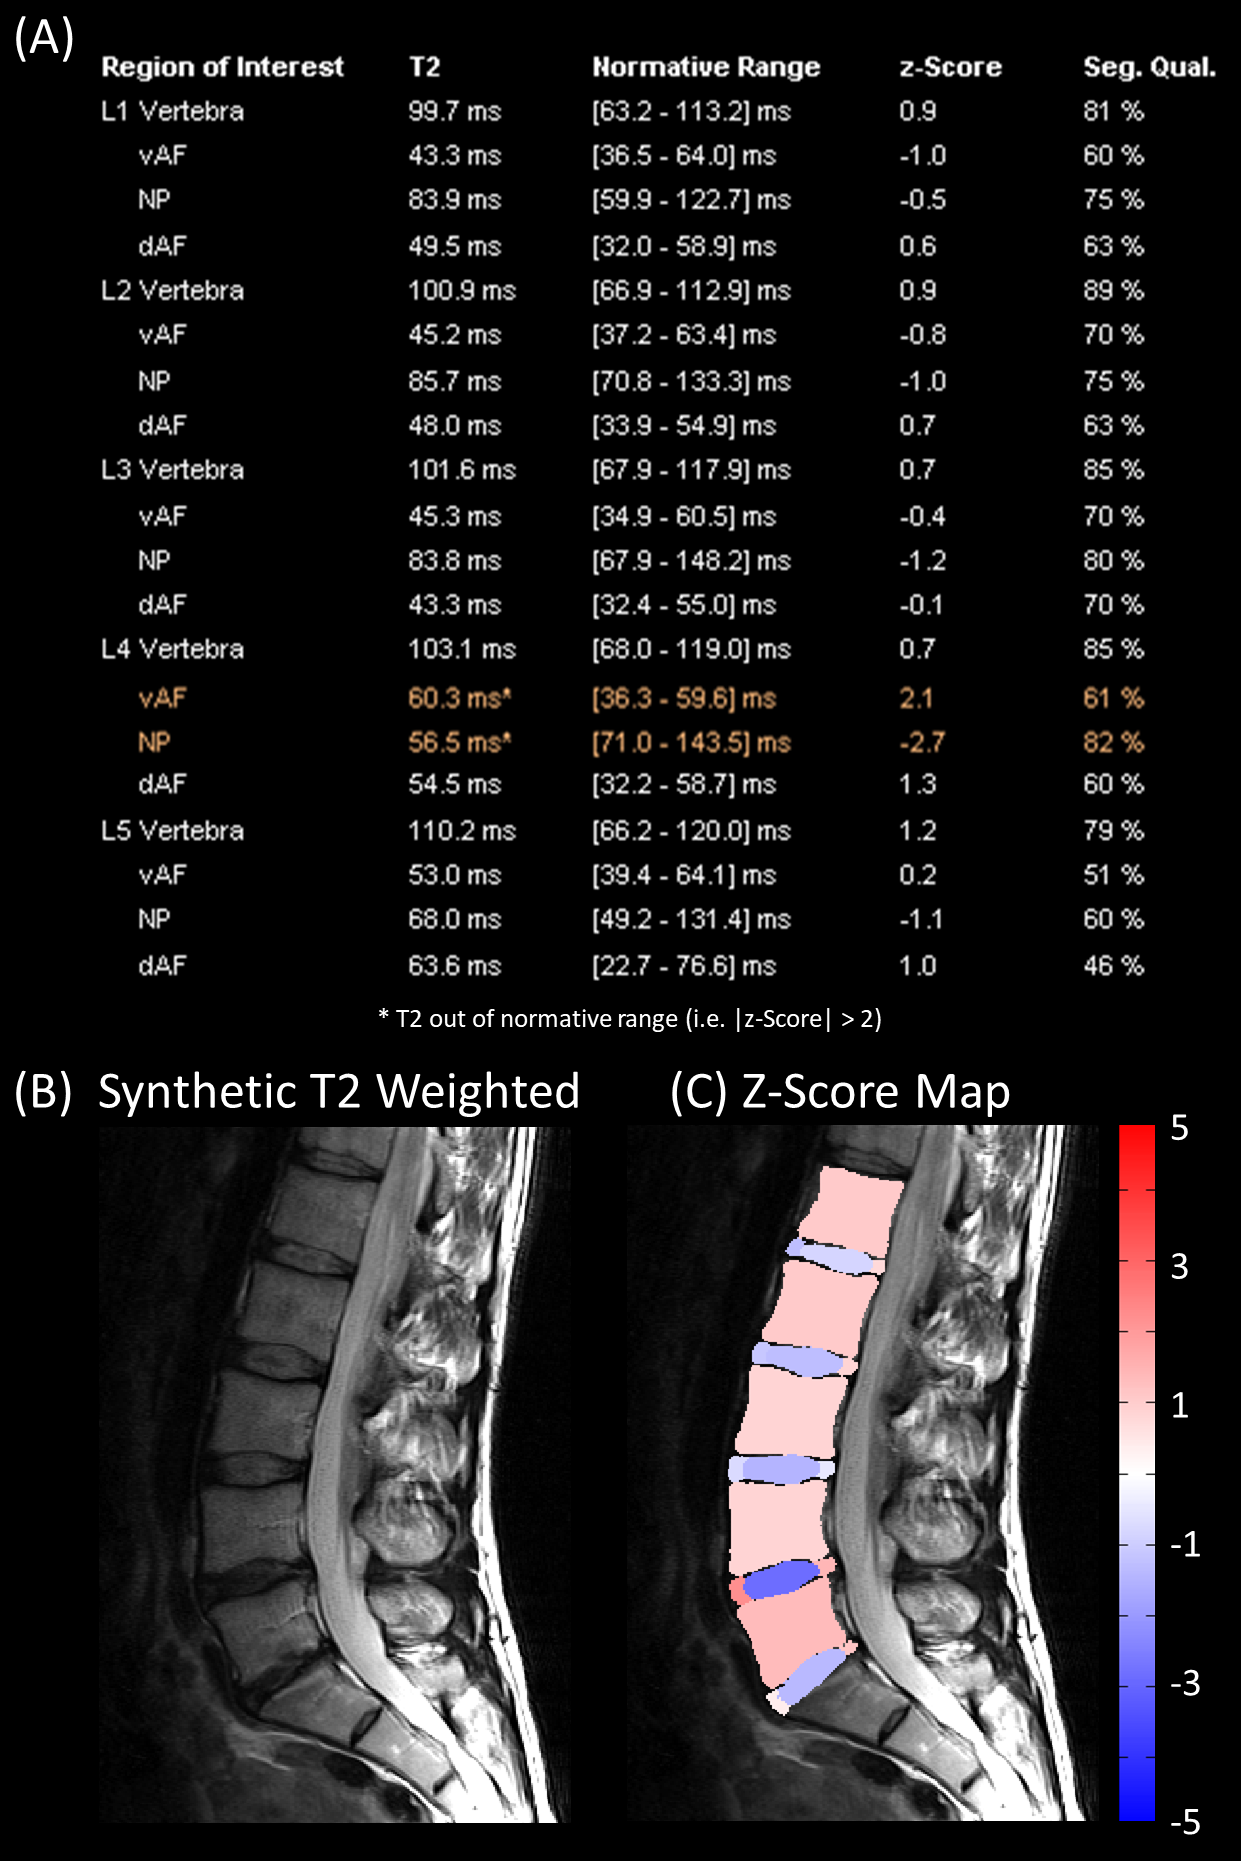
Figure 2: Example result of the analysis for one patient. The different panels show: (A) the report with the quantitative median T2 values, the corresponding normal range (95% confidence interval), the z-score, the segmentation quality (Seg. Qual.) for each ROI in the vertebra, ventral/dorsal Anulus Fibrosus (vAF/dAF) and Nucleus Polposus (NP) in the lumbar spine, (B) the corresponding synthetic T2-weighted image, and (C) a visualization of the z-scores within the segmented ROIs overlaid on the T2-weighted image.
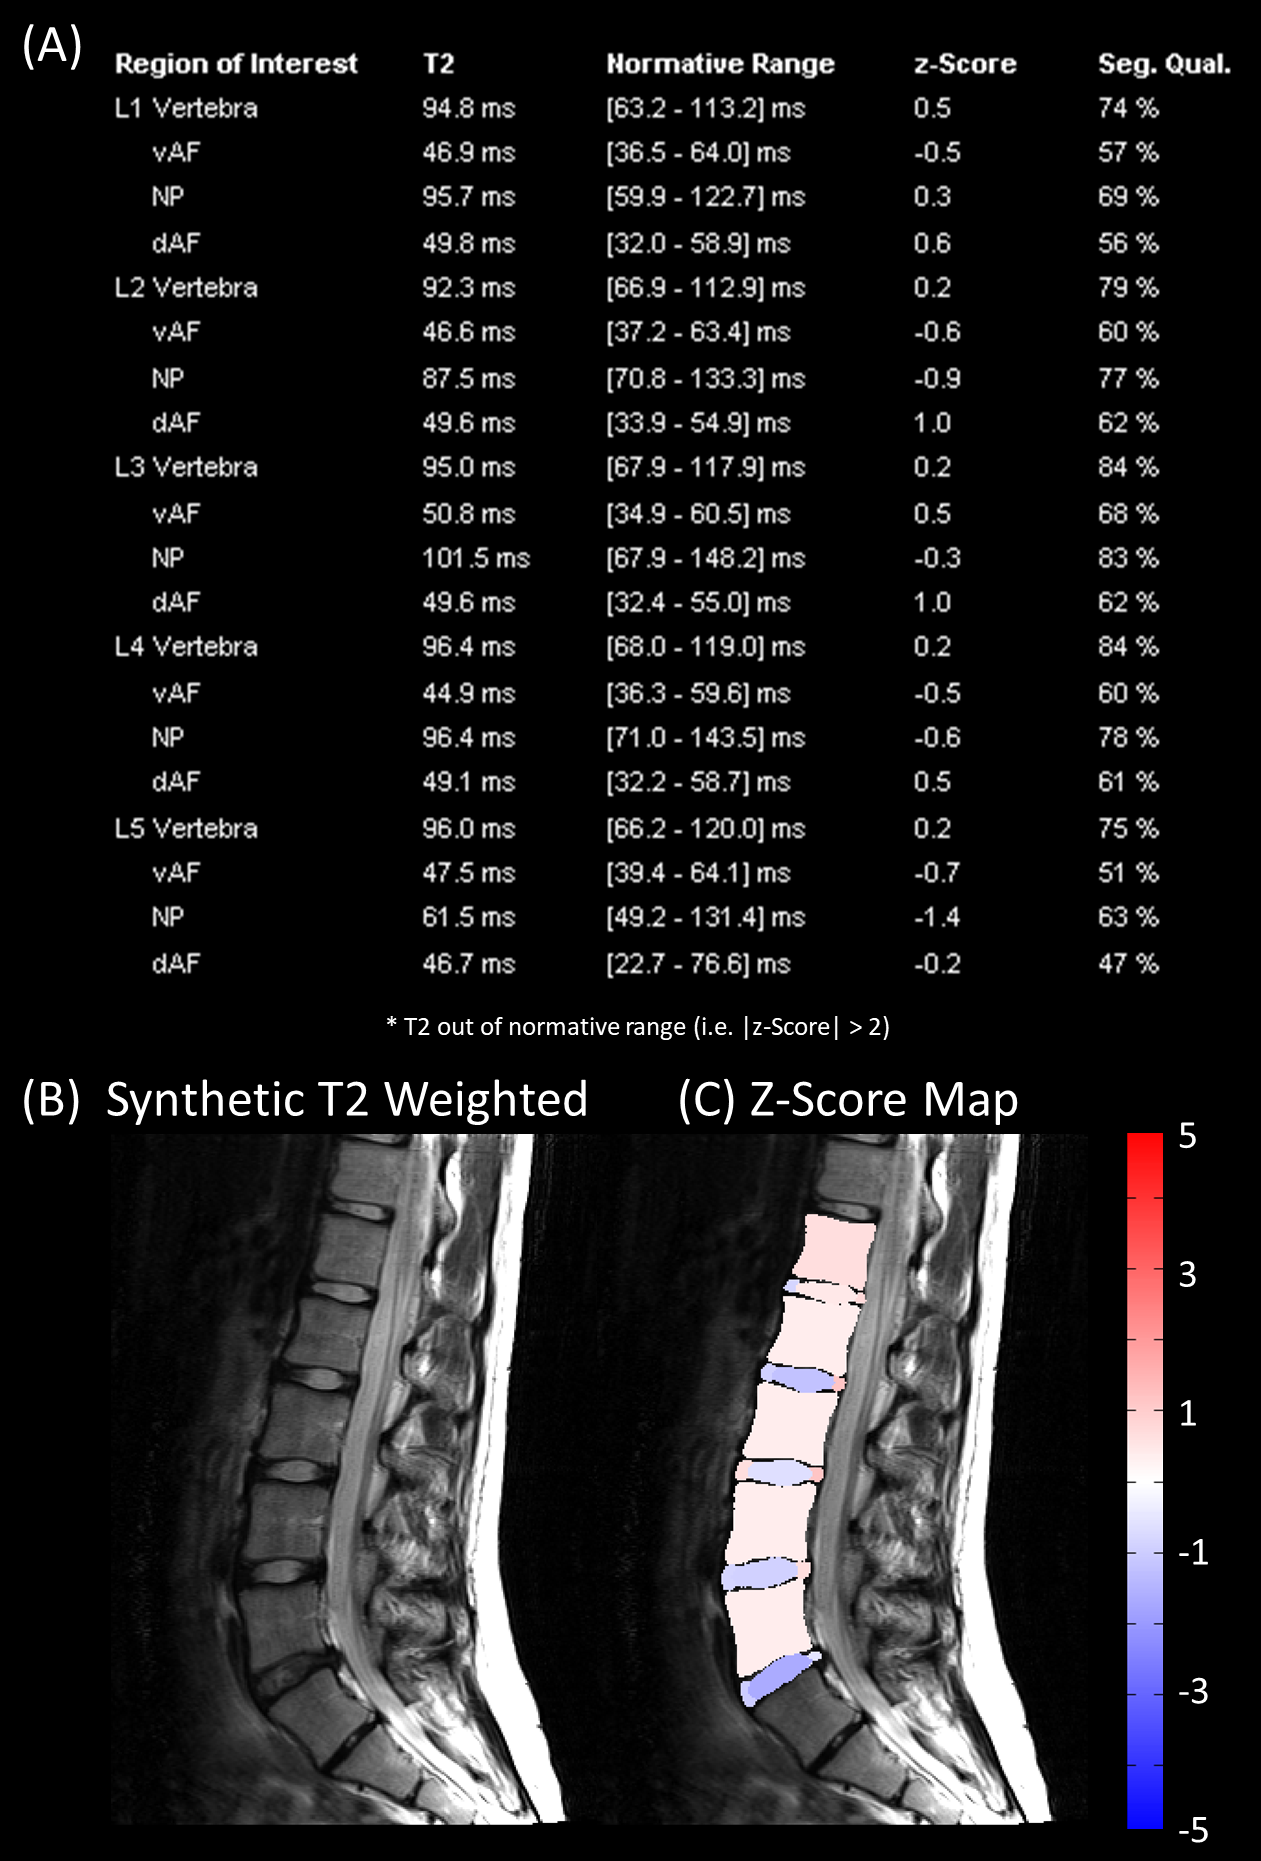
Figure 3: Example result of the analysis for one healthy subject. The different panels show: (A) the report with the quantitative median T2 values, the corresponding normal range (95% confindence interval), the z-score, the segmentation quality (Seg. Qual.) for each ROI in the vertebra, ventral/dorsal Anulus Fibrosus (vAF/dAF) and Nucleus Polposus (NP) a visualization of the z-scores within the segmented ROIs overlaid on the T2-weighted image.