3662
Improving spatial normalization of functional MRI data of the spinal cord using cerebrospinal fluid segmentation1Department of computer engineering and software engineering, Polytechnique Montreal, Montreal, QC, Canada, 2Montreal Neurological Institute, McGill University, Montreal, QC, Canada, 3Center of Precision Rehabilitation for Spinal Pain (CPR Spine), University of Birmingham, Birmingham, United Kingdom, 4Center for Neuroprosthetics, École Polytechnique Fédérale de Lausanne, Lausanne, Switzerland
Synopsis
Analyzing functional MRI of the spinal cord is challenging due to large susceptibility artifacts and inter-subject variability in terms of shape and curvature. More particularly, the poor contrast between the spinal cord and cerebrospinal fluid (CSF) leads to co-registration errors when analyzing the spinal cord functional activity at the group level. This study proposes a new registration framework that leverages the contrast between the CSF and its surrounding structure. Results show an increase of 67% in the number of active voxels at the group level, with an increase of 5% and 23% for the mean and max z-score, respectively.
Introduction
Functional Magnetic Resonance Imaging (fMRI) of the spinal cord is challenging due to its large inter-subject variability in terms of shape and curvature, as well as poor representation of the spinal cord in MRI preprocessing software. More particularly, analyzing spinal cord fMRI data requires the co-registration of all images into a common anatomical reference space. While several templates and normalization procedures exist in the literature, most existing registration approaches use the contrast between the spinal cord and the surrounding cerebrospinal fluid (CSF). However, fMRI data of the cervical spinal cord is prone to high physiological noise and large susceptibility artifacts that can make the delineation of the spinal cord challenging, leading to registration and analysis errors1. This study aims at leveraging the existing contrast between the CSF and the surrounding structures for the normalization process, potentially leading to more robust and reliable fMRI analysis results.Methods
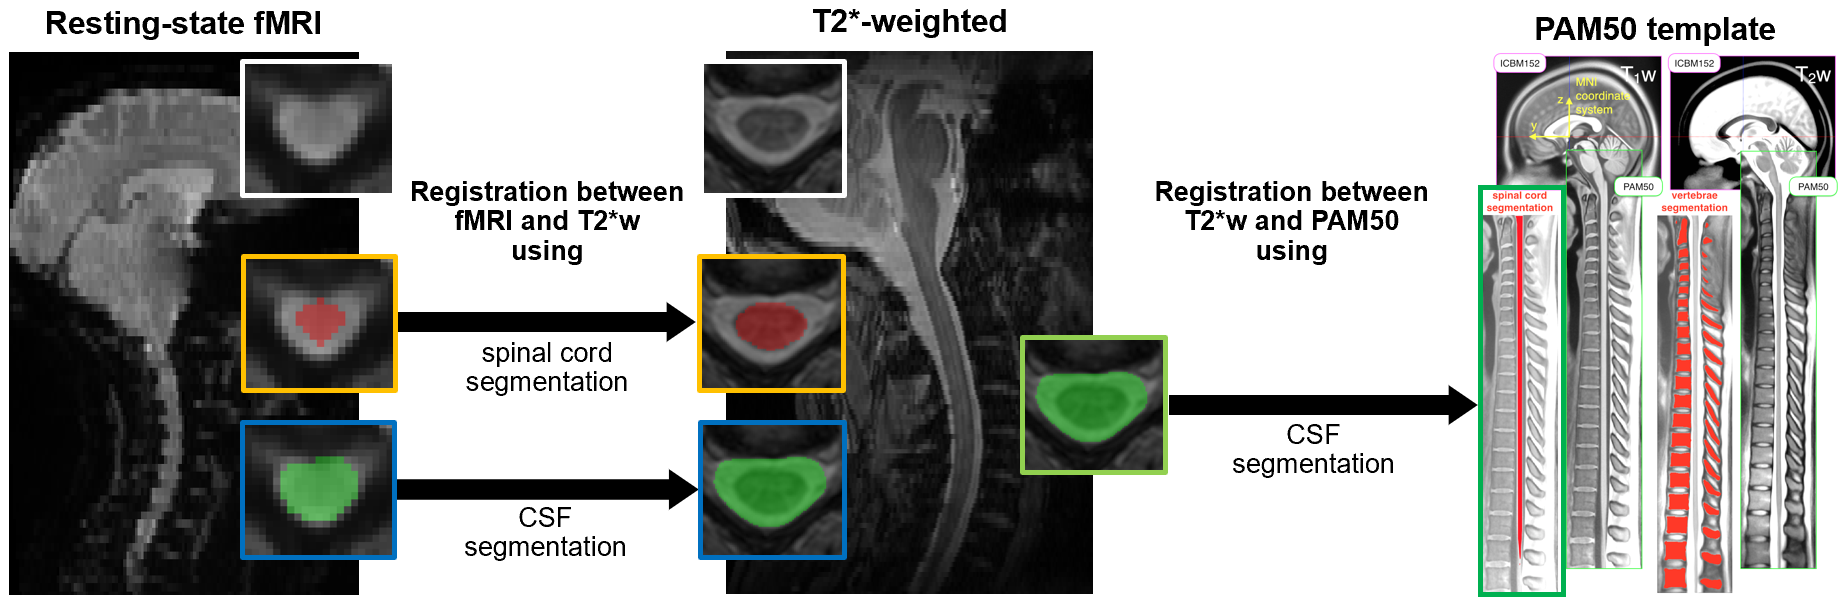
T2*-weighted (T2*w) and functional MRI (fMRI) were acquired from 20 healthy subjects (8/12 male/female, mean age=32 y.o.) on a 3T Siemens TIM TRIO scanner with a 64-channel head and neck coil, covering the brain and spinal cord from C1 to T2 vertebrae. The study was approved by the local ethics committees, and all participants gave their written informed consent. The acquisition parameters of the T2*w multiecho recombined gradient-echo sequence were: 3 echoes (magnitude-reconstructed and combined by using a sum-of-squares algorithm) with an average TE = 14 ms; TR = 33 ms; FoV = 180×180x224 mm; resolution = 0.35×0.35x2 mm. For functional acquisitions, an echo-planar imaging (EPI) gradient-echo sequence was used with the following parameters: TR = 1,550 ms; TE = 23 ms; FA = 70°; FoV = 120 × 120 mm; matrix size = 64 × 64; slice thickness = 4.4 mm; in-plane resolution = 1.6 × 1.6 mm, parallel imaging with an accelerated factor of 3 and GRAPPA reconstruction.The fMRI images were obtained during a motor sequence learning (MSL) task, where subjects were taught a simple five-sequence finger-tapping task. This was performed in the scanner, over a duration of 14 blocks. Duration and accuracy were recorded as a measure of performance. Preprocessing of the fMRI images included (i) motion correction using a slice-wise regularized non-linear registration approach based on cross-correlation within a mask of the spinal cord and CSF2, (ii) automatic spinal cord and CSF segmentation using PropSeg3, manually corrected when necessary, and (iii) registration of the fMRI images to the PAM50 template4 via the T2*w image using a two-step non-linear deformation approach based on the spinal cord / CSF segmentation, as described in Figure 1. Finally, motion parameters, the average CSF signal and physiological recordings during the task were used as regressors in the final denoising step. The denoised MSL task activation data were then normalized to a common template space for further group analyses. Statistical analyses were carried out based on the general linear model (GLM) in FSL.
Two different registration frameworks were employed to register the fMRI data to the structural T2*w images (step iii): (1) using the spinal cord segmentation and (2) using the CSF segmentation. To compare these two registration strategies, the fMRI data were analyzed at the group level. A mixed-effects model was conducted with FSL’s FLAME1. A one-sample t-test of the overall activity during the MSL blocks only was carried out, and the resulting statistical maps were corrected for multiple comparisons using Gaussian Random Field theory (GRF) with a z-threshold of 2.7, and a cluster probability threshold of <0.05. The comparison of the two registration frameworks was performed by comparing the overall activity at the group level, by calculating the mean and maximum z-score as well as the count of active voxels after clustering and thresholding.
Results
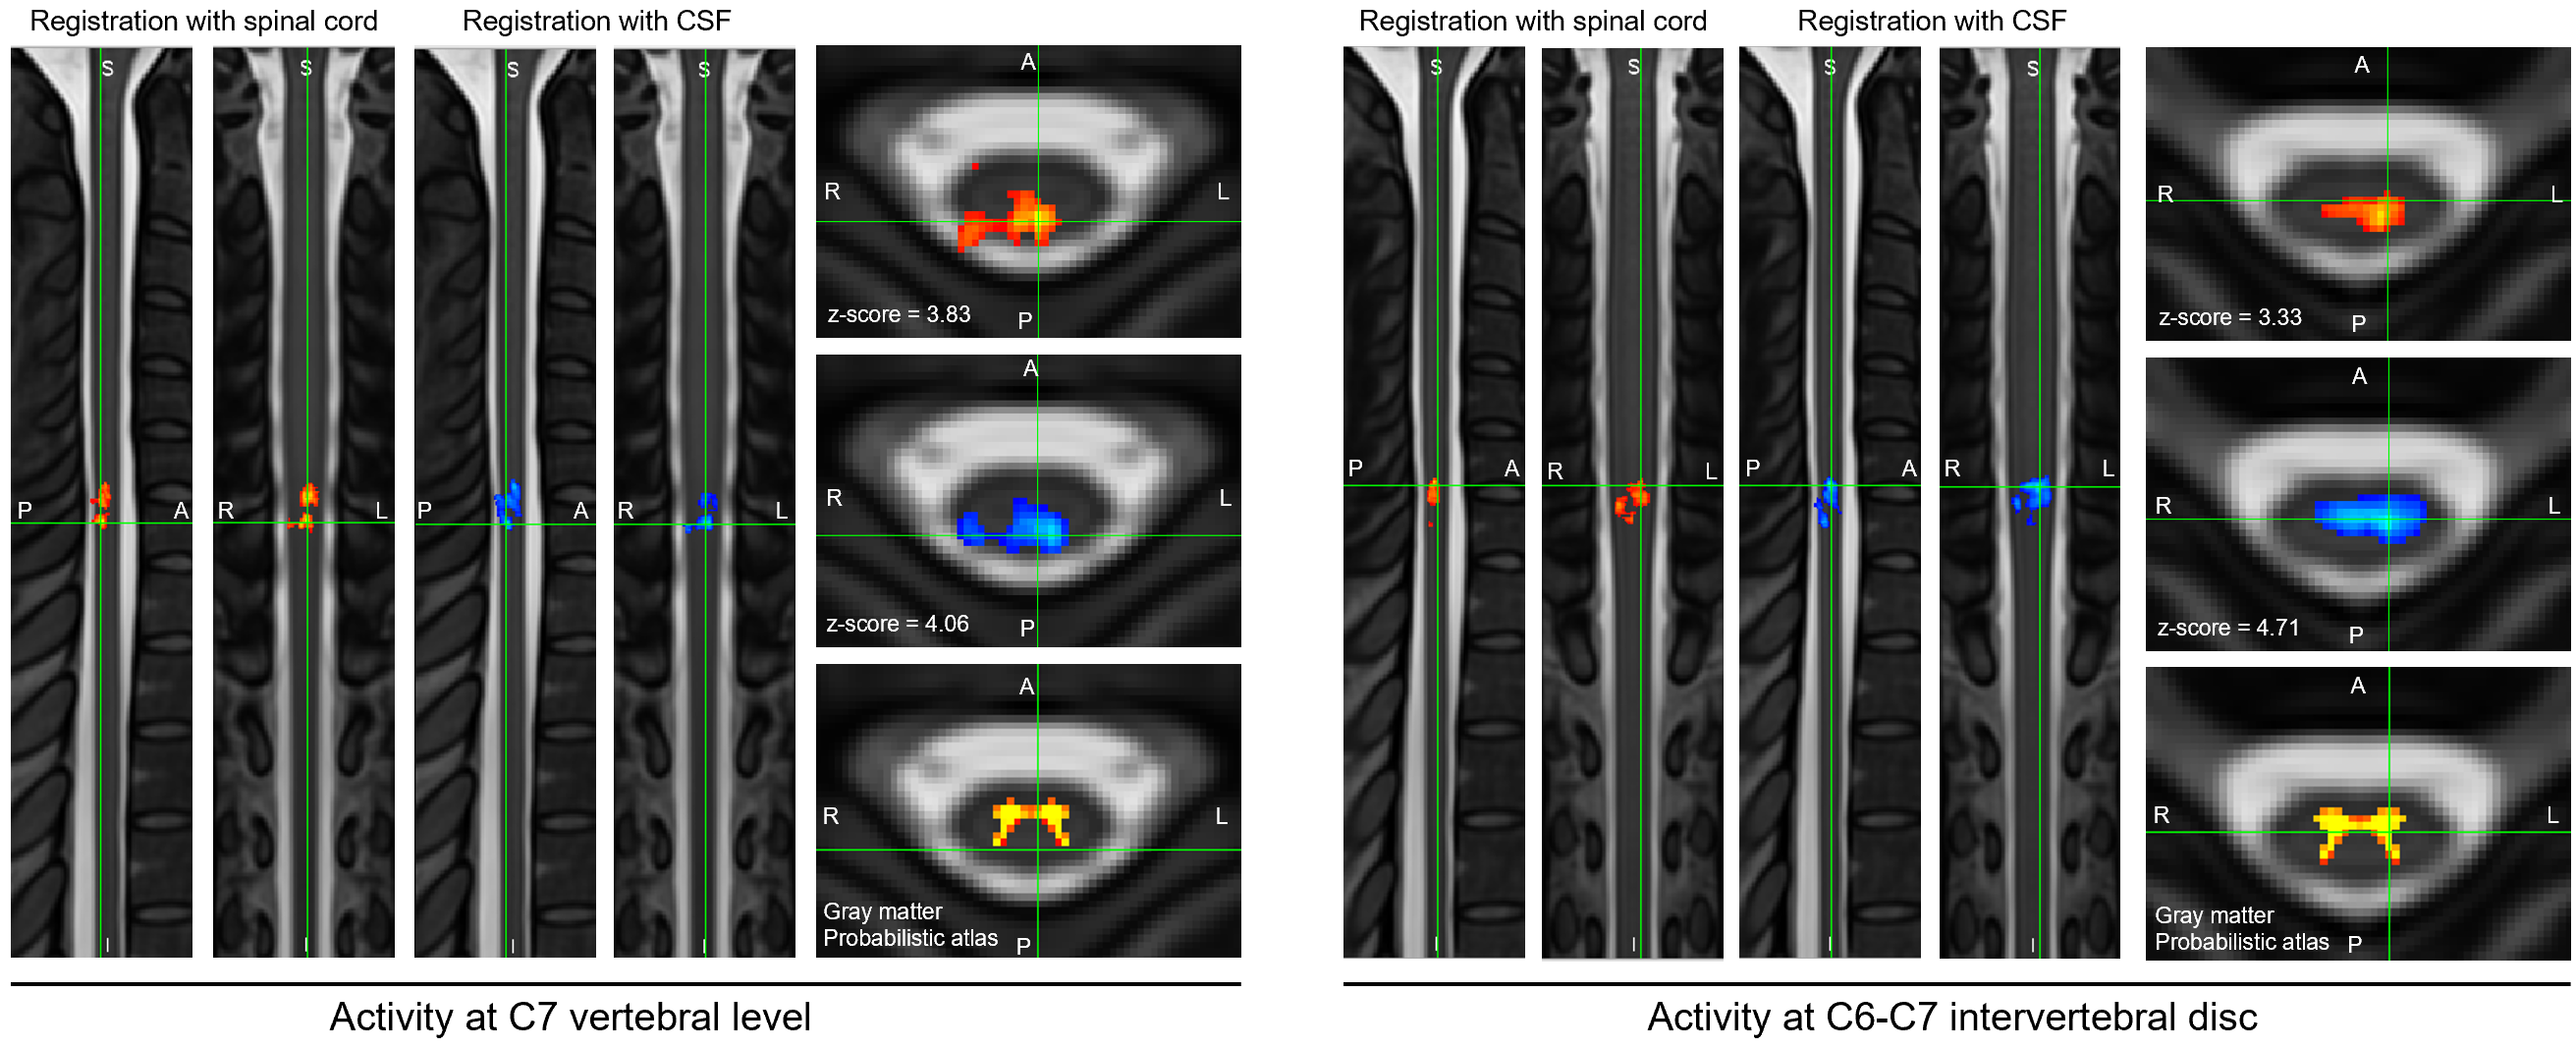
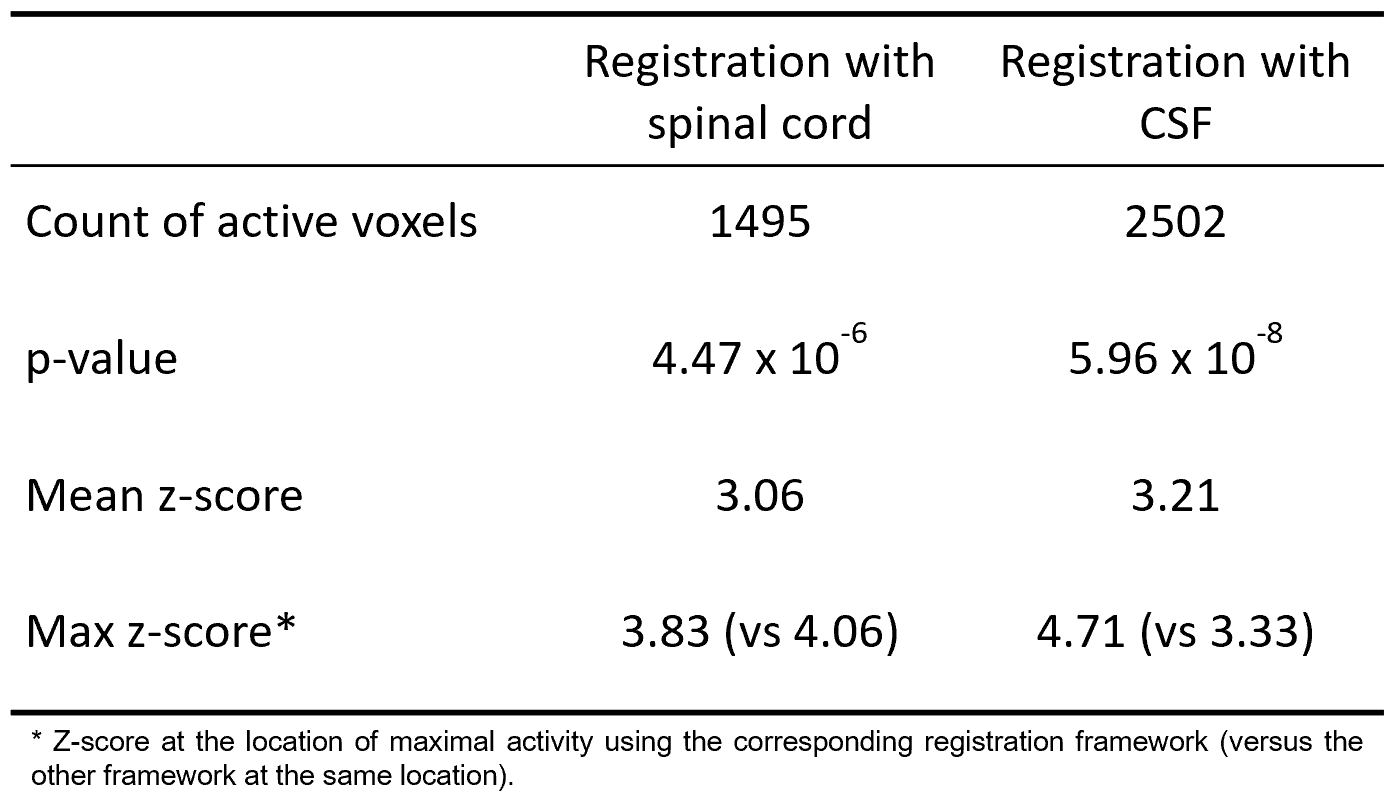
Table 1 and figure 2 present the results of the comparison between the two registration frameworks, showing a stronger and larger activity when registering the images using the CSF segmentation rather than spinal cord segmentation while being located at the same level (C6-C7 vertebral level) and within the spinal cord. Results show an increase of 67% in the number of active voxels at the group level, with an increase of 5% and 23% for the mean and max z-score, respectively.Discussion / Conclusion
Functional imaging of the spinal cord is challenging due to large susceptibility artifacts and signal dropouts. Improving the analysis protocols, including the inter- and intra-subject registration and normalization procedures, is an important step towards enhancing the robustness and reliability of spinal cord fMRI studies. This study presents an innovation on the normalization method for cervical spinal cord fMRI, leveraging the contrast between the CSF and surrounding structure to improve the robustness of group comparison. Indeed, the contrast between the CSF and the surrounding structure is usually better defined than the contrast between the spinal cord and CSF. Future work will apply the presented registration approach to motion correction, potentially decreasing the intra-subject variability and improving the robustness of single-subject analyses.Acknowledgements
The authors would like to acknowledge all participants to the study, as well as the BIC (McGill University) and UNF (Université de Montréal) members who helped in the MRI acquisition. This study was supported by the Canada First Research Excellence Fund via the TransMedTech Institute, the Healthy Brain for Healthy Lives (HBHL) initiative, the NSERC Discovery Grant awarded to JD, and the Fondation Courtois.References
1. Vahdat, S. et al. Simultaneous Brain–Cervical Cord fMRI Reveals Intrinsic Spinal Cord Plasticity during Motor Sequence Learning. PLoS Biol. 13, e1002186 (2015).
2. De Leener, B. et al. SCT: Spinal Cord Toolbox, an open-source software for processing spinal cord MRI data. Neuroimage 145, 24–43 (2017).
3. De Leener, B., Kadoury, S. & Cohen-Adad, J. Robust, accurate and fast automatic segmentation of the spinal cord. Neuroimage 98, 528–536 (2014).
4. De Leener, B. et al. PAM50: Unbiased multimodal template of the brainstem and spinal cord aligned with the ICBM152 space. Neuroimage 165, 170–179 (2018).
Figures